
Objective and Subjective Metrics for 3D Display Perception Evaluation
Andrea Albarelli, Luca Cosmo, Filippo Bergamasco and Andrea Gasparetto
Dipartimento di Scienze Ambientali, Informatica e Statistica, Universit
´
a Ca’ Foscari, Venice, Italy
Keywords:
Perspective Correction, Visual Interfaces, Stereoscopic Display.
Abstract:
Many modern professional 3D display systems adopt stereo vision and viewer-dependent rendering in order to
offer an immersive experience and to enable complex interaction models. Within these scenarios, the ability
of the user to effectively perform a task depends both on the correct rendering of the scene and on his ability to
perceive it. These factors, in turn, are affected by several error sources, such as accuracy of the user position
estimation or lags between tracking and rendering. With this paper, we introduce a practical and sound method
to quantitatively assess the accuracy of any view-dependent display approach and the effects of the different
error sources. This is obtained by defining a number of metrics that can be used to analyze the results of a set
of experiments specially crafted to tickle different aspects of the system. This fills a clear shortcoming of the
evaluation methods for 3D displays found in literature, that are, for the most part, qualitative.
1 INTRODUCTION
Several different approaches can be adopted to deal
with the visualization and exploration of 3D data rep-
resentations. The most common setup includes a dis-
play which presents a 2D projection of the 3D vi-
sual and some input method that allows the user to
navigate through the data. The visual metaphor used
and the control model depend on both the data and
the expected inspection logic. However, all these
systems share a very similar interaction paradigm
which usually includes a static user and a moving
viewport. Recently, some display systems have be-
gun to propose a reversed situation, where the user
moves around the data and interacts with them mainly
through his physical position or by using some in-
put device that operates in the physical space. We
are referring to the so-called Viewer-Dependent Dis-
play Systems, where visuals are rendered according
to the position of the user with the goal of offering
a scene that is always perceived as correct from the
user perspective. In addition to the obvious advan-
tages from a perceptual point of view, this kind of
displays are able to enable more complex interaction
models, where data can be actively inspected in an
immersive way and directly manipulated. Moreover,
a viewer-dependent display that respects a geometri-
cally correct projection allows the blending and com-
parison of physical and virtual objects, as they all
belong to the same metric space. This, in turn, en-
ables important application within the context of in-
Figure 1: The Ambassadors (1533). In this artwork Hans
Holbein depicts a perspectively transformed skull that can
be perceived correctly only from a specific point of view.
dustrial design and prototype validation. Finally, it
is easy to add stereoscopic 3D to these systems, as it
is just a matter of producing a different rendering for
each eye, accounting for its actual position. The idea
of a viewer-dependent display is not new at all and
predates modern technology by several centuries (see
Figure 1). In modern literature, it has been popular-
ized by the early implementations of the first immer-
sive virtual reality and CAVE environments (Deer-
ing, 1992; Cruz-Neira et al., 1993). More recently,
Harish and Narayanan (Harish and Narayanan, 2009)
combined several independent monitors arranged in
a polyhedra to create a multiple-angle display and a
fiducial marker system to track the user pose. In their
system the object is visualized as if it was inside the
solid space defined by the monitors. Garstka and Pe-
ters (Garstka and Peters, 2011) used a single planar
surface to display non-stereoscopic content according
to the pose of the user head obtained with a Kinect
309
Albarelli A., Cosmo L., Bergamasco F. and Gasparetto A..
Objective and Subjective Metrics for 3D Display Perception Evaluation.
DOI: 10.5220/0005280603090317
In Proceedings of the International Conference on Pattern Recognition Applications and Methods (ICPRAM-2015), pages 309-317
ISBN: 978-989-758-077-2
Copyright
c
2015 SCITEPRESS (Science and Technology Publications, Lda.)

sensor. A combination of Kinect devices and range
scanners have been adopted in a very similar approach
by Pierard et al. (Pierard et al., 2012). It should be
noted that, albeit implementing view-dependent solu-
tions, these approaches do not exploit stereoscopy. In
fact, their primary goal was to enable the user to walk
around the object rather than to offer a realistic depth
perception. Stereo vision is exploited, for instance, by
Hoang et al. (Hoang et al., 2013), that used standard
head tracking techniques to allow slight head move-
ments when looking at a 3D scene on a monitor. The
concept is very similar to the non-stereoscopic tech-
nique proposed a few years earlier by Buchanan and
Green (Buchanan and Green, 2008). In those cases,
while the correct projection is always offered to the
user, he is not allowed to inspect the object by moving
around it. Bimber et al. (Bimber et al., 2005) ignore
the user tracking problem and focused on the design
of a combined projection system that is able to ac-
count for non-planar surfaces, while still offering the
correct perspective. This approach allows to materi-
alize virtual objects in non-specialized environments,
such as archaeological sites. Within all the aforemen-
tioned studies, the evaluation is for the most part qual-
itative. The performance of the system is usually as-
sessed using questionnaires filled by users or by mea-
suring the time required to perform simple tasks. With
this paper we are introducing a novel evaluation ap-
proach that differs from the literature since it intro-
duces both a set of quantitative metrics and proper
procedures to measure them. Every care has been
made to make such metrics objective. In fact some
of them does not even require an human user to be
included in the evaluation loop. Furthermore, even
when an user is involved, we tried to make the evalu-
ation procedure very simple and to avoid as much as
possible the interference of personal considerations.
It is important to stress that this work is not concerned
at all about user liking or appreciation, which is a
topic well beyond our competence. Specifically, we
are interested in the definition of a set of quantitative
measures that can be used to compare different as-
pects of viewer-dependent visualization systems.
2 VIEWER-DEPENDENT
DISPLAYS
Each viewer-dependent display system includes dif-
ferent components and operates in a different manner.
For instance, some perform the tracking using visual
markers that can be captured with cameras, other re-
lies on the 3D reconstruction of the pose of the user
head or even on wearable sensors such as accelerom-
eters or gyroscopes. Also the visualization part of the
system can vary a lot, including full fledged CAVE
systems, table surfaces, wall displays or even hand-
held devices. Still, these two elements (tracking and
rendering system) are to be found in every viewer-
dependent display and can be deemed to be the main
cause of incorrect of faulty behaviour.
2.1 Tracking System
Generally speaking, the tracking system is the set of
devices and algorithms that are used to get an esti-
mate of the position of the user head. Such estimate
could be just an approximate location of the head cen-
ter or the position of each eye (depending on the type
of rendering and on the technologies involved). Sev-
eral different solutions can be adopted to solve this
problem. The most common approaches uses fiducial
markers (that can be little IR-reflective spheres, Aug-
mented Reality markers, LEDs, etc.) to be detected
and tracked by cameras or other sensors. Within
most scenarios, multiple calibrated cameras are used
to triangulate observed reference points and to obtain
a 3D position in the Euclidean space. Other tech-
niques are not vision-based and use embedded sen-
sors, often combined with dead-reckoning techniques
and prediction-correction filters.
2.2 Scene Rendering System
The position of the user must be placed in a common
reference frame with the display surface. Such sur-
face can be as simple as a single flat wall or it can
include several combined continuous sections (this
is the case with CAVE systems). It can even be a
generic non-regular surface, in which case an accurate
3D model is needed in order to compute the proper
rendering. The goal of the rendering system is to
draw on this surface with the constraint that the scene
should appear as seen from the user point of view.
This can be done with simple geometrical transform,
if the surfaces are regular, or by using specialized ver-
tex shaders, in the case of a general surface.
2.3 Error Sources
Before talking about the proposed evaluation metrics,
it is useful to pinpoint the error sources that jeopar-
dize the optimal working of the system. For example,
Figure 2 shows some deformations due to inaccurate
behavior of the system (simulated and exaggerated).
Putting aside macroscopic issues, such as misaligned
cameras or swapped left and right eye frames, we can
identify four different error sources.
ICPRAM2015-InternationalConferenceonPatternRecognitionApplicationsandMethods
310
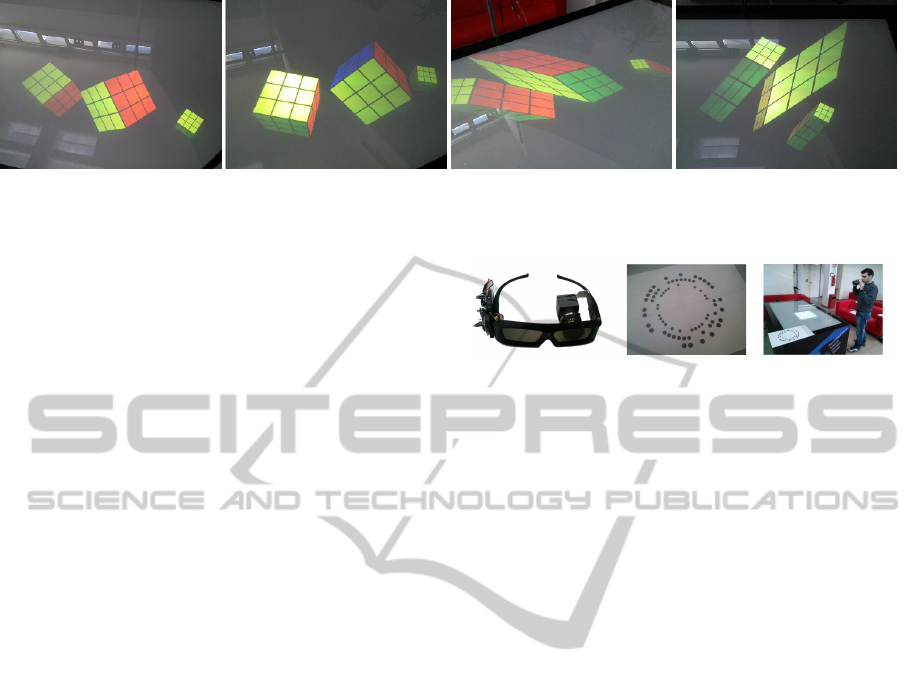
Figure 2: A pair of Rubik cubes shown on a viewer-dependent display as seen from different angles. The first two images have
been obtained by putting a camera behind a lens of tracked shutter glasses. The remaining images are obtained by offsetting
the camera and they are representative of the type of distortion error resulting from bad tracking.
Calibration Errors: inaccuracies in the calibration
of the tracking system or in the estimation of the ge-
ometry of the display lead to a bias on the estimated
position of the user with respect to the sensors refer-
ence frame and to the display. This error source could
result in a systematic underestimation or overestima-
tion of the objects dimensions in the projected scene,
or other types of distortions.
Tracked Features Localization Errors: this is a
(usually) unbiased positional error due inaccuracies
in the localization of the tracked features (for instance
blobs on the image plane). As for calibration errors it
produces a slight deformation of the observed scene;
however its unbiased nature leads to zero mean dis-
tortions. Furthermore, its magnitude it rather small as
the typical uncertainty is usually small with good sen-
sors, which often translates in a negligible perception
error.
System Lag: the limited frame rate of the tracking
sensor, added to the display response time and to the
image processing time, introduces a lag between the
user movements and the stabilization of the new view-
ing position. This produces skewed scenes alike cal-
ibration errors, however these distortions disappear
completely when the user stops moving. The typi-
cal lag is below four or five frames, thus the delay is,
in most cases, below one tenth of second.
Eye Disparity Error: the interpupillary distance is,
on the average, about 6.5 cm, but significant devi-
ations have been observed in humans. It has been
shown that inconsistencies between expected and ac-
tual eye disparity would produce both wrong depth
perception and skewed images when the scene is seen
from large angles (Thorpe and Russell, 2011). This
kind of error of course appears only when stereo-
scopic rendering is adopted.
3 QUANTITATIVE EVALUATION
METRICS
Given the subjective nature of this type of displays,
Figure 3: Glasses and the fiducial marker used for testing.
it is very difficult to supply some quantitative assess-
ment about their accuracy (or even to define what re-
ally does ”accuracy” mean). In fact, most of the liter-
ature limits the evaluation section to qualitative shots
of the views or to subjective reporting of the quality
perceived by the user. While this is perfectly fine for
many application scenarios, in this paper we would
like to propose a suitable method to quantitatively
measure the performance of a viewer-dependent ren-
dering setup. Furthermore, we would like this method
to be objective and general enough to be usable to
compare different systems under different usage con-
ditions. To this end, we will account for several fea-
tures characterizing this kind of systems, including
the accuracy of the user pose estimation, the compli-
ance between the scene that the user is expected to
observe and what he really sees, and the effect of the
lag introduced by the whole pose estimation/display
loop.
3.1 System-related Metrics
The first set of metrics that we are introducing are
called System-Related Metrics. They do not include
any human user within the evaluation loop, thus they
can be regarded as fully objective. To obtain this re-
sult, we propose to perform the evaluation by means
of a specially crafted setup which includes a cali-
brated camera mounted in place of the user head.
The exact mounting method depends of course on
the tracking system, however, since the used device
should be designed to accommodate the whole user
head it should be always feasible. For example, in
Figure 3, we show a modified pair of shutter glasses,
which we augmented with a camera mounted behind
a lens. The measuring experiment is carried on by
ObjectiveandSubjectiveMetricsfor3DDisplayPerceptionEvaluation
311
placing a physical fiducial tag (in the example of Fig-
ure we used a Rune-Tag fiducial marker (Bergamasco
et al., 2011)) on the origin of the world coordinate
system and by displaying a rendered tag inside the
virtual scene. That can be in any position and with
any angle. The typical experimental run involves the
recording of a video while the camera is moving along
some pattern. Within such video the camera should
be able to capture both the reference physical marker
on the table and the virtual marker displayed by the
system. For each frame it is possible to compute:
• the pose of the camera center resulting from the
output supplied by the tracking system (T
pose
);
• the pose of the camera center resulting from the
estimation obtained with physical marker (M
pose
);
• the centers of the ellipses on the image plane of
the virtual marker as seen by the camera (C
centers
);
• the centers of the ellipses on the image plane of
the virtual marker as reprojected by considering
the camera pose, its intrinsic parameters and the
position of the virtual marker in the world coor-
dinate system (R
centers
). We use the location of
the camera obtained with T
pose
and the orientation
obtained with M
pose
. This way we guarantee the
most faithful orientation of the image plane while
still adopting the estimated point of view.
Note that M
pose
is expected to be significantly
more accurate than T
pose
, since the fiducial marker
used, differently from the tracker output T
pose
, should
offer a larger amount of information to assess the
camera pose (in the example we used several hun-
dreds ellipses). Moreover, errors in M
pose
only de-
pend on the intrinsic parameters of the camera (which
should be a high-end computer vision camera with
low distortion), while T
pose
is affected by the calibra-
tion of each sensor, by the calibration of their relative
motion and also by the estimated location of the world
reference frame. For these reasons we can consider
M
pose
as a reasonable ground-truth. Of course, for the
results to be comparable between different systems,
the same type of fiducial marker and camera should
be used.
3.1.1 Pose Accuracy
We propose to base the evaluation of the accuracy of
the pose estimation on the distance between the cam-
era center computed by M
pose
and T
pose
. Note that
there is no point in considering the orientation of the
camera, since it has no influence in the image forma-
tion process on the display. Note also that we expect
M
pose
and T
pose
to be separated by a constant offset,
since we cannot guarantee that the center of projec-
tion of the camera is exactly mounted where the user
Figure 4: For interaction-based measures, humans are in-
serted in the loop, asking them to perform measurements.
eye is expected to be. This is also true for the user
eyes and is a known approximation accepted by the
approach (the effects of such approximation will be
evaluated in the following section). For this reason
we define the pose accuracy as the standard deviation
of the distance between M
pose
and T
pose
over a video
sequence. The synopsis of such video sequence could
influence the measured value, in fact a smooth move-
ment along a curve could lead to different results than
a slow movement along a straight line or an acceler-
ation with a rotation around an axis. This means that
for pose accuracy to be meaningful, it should be com-
plemented with precise information about the measur-
ing conditions (which can be inferred by M
pose
).
3.1.2 Reprojection Accuracy
The evaluation of the pose estimation accuracy, while
assessing the stability of the tracker, gives little in-
sight about the effects of various error sources on the
scene actually observed by the user. To better study
this aspect, which is the primary goal of a viewer-
dependent display system, we propose to compute the
RMS error between the points observed by the cam-
era (C
centers
) and the coordinates on the image plane
obtained by reprojecting the centers of the ellipses be-
longing to the virtual marker (R
centers
). We call re-
projection accuracy the average of the RMS over a
sequence. In practice, this value gives a measure of
the compliance between the scene that is actually ob-
served and the scene that the system expects the user
to observe. Ultimately, the reprojection accuracy ac-
counts for all the error sources (including the pose es-
timation bias) and supplies a value that is somehow
meaningful also from a perception perspective. As
for the pose accuracy, also the reprojection accuracy
is influenced by the sequence over which it is com-
puted, thus information about the acquiring condition
should always be supplied.
3.2 Interaction-related Metrics
To study the ability of the system to support interac-
tion, we need to introduce humans into the evalua-
ICPRAM2015-InternationalConferenceonPatternRecognitionApplicationsandMethods
312

tion. Specifically, we propose to consider the accu-
racy and repeatability of direct measures of virtual ob-
jects performed by a user using a physical ruler (see
Figure 4). To translate the obtained measures into
metrics that can be useful for evaluation purposes,
three steps should be performed:
• all the data obtained are converted into relative er-
rors with respect to the correct measure of the vir-
tual object. The term correct is of course referred
to the measure that the object should exhibit in the
ideal working conditions of the system;
• a cumulative distribution of the error is computed.
This can be obtained by a direct sorting of the ob-
tained values and by computing for each sample
the ratio between the number of samples that ex-
hibit error values smaller than it and the total num-
ber of samples gathered;
• finally, an error probability density function (er-
ror PDF) can be computed over the cumulative
distribution as estimated with a non-parametric
Kernel Density Estimator (KDE) based on
the Parzen-Rosenblatt window method (Parzen,
1962; Rosenblatt, 1956). This is a rather standard
statistical estimator that helps us in getting a more
accurate idea about the overall error distribution
that underlies the measure processes.
To avoid any bias, measures should be performed
by statistically meaningful sample of users (at least
with respect to the intended application). Differ-
ently the type of users involved should be specified
in order to make the results comparable. Further-
more, in a similar manner to system-related metrics,
also interaction-related metrics are influenced by the
scenes that are used for the tests, thus the character-
istics of the scene should be reported to complement
each study that adopt this kind of metric.
3.2.1 Measurement Bias
Once the error PDF has been obtained, we can com-
pute the measurement bias as the average of such
function. This metric expresses the ability of the sys-
tem to offer unbiased visual representations to the
user. That is, measurement bias is proportional to the
total amount of systematic error introduced by the dif-
ferent sources, including sensor calibration, assign-
ment of a common reference frame, and, where ap-
plicable, lags and stereoscopic errors. It should be
noted that this metric should be reasonably free from
error sources coming from the user himself since, if
the scenes have been designed correctly and the user
shows no visual impairments, there are no reasons
to think that the measures he takes with a real ruler
should be biased.
3.2.2 Measurement Repeatability
The measurement repeatability is computed as the
standard deviation of the error PDF. Obviously it mea-
sures the error dispersion around the average, that is
the ability of the system to allow the user to take ac-
curate and repeatable measures. Differently from the
measurement bias, with the measurement repeatabil-
ity the user directly contributes to the metric. In fact,
even if the system was working under ideal conditions
(and even using physical objects instead of virtual ob-
jects), the measurement performed would still suffer
from uncertainty introduced by the resolution of ruler
and the skill of the operator. There is no way to avoid
this contamination, however it is reasonable to think
that, if the participants to the tests are chosen properly,
the effect of the user introduced error will be simi-
lar between different experiments, thus the obtained
measurement repeatability would remain comparable.
4 PUTTING THE METRICS AT
WORK
In order to evaluate the practical convenience of the
proposed metrics, we designed an apt setup which
embodies a quite simple viewer-dependent system.
Specifically, we augmented a pair of shutter glasses
with two infrared leds tracked by a network of cam-
eras. The scenes were displayed on a horizontal in-
teractive table of known geometry and were rendered
according to a projection matrix computed using the
estimated position of the user eyes as reference. Left
and right images were rendered separately, accord-
ing to the position of each eye, in order to produce
a proper stereoscopic scene coherent with the real
space.
4.1 Testing System-related Metrics
We captured a several minutes long video from ran-
dom but continuous camera movements. We extracted
from the video three sections that we consider to be
significant with respect to different operating condi-
tions: respectively a smooth movement along a curve,
a slow movement along a straight line and an acceler-
ation with a rotation around the same axis.
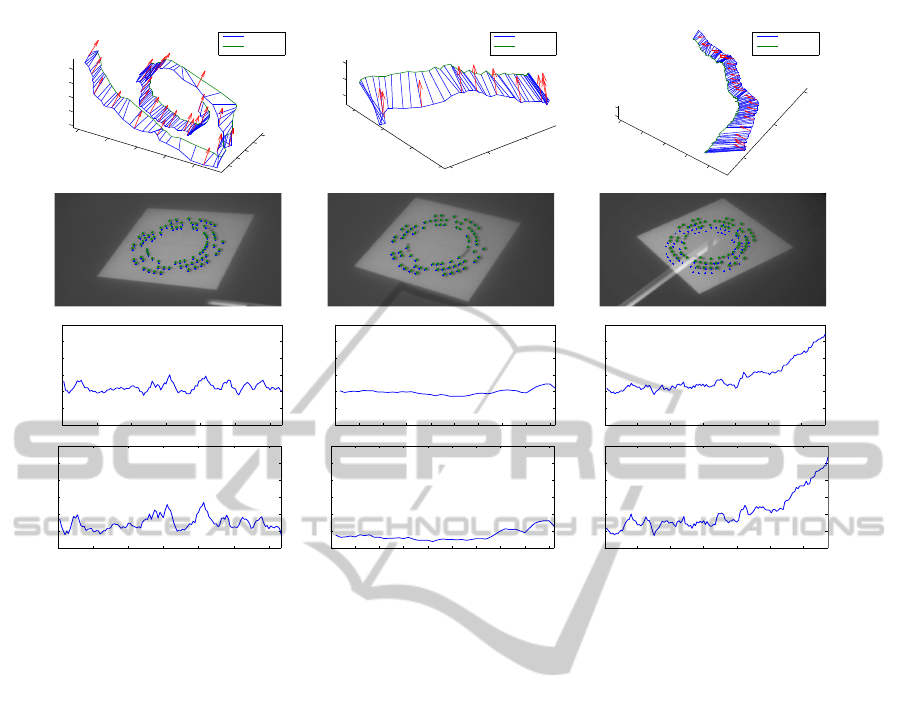
The tracks of such movements are shown in the
first row of Figure 5. In the second row of the same
figure we plotted the distance between M
pose
and T
pose
that is used to compute the pose accuracy. In the third
row we show some frame examples with (R
centers
)
overlayed to (C
centers
). This could give an anecdotal
evidence about the accuracy of the reprojection. The
ObjectiveandSubjectiveMetricsfor3DDisplayPerceptionEvaluation
313
−500
−400
−300
−200
−100
−600
−400
−200
1000
1050
−400
−300
−200
−100
0
−650
−600
−550
−500
−450
850
900
950
1000
1050
−400
−350
−300
−650
−600
−550
−500
860
880
900
0 20 40 60 80 100 120
40
50
60
70
80
90
100
time (s)
distance (mm)
0 5 10 15 20 25 30 35 40 45
40
50
60
70
80
90
100
time (s)
distance (mm)
0 20 40 60 80 100 120
40
50
60
70
80
90
100
time (s)
distance (mm)
0 20 40 60 80 100 120
0
5
10
15
20
25
30
time (s)
RMS (px)
0 5 10 15 20 25 30 35 40 45
0
5
10
15
20
25
30
time (s)
RMS (px)
0 20 40 60 80 100 120
0
5
10
15
20
25
30
time (s)
RMS (px)
Marker GT
Led Postion
Marker GT
Led Postion
Marker GT
Led Postion
Figure 5: Evaluation of the accuracy in the pose estimation and positional error on the image plane.
actual reprojection RMS (used to compute reprojec-
tion accuracy) has been plotted in the fourth row.
As expected, the best pose accuracy (1.72mm)
and reprojection accuracy (3.35 pixels) are obtained
with the smooth movement along a line (central col-
umn). The slow movement along a curve (first col-
umn) obtains the second best results, with a pose ac-
curacy of 2.63mm and a reprojection accuracy of 7.06
pixels. Finally, the accelerating trajectory (third col-
umn) exhibits the higher error with a pose accuracy of
8.67mm and a reprojection accuracy of 9.97 pixels.
A better insight could however be gained by ana-
lyzing the plots, in fact it is apparent that the higher
error is mainly due to the acceleration in the last part
of the trajectory, which gives us an hint about the role
of system lag as the dominant error source under such
conditions.
4.2 Testing Interaction-related Metrics
The user eyes are the ultimate acquisition device that
closes the visualization loop. Any quantitative assess-
ment can also be performed by the user itself by oper-
ating some objective action, sensing or measure that
depends on his/her perception of the scene. To this
end, we designed a set of tests involving measuring
some sizes and distances in two virtual scenes using a
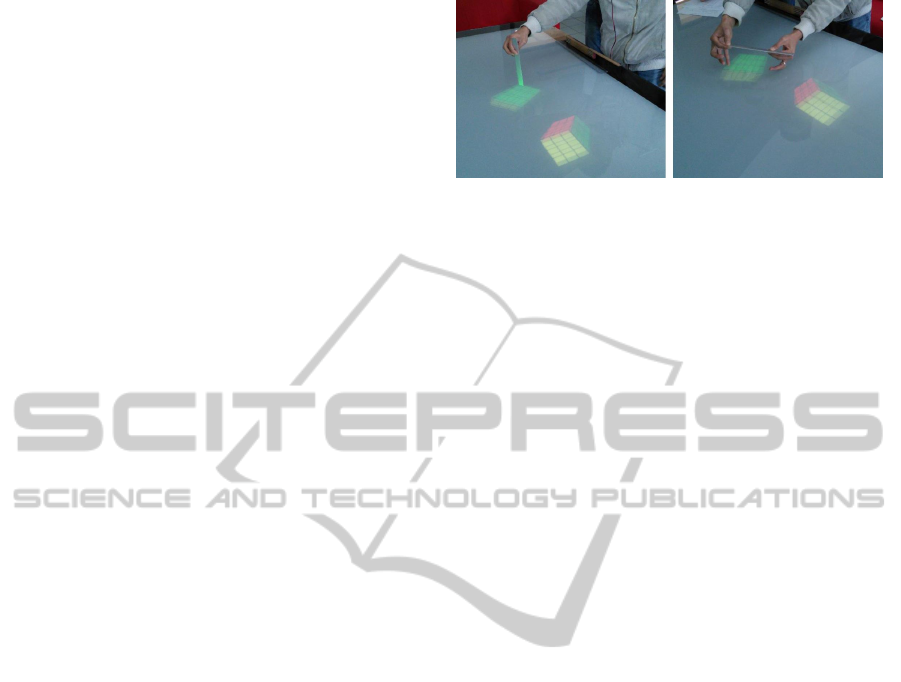
physical ruler, as shown in Figure 4. The two scenes
are (1) a pair of Rubik’s cubes with a side of about
10 cm floating a few centimeters over the table sur-
face, and (2) a synthetic view picturing Saint Mark’s
Place in Venice, about 60 cm wide. For each scene,
the user was asked to obtain three measures, for a to-
tal of six measures for each test (see Figure 6 to view
both the scenes and the measurements required). Each
user performed two consecutive tests, a few made
three tests. Such measures have been designed to in-
vestigate different adverse distortions under different
viewing conditions. The viewing conditions are:
• tracked binocular view: the standard display
mode with the tracking system enabled and the
stereo vision activated. Under this condition the
only distortions should be attributable to the un-
avoidable error sources described;
• untracked binocular view: stereo vision is en-
abled, but the perspective is not corrected accord-
ing to the user position. This is the condition for
a standard stereoscopic content, such as consumer
grade movies and video games. This test has been
performed by letting the user to move in search of
the better viewing position, so that measure errors
derive from inability in finding the exact point of
view;
• tracked monocular view: stereo vision is disabled,
but the perspective is corrected with respect to
the user point of view. This is the approach
ICPRAM2015-InternationalConferenceonPatternRecognitionApplicationsandMethods
314

adopted by many viewer dependent display de-
scribed in the literature and is similar in spirit to
some trompe l’œil images. Of course, lacking any
stereoscopic vision, the depth perception will be
hindered.
We involved 11 users (7 males and 4 females)
aged 21–27 (avg. 24) for a total of 121 different
measures (60 on the Rubik’s cubes scene, 61 on the
St. Mark’s Square scene). All the user were neither
stereo blind nor color blind, and the environmental
conditions (e.g., light) was the same for all the tests.
The measures were almost evenly distributed among
the three viewing conditions, with the exception of
a height measure in the Rubik’s cubes scene under
monocular vision that did not produce meaningful
values due to the lack of depth perception and was
excluded from the evaluation. For each test the scene
was slightly changed to guarantee independence and
a wide range of different viewing angles. Specifically,
both scenes where randomly rotated by ±10 degrees
and scaled by ±10 percent. All the obtained measures
were then converted in percentage error, in order to
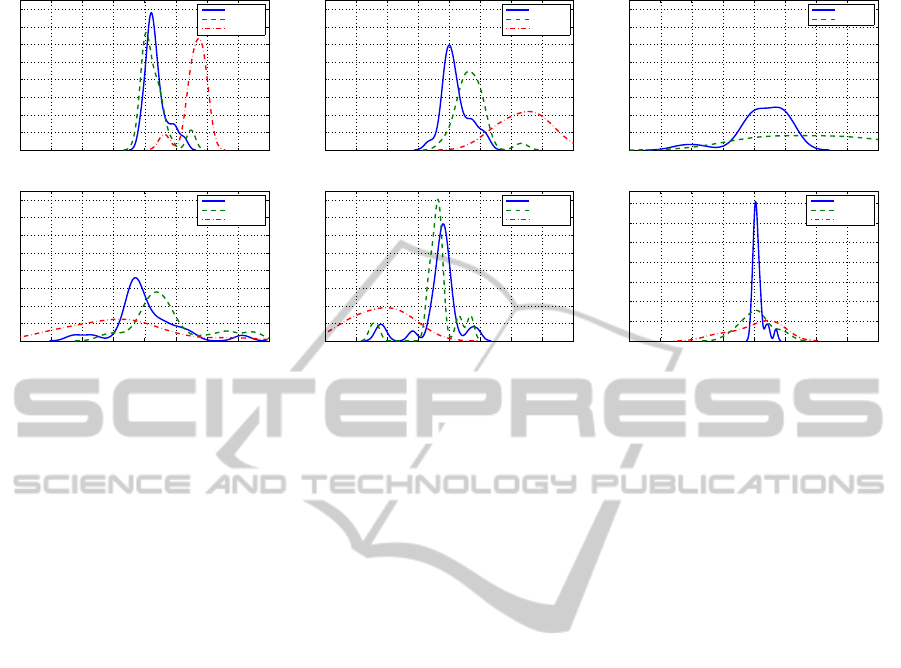
make them comparable. The results are shown in Fig-
ure 7, where we present the error PDfs.
Rubik - Aligned Measure: the first case, whose re-
sult is plotted in Figure 7a, corresponds to measuring
the side of a Rubik’s cube parallel to the table edge,
i.e., orthogonal to the line of sight. With this scene we
obtained respectively for the tracked, untracked and
monocular renderings a measurement bias of 3.6, 3.0
and 16.3 and a measurement repeatability of 3.4, 4.4
and 3.7. In this case both tracked and untracked scene
renderings produced accurate measurements, this is
due to the fact that the measured cube’s side is orthog-
onal to the view frustum. In fact, the affine transform
induced by the lack of tracking is (in this case) mostly
a skew along the subspace complementary to the line
of sight, which does not strongly affect the segments
that entirely lie in it. Differently, the lack of depth per-
ception due to monocular vision severely hinders the
measure, showing a clear bias that results in a consis-
tent overestimation of the side length. From this first
set of observations, we can speculate that tracking is
not crucial when the object of interest is orthogonal to
the line of sight; on the other side, stereoscopic vision
seems essential to properly relate a virtual object with
the physical world.
Aligned Measure
Askew Measure
Height Measure
Tower to Palace
Tower to Square
Tower to Dome
Figure 6: Scenes shown and measures to perform.
Rubik - Askew Measure: in this scene the measure is
done along a cube’s side askew with respect to the line
of sight; we obtained a measurement bias of 2.1, 7.0
and 23.8 and a measurement repeatability of 4.3, 4.4
and 7.1, respectively for the tracked, untracked and
monocular renderings. As shown by Figure 7b, while
the measure made on the tracked rendering maintains
an accuracy similar to the previous experiment, the
measure made on the untracked rendering has a no-
ticeable bias, due to the slanting of the object if seen
from a direction not coherent with the rendering point
of view. Unsurprisingly, albeit correct with respect to
perspective, monocular vision is also inadequate.
Rubik - Height Measure: in this test the user is
asked to measure the height of the topmost cube cor-
ner with respect to the table surface. This implies
putting the base of the ruler in contact with the physi-
cal table and aligning the measuring strip with the vir-
tual cube. Monocular vision is unsuitable for this task
due to the lack of depth perception, and no user was
able to place the ruler in an even approximately cor-
rect position, therefore we excluded this vision condi-
tion from the evaluation. For the remaining viewing
conditions we obtained respectively for the tracked
and untracked renderings a measurement bias of 2.6
and 8.8 and a measurement repeatability of 20.0 and
18.1. As in the previous cases, the tracking in scene
rendering is important (Figure 7c).
Saint Mark - Tower to Dome Distance: we obtained
respectively for the tracked, untracked and monocu-
lar renderings a measurement bias of -0.2, 8.0 and -
8.5 and a measurement repeatability of 10.5, 12.3 and
16.0. The St. Mark’s tower to church’s dome distance
is measured through a slightly skewed angle and the
distribution of the measures for both the tracked and
untracked case (Figures 7d) confirms the conclusions
postulated with the skewed Rubik’s cube side mea-
sure. Monocular view, however, results in both a neg-
atively biased measure and larger data dispersion. We
believe that the larger error is due to the lack of a vis-
ible straight line, like the cube side.
Saint Mark - Tower to Palace Distance: with this
scene we obtained respectively for the tracked, un-
tracked and monocular renderings a measurement
bias of -3.4, -4.4 and -22.0 and a measurement re-
peatability of 7.0, 7.2 and 7.9. This measure is quite
similar to the previous one (Figure 7e), albeit the
line connecting the tower to the palace is a little less
oblique, thus allowing for a lower dispersion and a
smaller difference between the measures made with
the tracked and the untracked renderings.
Saint Mark - Tower to Square Distance: this fi-
nal test is different from the previous two as one end
point for the measure actually lies on the table sur-
ObjectiveandSubjectiveMetricsfor3DDisplayPerceptionEvaluation
315
−40 −30 −20 −10 0 10 20 30 40
0
0.02
0.04
0.06
0.08
0.1
0.12
0.14
0.16
percent deviation
probability density
Rubik: Aligned Measure (a)
Tracked
Untracked
Monocular
−40 −30 −20 −10 0 10 20 30 40
0
0.02
0.04
0.06
0.08
0.1
0.12
0.14
0.16
percent deviation
probability density
Rubik: Askew Measure (b)
Tracked
Untracked
Monocular
−40 −30 −20 −10 0 10 20 30 40
0
0.02
0.04
0.06
0.08
0.1
0.12
0.14
0.16
percent deviation
probability density
Rubik: Height Measure (c)
Tracked
Untracked
−40 −30 −20 −10 0 10 20 30 40
0
0.02
0.04
0.06
0.08
0.1
0.12
0.14
0.16
percent deviation
probability density
Saint Mark: Tower to Dome (d)
Tracked
Untracked
Monocular
−40 −30 −20 −10 0 10 20 30 40
0
0.02
0.04
0.06
0.08
0.1
0.12
0.14
0.16
percent deviation
probability density
Saint Mark: Tower to Palace (e)
Tracked
Untracked
Monocular
−40 −30 −20 −10 0 10 20 30 40
0
0.05
0.1
0.15
0.2
0.25
0.3
0.35
percent deviation
probability density
Saint Mark: Tower to Square (f)
Tracked
Untracked
Monocular
Figure 7: Relative error probability densities resulting from kernel density estimation computer over the experimental data.
face. Such point is indeed a physical reference, hence
it is not affected by errors in tracking or stereo vision.
Having a well identifiable reference point simplifies
a lot the measure and reduces the error sources. As
shown in Figure 7f, all the viewing condition setups
were able to produce more accurate results (note the
different scale of the graph). In fact, we obtained re-
spectively for the tracked, untracked and monocular
renderings a measurement bias of 1.3, 0.8 and 0.7 and
a measurement repeatability of 1.8, 7.2 and 7.2.
5 CONCLUSION
With this paper we addressed the quantitative evalua-
tion of viewer-dependent display systems. The main
goal was to define an evaluation method that does not
depend on a specific implementation and that can be
used to compare different systems. We introduced
two metrics, complemented by two associated exper-
imental procedures. One metric is designed to mea-
sure the performance of the system without includ-
ing a human in the loop. The other one requires a
user to perform some direct measurements. While
some external error sources would be introduced, we
think that a metric that includes user interaction is
needed for a meaningful system evaluation. In the
experimental section we tested the newly introduced
metrics with a quite neutral viewer-dependent display
system. The goal of such evaluation was not to assess
the performance of the described system, but rather
to study if the proposed methodology was practical
to apply and would produce a satisfactory level of in-
sight. With respect to this, we were able to obtain a
complete analysis of the many aspects of the system,
under different operating and rendering conditions.
Future work will include the use of this methodology
within an in-depth review of recent systems.
REFERENCES
Bergamasco, F., Albarelli, A., Rodola, E., and Torsello, A.
(2011). Rune-tag: A high accuracy fiducial marker
with strong occlusion resilience. In Proceedings of the
2011 IEEE Conference on Computer Vision and Pat-
tern Recognition, CVPR ’11, pages 113–120, Wash-
ington, DC, USA. IEEE Computer Society.
Bimber, O., Wetzstein, G., Emmerling, A., and Nitschke,
C. (2005). Enabling view-dependent stereoscopic pro-
jection in real environments. In Mixed and Augmented
Reality, 2005. Proceedings. Fourth IEEE and ACM In-
ternational Symposium on, pages 14–23.
Buchanan, P. and Green, R. (2008). Creating a view depen-
dent rendering system for mainstream use. In Image
and Vision Computing New Zealand, 2008. IVCNZ
2008. 23rd International Conference, pages 1–6.
Cruz-Neira, C., Sandin, D. J., and DeFanti, T. A. (1993).
Surround-screen projection-based virtual reality: The
design and implementation of the cave. In Proceed-
ings of the 20th Annual Conference on Computer
Graphics and Interactive Techniques, SIGGRAPH
’93, pages 135–142, New York, NY, USA. ACM.
Deering, M. (1992). High resolution virtual reality. In Pro-
ceedings of the 19th Annual Conference on Computer
Graphics and Interactive Techniques, SIGGRAPH
’92, pages 195–202, New York, NY, USA. ACM.
Garstka, J. and Peters, G. (2011). View-dependent 3d pro-
jection using depth-image-based head tracking. In
Proceedings of the 8th IEEE International Workshop
on ProjectorCamera Systems, PROCAM ’11, pages
41–47. IEEE.
ICPRAM2015-InternationalConferenceonPatternRecognitionApplicationsandMethods
316

Harish, P. and Narayanan, P. J. (2009). A view-dependent,
polyhedral 3d display. In Proceedings of the 8th In-
ternational Conference on Virtual Reality Continuum
and Its Applications in Industry, VRCAI ’09, pages
71–75, New York, NY, USA. ACM.
Hoang, A. N., Tran Hoang, V., and Kim, D. (2013). A real-
time rendering technique for view-dependent stere-
oscopy based on face tracking. In Proceedings of
the 13th International Conference on Computational
Science and Its Applications - Volume 1, ICCSA’13,
pages 697–707, Berlin, Heidelberg. Springer-Verlag.
Parzen, E. (1962). On estimation of a probability den-
sity function and mode. The Annals of Mathematical
Statistics, 33(3):1065–1076.
Pierard, S., Pierlot, V., Lejeune, A., and Van Droogen-
broeck, M. (2012). I-see-3d ! an interactive and im-
mersive system that dynamically adapts 2d projections
to the location of a user’s eyes. In 3D Imaging (IC3D),
2012 International Conference on, pages 1–8.
Rosenblatt, M. (1956). Remarks on some nonparametric
estimates of a density function. The Annals of Mathe-
matical Statistics, 27(3):832–837.
Thorpe, J. R. and Russell, M. J. (2011). Perceptual effects
when scaling screen size of stereo 3d presentations.
SMPTE Conferences, 2011(1):1–10.
ObjectiveandSubjectiveMetricsfor3DDisplayPerceptionEvaluation
317
