
Critical Activity Effect on Project Duration in
Precedence Diagram Method Scheduling Network
S. A. Nisar and K. Suzuki
Department of Civil Engineering, Nagoya Institute of Technology, Gokiso-cho, Showa-ku, Nagoya, Japan
Keywords: Construction Project Management, Project Scheduling, Critical Path Method, Precedence Diagram Method.
Abstract: Precedence Diagram Method (PDM) scheduling network with its additional relationships i.e., start-to-start,
finish-to-finish, and start-to-finish, between activities provides more flexible schedule than traditional
Critical Path Method (CPM). But, changing the duration of critical activities in PDM network will have
anomalous effect on critical path and project duration. Researchers have proposed some classification of
critical activity effects. However, these classifications were not completed and could not indicate all the
critical activity’s characteristics. In this paper we do further study on classifications of critical activity effect
and provide more information in detailed. Furthermore, we determine the maximum amount of time for
each class of critical activity effect by which the project managers can control the dynamic feature
(shortening/lengthening) of critical activities and project duration more efficiently.
1 INTRODUCTION
Schedule is the key element in the management of
construction projects. A project schedule establishes
the start date, duration, completion date, and
resource needs for each activity in the project.
Mistakes in the schedule may cause the project team
to allocate resources to the wrong place at the wrong
time or may prevent the parties from accurately
assessing the information whether the project is
ahead of or behind the schedule.
Critical Path Method (CPM), which is developed
in the 1950s, is a powerful network diagramming for
representation of activities of project. The CPM has
been widely used as a construction project
management tool to improve scheduling and project
administration tasks, and supporting project
managers to ensure a project to be completed on
time and within the budget (Ahuja, 1994).
In CPM, once the project network is drawn the
following steps are performed: (i) a forward pass to
determine the earliest start time (ES) and earliest
finish time (EF) for activities, (ii) a backward pass to
determine the latest start time (LS) and latest finish
time (LF) for activities, (iii) float calculations and
(iv) identification of critical activities and critical
path(s). This information is very important for the
project manager to plan and control the project more
actively and efficiently (Ahuja, 1994).
Critical path and Float are the most important
concepts among the all information in a project
schedule. There are several types of floats, of which
the simplest and most important type of float is total
float (TF) and free float (FF). TF is the maximum
amount of time for which the finish date of an
activity can be delayed without affecting the
completion of the entire project. TF is calculated as
the difference between LS and ES or between LF
and EF of an activity. Free float (FF) is the amount
of time for which the finish date of an activity can be
delayed without affecting the start time of any other
activities in a project. FF is calculated as the
difference between the earliest ES among all the
immediate successors of an activity and the EF of
that activity. Critical path is the longest ordered
sequence of activities through the project schedule,
and it determines the earliest time by which a project
can be completed. This time is often known as the
project duration but more commonly as the critical
path. A schedule may have more than one critical
path. Each activity in critical path is known as a
critical activity. The critical activity has zero TF.
When any of them is delayed, it causes a delay in the
project completion date.
However, the traditional CPM was essentially
limited to finish-to-start (FS) relationships between
activities, i.e., the successor activity cannot start
314
A. Nisar S. and Suzuki K..
Critical Activity Effect on Project Duration in Precedence Diagram Method Scheduling Network.
DOI: 10.5220/0005281503140322
In Proceedings of the International Conference on Operations Research and Enterprise Systems (ICORES-2015), pages 314-322
ISBN: 978-989-758-075-8
Copyright
c
2015 SCITEPRESS (Science and Technology Publications, Lda.)

until the predecessor activity is completed.
Therefore, it could not allow overlapping unless
activities were further divided (Fondahl, 1961).
Precedence Diagram Method (PDM), which was
developed based on the concept of CPM analysis,
introduced three alternative relationships, i.e., start-
to-start (SS), finish-to-finish (FF), and start-to-
finish; and lag factor between various activities. The
PDM is also called activity on node (AON) network,
and some authors call both methods (CPM and
PDM) as CPM. PDM with three additional
relationships between activities has provided a more
flexible realistic project representation in schedule
networks and more accurately reflects the sequence
of construction operations as they occur in real life
(Ahuja, 1994). There are various computer software
packages available such as Primavera P6 and MS
Project, which provide the PDM schedule.
PDM seems to be more friendly compare to the
CPM. For example, suppose that providing concrete
floor for a warehouse needs three construction
activities. Let activity A is “install formwork,
activity B is “reinforcement arrangement”, and
activity C is “pour concrete”. The duration of each
activity is estimated as 4, 4 and 2 days, respectively.
Based on CPM assumption the technological
relationship between these three activities will be
finish-to-start, and they have to be executed as
series. Therefore, the project duration would be 10
days. Whereas, in PDM as shown in Fig.1, activity
A “reinforce arrangement” and activity B “install
formwork” can be executed concurrently so that
start-to-start with two days lag would be the prober
relationship between them. Thus, the PDM
relationship reduces the project duration to 8 days.
However, the new relationships of PDM can
change some of the basic concept of critical
activities and critical path. According basic
definition of critical activity in CPM, the
shortening/lengthening of a critical activity on
critical path always results in decreased/increased
project duration. But, this definition does not always
apply on PDM. Crashing some critical activity in
Figure 1: PDM schedule with SS relation.
PDM in order to reduce the project duration can
have anomalous effects (Wiest, 1981; Wiest and
Levy, 1977).
To better illustrate the anomalous effect of new
relationships of PDM on critical activities, consider
the simple project schedule that shows on Activity-
on-Node network in Fig.2. Each rectangle in
network represents a project activity. The
technological relationships between activities are
indicated by arrows. The project consists of 7
activities. Activities S and F are assumed to be
artificial activities indicating the project
commencement and the project completion,
respectively. The results of CPM calculation are
shown in Fig.3 as bar-chart fashion along a
horizontal time scale. The sequence of activities and
precedence arrows denoted by bold line, represent
the critical path. As shown in
Fig.3, we can identify activities 1, 4, 5, 6, and 7
as critical (zero total float). First, let us to define the
characteristics of a critical activity in traditional
CPM as: (i) any delay in the start time of a critical
activity will result in a delay in the project duration,
(ii) any change in the length of a critical activity will
result the same change in the entire project duration.
The first characteristic is true on all critical activities
in schedule network in Fig.3. The second
characteristic is still true on critical activities 1, 6,
and 7. However, this characteristic cannot be true on
critical activities 4 and 5. For example, shortening
activity 4 would have reversely effect on project
duration, meaning it will increase the project
duration. Conversely, lengthening it will decrease
Figure 2: PDM schedule network.
Day0123456789
A, 4 (0)
B, 4 (0)
C, 2 (0)
0 4
0
4
2 6
2 6
SS = 2
6 8
6 8
Name, Duration (TF)
LS LF
ES EF
Legend
CriticalActivityEffectonProjectDurationinPrecedenceDiagramMethodSchedulingNetwork
315
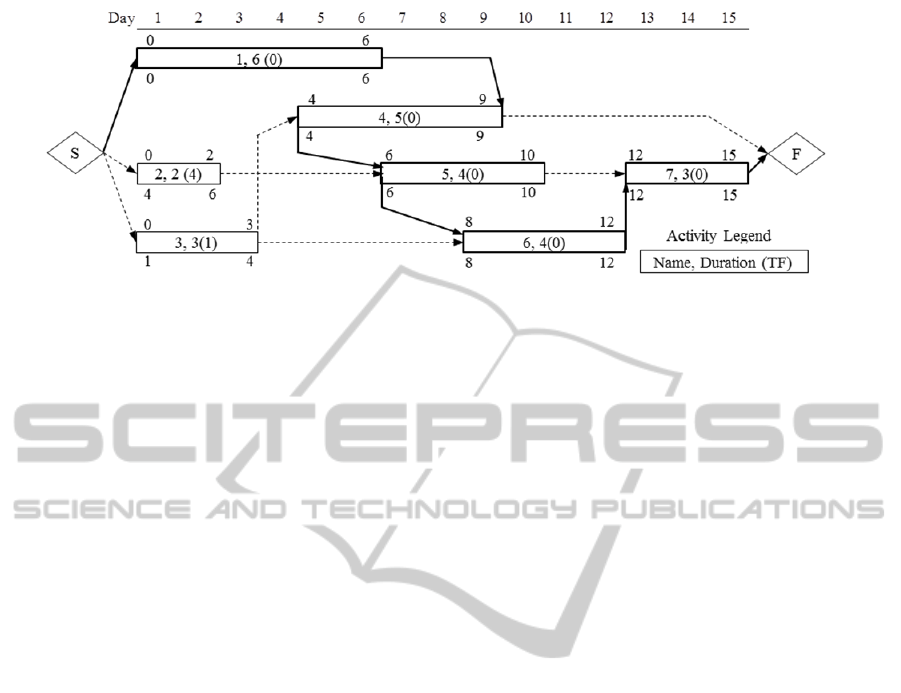
Figure 3: PDM schedule network on horizontal time scale.
the project duration. Also, shortening and
lengthening of activity 6 has no effect on project
duration. As shown in Fig.3, these anomalous affects
are indicated on critical activities that have SS
and/or FF relationships.
In this paper we provide some important
information for critical activity effect on project
duration. In addition, we determine the maximum
amount of time by which changing the duration of a
critical activity will have anomalous effect on
project duration. Therefore, the project manager will
clearly distinguish the behavior of each critical
activity on critical path, and he can change the
project duration by shortening/lengthening activities
based on project budget and project deadline.
2 PREVIOUS RESEARCHES
Some previous researchers have studied on critical
activity and critical path in PDM.
Lu and Lam (2009) proposed a “transform
schemes” in order to detect and transform the new
relationships of PDM network i.e., SS, FF, and SF,
into equivalent FS relationship by splitting activities.
However, some activity may require not to be split
during its execution. Therefore, this scheme would
not be feasible for such project with non-
interruptible activities.
Wiest (1981) descried the effects of critical
activities with SS and FF relationships. He defined
the critical path as alternating sequence of activities
and precedence arrows, starting and ending with
activities or activity extreme points. Weist (1981)
classified the critical activities as primary
classifications in PDM network as normal, reverse,
and neutral.
1) If a critical path passes through an activity
from start to finish, then the activity’s effect on the
critical path or project duration is normal. Its
lengthening will increase the critical path, and
shortening it will have the opposite effect.
2) If a critical path passes through an activity
from finish to start, then the activity’s effect on the
project duration is anomalous. Its lengthening will
shorten the critical path, and its shortening will
lengthen the path. Such critical activity is denoted as
reverse.
3) If a critical path enters and exits from the
starting point of an activity (or ending point), then
the duration of activity is independent of the length
of that critical path. The activity is called as neutral
critical.
Wiest (1981) also mentioned that when an
activity is on more than one critical path, then the
classification would depend on the combination of
paths. The combination of normal and reverse is
perverse, meaning if one critical path passes through
an activity from start to finish and another one enters
and exists from its starting point (or ending point),
then whether the activity is shortened or lengthened,
the project duration will be increased. Such activity
is called perverse critical. He also stated that the
combination of normal and neutral is normal, the
combination of neutral and reverse is reverse, and
the combination of all primary classification i.e.,
neutral, normal, and reverse, will be perverse.
However, all these statement are not true. We will
show in section 4 that the combination of normal
and neutral; and the combination of neutral and
reverse will have different effects that Wiest (1981)
have proposed.
Moder et al. (1983) proposed the same
classification to the abovementioned. But the only
different is that they divided neutral into two classes
i.e., start neutral and finish neutral, and also they
named the perverse as bicritical.
These classifications provide useful information
about the behavior of critical activities in PDM
ICORES2015-InternationalConferenceonOperationsResearchandEnterpriseSystems
316

network, when the project manager needs to change
the length of critical activities. However, further
study is needed in order to provide information in
detailed on classification of critical activity effect. In
addition, it is needed to determine how long time a
certain effect of critical activity would be available
during shortening/lengthening of such activity.
Because, after shortening/lightening of a critical
activity by a certain time unit(s), the activity’s effect
on project duration may be changed. For example, as
the previous classification, activity 5 in Fig.3 has
neutral effect, meaning its lengthening/shortening
would not change the project duration. However,
when its duration is increased by 2 days, then it will
change to normal critical, and then lengthening it
will increase the project duration.
3 NETWORK FORMULATION
AND BASIC ASSUMPTION
We consider a single project schedule which is
represented by an Activity-On-Node (AON) network
in which the activities are denoted by node (circle or
rectangle) and the predecessor relationships between
predecessor activity i and successor j is shown by an
arrow connecting the two nodes. There may exist
four types of relationships i.e., SF
ij
, SS
ij
, FF
ij
, and
FS
ij
, with minimum lag time l
ij
between activities i
and j. Each activity is non-preemptive or cannot split
during its execution. It is assumed that the resource
requirement for each activity is unlimited. The start
time of the project is considered as unit time 0. For
each activity, the duration and precedence relations
are assumed to be deterministic and known in
advance.
To avoid having more start activities in the
network, an artificial activity with zero duration is
used as start activity. If the start of an activity has no
predecessor activity, then the start activity is
nominated as its direct predecessor with FS
relationship. An artificial activity is used as finish
activity. This also helps to have only one finish
activity. If the finish of an activity has no successor
activity, then the finish activity is used as its direct
successor.
4 CLASSIFICATIONS OF
CRITICAL ACTIVITIES
Based on the location of critical activities in the
schedule, we classify their effects in two groups i.e.,
activity on single critical path and activity on multi-
critical path. If the critical activity is located on
single path, it is called as primary classification by
Wiest (1981). But, if it is located on multi-path, then
its effect will determine as their combination. The
critical path in PDM may define as: the alternating
sequence of activities and precedence arrows,
starting and finishing with activities or activity
extreme points. All the precedence arrows always
move forward, and hence an increase in the length
(lag time) of a critical precedence arrow will
lengthen the project duration. The classifications are
described in detailed and depicted in figures as
follows. Note that each arrow in the figures
represents the critical path direction.
4.1 Critical Activity on Single Path
If a critical activity is located on a single path, then
it would classify as primary in 3 classes. The other
classification will be provided by combination of
these 3 primary classes. In this paper we accept the
proposed primary classification by Wiest (1981).
1) Normal (N): denotes an activity that
lengthening it will lengthen the project duration and
shortening it will increase the project duration. Fig.4
show a normal critical activity that critical path ab
passed through the activity from start to finish.
Figure 4: Normal critical activity.
2) Reverse (R): denotes an activity that
lengthening it will shorten the project duration and
shortening it will decrease the project duration. Fig.5
depicts the reverse critical activity in which a single
critical path of ab passed through the activity from
finish to start.
Figure 5: Reverse critical activity.
3) Neutral (U): denotes an activity that its length
is independent of the project duration. There are two
types of neutral critical activities. (a) Start-neutral
(SU): if a critical path enters and exits from the
starting point of an activity, then the activity is
called start-neutral critical. (b) Finish-neutral (FU):
if a critical path enters and exits from the ending
point of an activity, then the activity is called finish-
CriticalActivityEffectonProjectDurationinPrecedenceDiagramMethodSchedulingNetwork
317

neutral critical. Fig.6 shows the start-neutral and
finish-neutral critical activities.
(a) (b)
Figure 6: (a) start-neutral critical activity,
(b) finish-neutral critical activity.
4.2 Critical Activity on Multi-Path
If multi-path passes through a critical activity, then
the effect of activity on project duration would be
depended on the type of combination of paths.
Although, Wiest (1981) have stated the effect of
critical activity when it is located on more than one
critical path, all the statement is not true. For
example, as Wiest (1981) have mentioned that the
combination of neutral and reverse will result
reverse. However, in following we will show that it
would have different result.
1) Perverse (P): denotes an activity which is
provided by combination of reverse and normal
critical paths. Whether the duration of a perverse
critical activity is shortened or lengthened, the
project duration will be increased. Fig.7 depicts a
perverse critical activity in which the critical path ab
(reverse path) enters and exits from finish to start of
activity A, while the critical path cd (normal path)
enters and exits from start to finish of the activity.
Shortening the activity A in Fig.7 will decrease the
path cd, but increase the path ab. And lengthening it
will decrease the path ab, but increase the path cd.
Therefore, whether activity A is shortened or
lengthened, at least one path will increase, and hence
the project duration will also increase.
Figure 7: Perverse critical activity.
2) Decrease-reverse (DR): the combination of
neutral (start-neutral or finish-neutral) and reverse
will result decrease-reverse effect on project
duration. Shortening a decrease-reverse activity will
increase the project duration, but lengthening it will
have no effect on project duration. For example,
shortening activity A in Fig.8 will increase the path
ab, but have no effect on path cb. Then, the project
duration will increase because the path ab which
would be the longest path, will determine the project
duration. Lengthening this activity will decrease the
path ab, but have no effect on path cb. So, the
project duration will not be changed. Because path
cb would be the longest path and it will determine
the project duration.
(a) (b)
Figure 8: (a) start-decrease-reverse critical activity,
(b) finish-decrease-reverse critical activity.
3) Increase-normal (IN): the combination of
neutral (start-neutral or finish-neutral) and normal
will result increase-normal effect on project
duration. Lengthening an increase-normal activity
will increase the project duration, but shortening it
will have no effect on project duration. For example,
lengthening activity A in Fig.9 will increase the path
ac, but have no effect on path ab. Then, the project
duration will increase. Shortening the activity will
decrease the path ac, but have no effect on path ab.
Therefore, the project duration will not be changed.
Figure 9: Increase-normal critical activities.
5 DETERMINING FLOAT FOR
CRITICAL ACTIVITY
5.1 Float for Non-Critical Activity
Before identifying float for critical activity in PDM,
it is needed to have an observation on traditional
definition of float. An activity with positive float is
called as non-critical activity. A non-critical activity
may have several types of floats i.e., total float (TF),
free float (FF), and independent float (IF). Each type
of float gives us important information about the
characteristic and the flexibility of activity. TF is the
maximum amount of time an activity can be delayed
from its early start without delaying the entire
project. FF is defined as the maximum amount of
time an activity can be delayed without delaying the
ICORES2015-InternationalConferenceonOperationsResearchandEnterpriseSystems
318

early start of the succeeding activities. FF is the part
of TF, hence it is always true that TF ≥ FF.
Independent float is the maximum amount of time
an activity can be delayed without delaying the early
start of the succeeding activities and without being
affected by the allowable delay of the preceding
activities (Mubarak, 2008).
So far, all floats are associated with non-critical
activity. In this study we introduce some new types
of float associated with critical activity. These float
would concretely define the characteristic of a
critical activity in PDM network.
5.2 Float for Critical Activity
An activity with zero TF is denoted as critical
activity. Obviously if TF of an activity is zero, then
its FF and IF will be also zero. Because FF and IF
are the parts of TF (Moder et al., 1983). However, a
critical activity in PDM may have several type of
floats other than TF, FF, and IF.
1. Reverse float (RF): it is the maximum amount
of time associated with a reverse critical activity that
when the length of activity is extended, then critical
path will be decreased. After consuming the entire
reverse float, the activity effect will be changed to
decrease-critical. For example, lengthening activity
4 (which is a reverse critical activity) in Fig.3 by 1
day will shorten the project duration from 15 to 14
days. Afterward lengthening it would have no
anymore effect on project duration, and it would be
changed to decrease reverse activity. Therefore, this
activity has 1 day reverse float. The reverse float is
calculated from following equation.
,∀
,∀
,∀
,∀
1
where, R is the reverse critical activity, RF
R
is
reverse float of activity R, i is the predecessor
activity, and j is the successor activity.
2. Neutral float (UF): it is the maximum amount
of time associated with neutral critical activity by
which the length of activity can be extended without
affecting the duration of critical path. After use of all
neutral float, the activity effect will be changed to
normal critical. For example, activity 5 in Fig.3 is
neutral critical so that lengthening it by 2 days will
have no effect on project duration. But, lengthening
it by more than 2 days will increase the project
duration. Thus, activity 6 has 2 days of UF. The UF
is calculated from equations 2 and 3.
For start-neutral critical activity:
,∀
,∀
2
For finish-neutral critical activity:
,∀
,∀
3
where, U is the neutral critical activity and UF
U
is neutral float of activity U.
3. Decrease-reverse float (DF): it is the
maximum amount of time associated with decrease-
reverse critical activity by which lengthening the
activity would not effect on project duration. After
consumption of DF, the activity effect will be
changed to perverse critical. For example, let us
consider on the simple schedule network in Fig.10 in
which the activity 3 is a decrease-reverse critical.
When the duration of activity 3 is lengthened by 2
days, it would have no effect on project duration.
But, if it is lengthened by 3 days (or more than 2
days), then the project duration will be increased.
Thus, activity 3 in Fig.10 has 2 days DF. The DF is
calculated from equations 4 and 5.
For start-decrease-reverse critical activity:
,∀
,∀
4
For finish-decrease-reverse critical activity:
,∀
,∀
5
where, D is the decrease-reverse critical activity
and DF
D
is decrease-reverse float of activity D.
Figure 10: Activity 3 has 2 days DF.
6 CASE STUDY
To better illustrate the critical activity classification
and identifying the proposed floats for each class,
we use a slightly more complicate example which is
taken from text of Wiest and Levy [4]. It is assumed
CriticalActivityEffectonProjectDurationinPrecedenceDiagramMethodSchedulingNetwork
319

that there is the construction of a large condominium
project, in which a number of essentially identical
housing units are built sequentially. The example
follows three units only and is concerned with just
the laying of cement slabs. Performing laying of
cement slab for each unit is broken down into 5
activities as follows.
1) Clear lot and grade 8 hours
2) Place concrete forms 12 hours
3) Lay sewer lines 16 hours
4) Install reinforcement steel 9 hours
5) Pour concrete and smooth 4 hours
Total number of activity that must be performed
for 3 units is 15 activities. These activities are
numbered sequentially, unit by unit as: activities 1
through 5 refer to unit 1, activities 6 through 10 refer
to unit 2, and activity 11 through 15 refer to unit 3.
For example, activity 2 is “Place concrete forms,
unit 2” and activity 14 is “Install reinforcement steel,
unit 3.” The example data with proper precedence
relationships are shown in Table 1. Fig.11 represents
the schedule network which is drawn on Activity-
On-Node fashion, with precedence arrows
connecting the activities at the appropriate ends
(start or finish). The time lag factor (l
ij
) is inside the
box attached to arrows. Using the forward and
backward calculations of PDM algorithm, as shown
in Table 2, we calculated the ES, EF, LS, LF, TF,
Table 1: Activity information for laying cement slabs.
and the project duration. The project duration is 56
working hours. We can observe the critical activities
(activity with zero TF) in Table 2 as activities 1, 2,
3, 7, 8, 12, 13, 14, and 15. These activities are
denoted by bold numbers in Table 2. Also, we
identified 3 following critical paths in Fig.11: (1) the
sequences activities of 1, 3, 8, 13, 12, 14, and 15
connecting by precedence relationships of FS
1,3
,
SS
3,8
, SS
8,13
, FF
13,12
, SS
12,14
, FS
14,15
; (2) the sequences
activities of 1, 3, 2, 7, 12, 14, and 15 connecting by
precedence relationships of FS
1,3
, FF
3,2
, SS
2,7
, SS
7,12
,
SS
12,14
, FS
14,15
; and (3) the sequences activities of 1,
3, 8, 7, 12, 14, and 15 connecting by precedence
relationships of FS
1,3
, SS
3,8
, FF
8,7
, SS
7,12
, SS
12,14
,
FS
14,15
. The duration of critical path in PDM will be
calculated from following equation.
∑
∑
∑
(6)
where, d
Pi
is the duration of path, d
Ni
the duration
of normal activity, l
ij
is the duration lag factor, and
d
Ri
is the duration of reverse activity.
For example, the duration of critical path 1 is
calculated as:
∑
37
∑
,
,
,
,
,
31
∑
12
37311256
Table 2: Schedule result of laying cement slabs.
An observation should be noted about activity 12
in Fig.11. The activity 12 has reverse effect on
critical path 1, and it has neutral effect on critical
paths 2 and 3. However, it would have decrease-
reverse effect on project duration.
Activity Description Duration Precedence
1
Clear & Grade 1
8
2
Con. Fo rms 1
12
1 FS, 3 FF=2
3
Sewe Lines 1
16
1 FS
4
Reinforcement 1
9
2 FF=1 & SS=7, 3 SS=7
5
Pour Concrete 1
4
4 FS=2
6
Clear & Grade 2
8
1 FS
7
Con. Fo rms 2
12
2 SS=10, 6 FS, 8 FF &
SS=7
8
Sewe Lines 2
16
3 SS=10, 6 FS
9
Reinforcement 2
9
4 FS, 7 SS=7 & FF=1, 8
SS=7 & FF
10
Pour Concrete 2
4
5 SS=2, 9 FS=2
11
Clear & Grade 3
8
6 FS
12
Con. Fo rms 3
12
7 SS=10, 11 FS, 13
FF=2
13
Sewe Lines 3
16
8 SS=10, 11 FS
14
Reinforcement 3
9
9 FS, 12 SS=7 & FF=1,
13 SS=7 & FF
15
Pour Concrete 3
4
10 SS=2, 14 FS=2
Act. ES EF LS LF TF RF UF DF Class
1
08080––– N
2
14 26 14 26 0 3 – – R
3
8248240–––IN
4213023322–––
53236444812 – – –
681610182–––
7
24 36 24 36 0 – – 3 DR
8
183418340–––IN
9314032411–––
10424650548–––
11162420284–––
12
34 46 34 46 0 – – 3 DR
13
284428440––– N
14
415041500––– N
15
525652560––– N
ICORES2015-InternationalConferenceonOperationsResearchandEnterpriseSystems
320
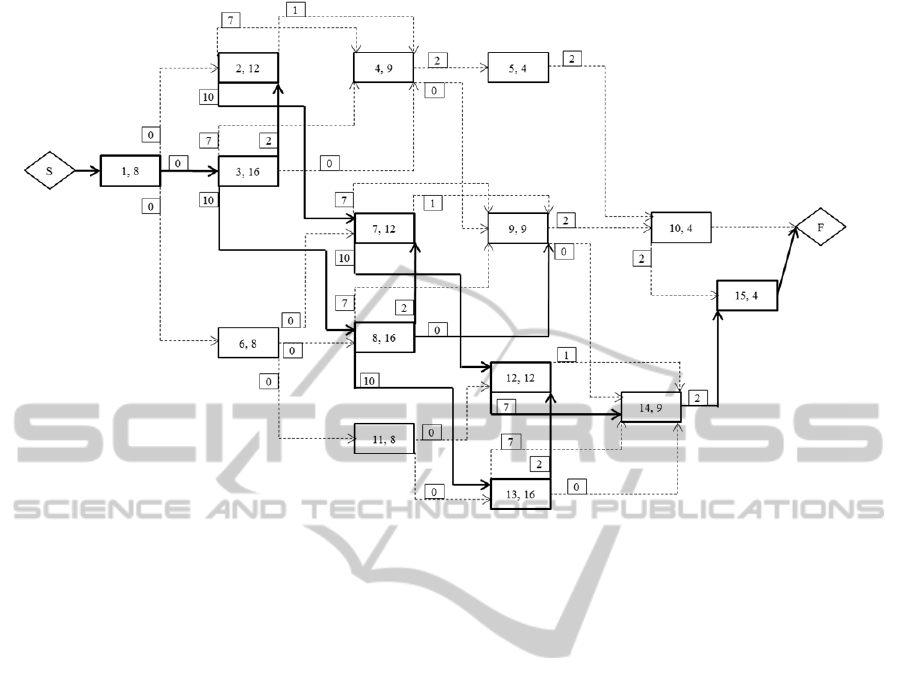
Figure 11: PDM schedule network of laying cement slabs.
As shown in Fig.11, the critical paths (the
sequences of critical activities and critical
precedence arrows) are highlighted by bold line. We
classify the critical activity effect as follows:
activities 1, 13, and 15 are normal (N); activity 2 is
reverse (R); activity 14 is start-neutral (SU); activity
7 is decrease-reverse (DR); and activities 3, 8, and
12 are increase-normal (IN). Using the proposed
equations (1) to (5) described earlier, we provided
floats for critical activities i.e., RF, NF, and DF, in
columns 7 to 9 of Table 2.
7 CONCLUSION AND FUTURE
RESEARCH
Traditional Critical Path Method (CPM) scheduling
technique is essentially limited to finish-to-start (FS)
relationships between activities, i.e., the successor
activity cannot start until the predecessor activity is
completed. Therefore, it could not allow overlapping
unless activities were further divided. Precedence
Diagram Method (PDM), which was developed
based on the concept of CPM analysis, introduced
three alternative relationships, i.e., start-to-start (SS),
finish-to-finish (FF), and start-to-finish; and lag
factor between various activities. The PDM provides
a more flexible realistic project representation in
schedule networks and more accurately reflects the
sequence of construction operations as they occur in
real life. There are various computer software
packages available such as Primavera P6 and MS
Project, which provide the PDM schedule network.
However, the new relationships of PDM can change
some of the basic concept of critical activities and
critical path. According basic definition of critical
activity in CPM, the shortening/lengthening of a
critical activity on critical path always results in
decreased/increased project duration. But, this
definition does not always apply on PDM. Changing
the duration of some critical activity in PDM can
have anomalous effects.
Previous researchers have studied on critical
activity and critical path, and they have proposed
classification of critical activity. However, these
classifications were not completed and could not
indicate all the critical activity’s characteristics. In
this paper we did further research on classification
of critical activity effects which are proposed by
previous researchers, and introduced new floats for
each class of critical activities in PDM schedule.
Thus, project managers will clearly distinguish the
behavior of each critical activity on critical path, and
they can change the project duration by
shortening/lengthening activities based on the
project budget and the project deadline.
However, in this study we assumed that the
available resource requirement for activities is
unlimited. This assumption is not valid in most
CriticalActivityEffectonProjectDurationinPrecedenceDiagramMethodSchedulingNetwork
321

practical applications, wherein exist definite limits
on the amount of available resources. Therefore,
further research is needed to evaluate the effect of
critical activity on project duration in PDM network
while considering resource limitation.
REFERENCES
Ahuja, H. N., 1994. Project Management-Techniques in
Planning and Controlling Construction Project, 2nd
ed., John Wiley & Sons, New York.
Fondahl, J. W., 1961. A non-computer approach to the
critical path method for the construction industry, J.
Constr. Eng. Manage., vol. 132 no. 7, pp. 697-711.
Wiest, J. D., 1981. Precedence diagramming method:
Some unusual characteristics and their implications for
project managers, J. of Operations Manage., vol. 1,
no. 3, pp. 121–130, Feb.
Wiest, D. J., Levy K. F., 1977. A Management Guide to
PERT/CPM with GERT/DCPM and other Networks,
2nd ed., Prentice-Hall, Inc., USA.
Lu, M., Lam, H. C., 2009. Transform Schemes Applied on
Non-Finish-to-Start Logical Relationships in Project
Network Diagrams,” J. Constr. Eng. Manage., vol.
135, no. 9, pp. 863-873, Sep.
Moder, J.J., Phillips, C.R., David, E. W., 1983. Project
Management with CPM, PERT and Precedence
Diagramming, 3th ed., Van Nostrand Reinhold, USA.
Mubarak, S., 2008. Construction project Scheduling and
Control, 2nd ed., John Wiley & Sons, Canada.
ICORES2015-InternationalConferenceonOperationsResearchandEnterpriseSystems
322
