
A Novel Technique of Feature Extraction Based on Local and Global
Similarity Measure for Protein Classification
Neha Bharill and Aruna Tiwari
Department of Computer Science and Engineering, Indian Institute of Technology, PACL Campus, Indore, India
Keywords:
Bioinformatics, Probability-based Features, Position-specific Information, Binary Feed Forward Neural
Network, Protein Classification.
Abstract:
The paper aims to propose a novel approach for extracting features from protein sequences. This approach ex-
tracts only 6 features for each protein sequence which are computed by globally considering the probabilities
of occurrences of the amino acids in different position of the sequences within the superfamily which locally
belongs to the six exchange groups. Then, these features are used as an input for Neural Network learning
algorithm named as Boolean-Like Training Algorithm (BLTA). The BLTA classifier is used to classify the
protein sequences obtained from the Protein Information Resource (PIR). To investigate the efficacy of pro-
posed feature extraction approach, the experimentation is performed on two superfamilies, namely Ras and
Globin. Across tenfold cross validation, the highest Classification Accuracy achieved by proposed approach is
94.32±3.52 with Computational Time 6.54±0.10 (s) is remarkably better in comparison to the Classification
Accuracies achieved by other approaches. The experimental results demonstrate that the proposed approach
extracts the minimum number of features for each protein sequence. Therefore, it results in considerably
potential improvement in Classification Accuracy and takes less Computational Time for protein sequence
classification in comparison with other well-known feature extraction approaches.
1 INTRODUCTION
In the recent years, Bioinformatics (Iqbal et al., 2014)
is emerged as a forefront research area. It is referred
as conceptualization of biology in terms of macro-
molecules. Due to dramatic evolution of technol-
ogy and continuous effort of Genome Project, a large
amount of protein, DNA and RNA sequences are gen-
erated on regular basis. In this regard, many tech-
niques have been proposed by the researcher to an-
alyze and interpret the DNA, RNA and protein se-
quences. Among these, protein sequence classifica-
tion (Vipsita and Rath, 2013) is an important problem,
which determines the superfamily of an unknown
protein sequence. The major advantage of category
grouping is that molecular analysis is performed glob-
ally within a superfamily instead of local analysis.
A protein sequence contains the characters from 20
different amino acid alphabets that can occur in any
order. The problem of protein classification are for-
mally stated in (Wang et al., 2001). Given a unlabeled
protein sequence S and a set of known superfami-
lies F={F
1
,F
2
,...,F
f
}, the problem is to determine
with certain degree of accuracy whether the protein
sequence S belongs to one of superfamilies from set
F
i
, i = 1,..., f . Therefore, classification of unknown
protein sequences into one of known superfamilies is
an important task. This will help in identifying the
structure and function of unknown protein sequences.
It also results in saving the large expenses incurred
in performing the experiments in laboratory. One of
the most important practical applications is in drug
discovery. For example, suppose a sequence S is ob-
tained from disease D and it is inferred by classifi-
cation method that sequence S belongs to the super-
family F
i
. So, to treat the disease D one can use the
combination of existing drugs of superfamily F
i
.
In past, many feature extraction approaches (Ver-
gara and Est
´
evez, 2014) have been proposed by the re-
searchers to deal with the protein sequence classifica-
tion problem. The n-gram encoding schemes (Wang
et al., 2001), (Solovyov and Lipkin, 2013) for extract-
ing features from protein sequence used the local and
global similarities by counting the occurrences of two
amino acids within a protein sequence. Further, the
extracted features are used as an input to Bayesian
Neural Network classifier. Although, the n-gram en-
coding scheme works reasonably well. But its major
219
Bharill N. and Tiwari A..
A Novel Technique of Feature Extraction Based on Local and Global Similarity Measure for Protein Classification.
DOI: 10.5220/0005283702190224
In Proceedings of the International Conference on Bioinformatics Models, Methods and Algorithms (BIOINFORMATICS-2015), pages 219-224
ISBN: 978-989-758-070-3
Copyright
c
2015 SCITEPRESS (Science and Technology Publications, Lda.)
drawback is that it fails to consider the positional sig-
nificance of the residue pairs which is an important
consideration in superfamily classification. In addi-
tion to it, the number of features extracted by this
approach is extremely large (≥ 62). This imposes a
major limitation on many classification approaches.
Also, these algorithms works on large number of fea-
tures therefore they have high-computational com-
plexity. In 2005, Bandyopadhyay proposed another
feature extraction approach that overcomes some of
the limitations of (Wang et al., 2001). This approach
limit the number of features and correspondingly it
extracts 20 features for each protein sequence. Once
the features are extracted, they are used as an input
to fuzzy genetic clustering strategy to evolve a set of
prototypes for each superfamily. Finally, it uses the
nearest neighbour (NN) rule to classify a set of un-
known sequences into a particular superfamily. But,
this approach only considers the global positional in-
formation corresponding to each amino acid. Thus, it
fails to consider the local positioning of each amino
acid in the respective sequence. Another approach
proposed by (Mansouri et al., 2008) which extract
only relevant features from the protein sequences by
counting the occurrence probability of six exchange
groups in each sequence. Then, it uses these extracted
features as an input for generating some of the in-
terpretable fuzzy rules which is used to assign pro-
tein sequences into appropriate superfamily. This ap-
proach suffers from a major drawback that the fea-
tures extracted by this approach only considers the lo-
cal positioning of each sequence within an exchange
group. It fails to consider the global probability of
occurrence of each amino acid in entire superfamily.
Hence, the above discussed classifiers do not capture
both the global and local similarity. Thus, the relevant
features are not extracted due to which it results in
degradation of classification accuracy and have high-
computational time.
In this paper, the proposed new feature extrac-
tion approach overcomes the limitations of existing
feature extraction approaches. It capture both the
global and local similarity of each protein sequence
for extracting features and only 6 relevant features
corresponding to each protein sequence are extracted.
Firstly, it computes the global probability of each
amino acid present within a sequence by counting the
positional information of amino acid in all the se-
quences. Then, the local similarities are determined
based on the concept of weighting scheme (Karchin
and Hughey, 1998). Further, the computed weights of
each amino acid within a sequence is encoded to their
respective six exchange groups where the exchange
groups are effective equivalence classes of amino
acids derived from PAM (Dayhoff and Schwartz,
1978). Once, the features are extracted then these fea-
tures are fed as an input to the Boolean-Like Training
Algorithm (BLTA) (Gray and Michel, 1992) to per-
form the classification of unknown sequences into the
superfamilies. To validate the efficacy of proposed
feature extraction approach, the comparison is done
by implementing other feature extraction approaches
and evaluating their performance on BLTA classifier.
The observation can be drawn from the experimental
results that the proposed approach limit the number of
features extracted corresponding to each protein se-
quence by capturing both local and global similarity
measure thus, leads to the lesser Computational Time
and higher Classification Accuracy.
The rest of the paper is organized as follows. The
description of proposed model is illustrated in Sec-
tion 2. In Section 3, the experimental results are re-
ported. Finally, Section 4 concludes this paper.
2 PROPOSED FEATURE
EXTRACTION APPROACH
Protein sequence contains characters from
the amino acid that can be viewed as a text
strings which is formally represented by a set
A={A,C,D, E,F, G, H,I,K,L,M,N, P,Q,R,S, T,V,W
,Y }. The protein sequence can be of any length and
contains the combination of these amino acids in any
order. Therefore, the most important issue in applying
any algorithm for the protein sequence classification
is encoding of these protein sequences in terms
of feature vectors and then applying these feature
vectors as an input to any learning algorithm for
classification. For proper classification of sequences
into superfamilies a relevant input representation
is needed. Thus, the success of learning algorithm
depends on the kind of input data available. The
proposed new feature extraction approach extracts
only 6 relevant features corresponding to each protein
sequence by capturing both the global and local
similarity of protein sequences. Next, section is
presented with the proposed method for computing
the global similarity corresponding to all the protein
sequences belongs to the superfamily. Section 2.2,
describe the proposed local similarity measure which
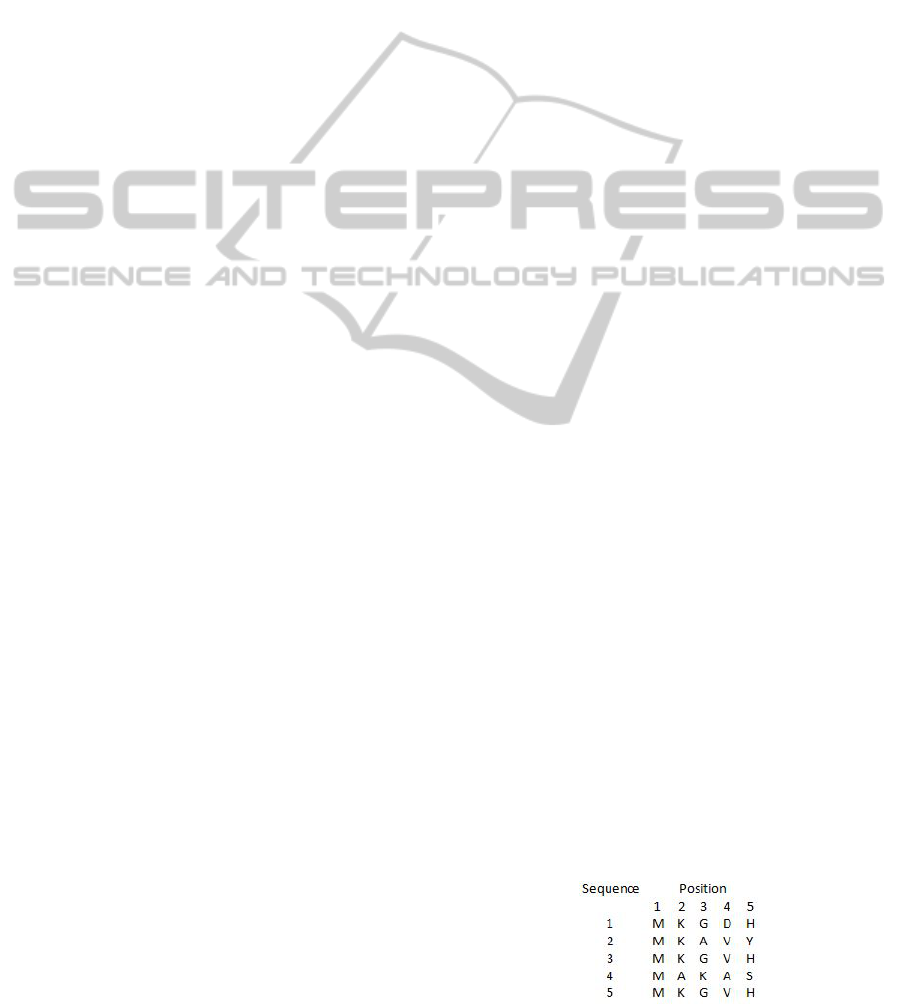
Figure 1: Primary Structure of Five Related Proteins.
BIOINFORMATICS2015-InternationalConferenceonBioinformaticsModels,MethodsandAlgorithms
220
incorporate the global similarity measure computed
for all the protein sequences. Finally, in Section 2.3,
the proposed encoding method is presented which
evaluate the feature vector once the global and local
similarity measures for all the protein sequence is
determined.
2.1 Global Similarity Measure for
Feature Extraction
Given, a set S consist of all the sequences of a pro-
tein superfamily F
i
, i = 1,..., f which is formally
represented as S ={s
1
,s
2
,....,s
n
} where n represent
the number of sequences. The protein sequences
which belong to the same superfamily share the
structural similarities with each other as shown in
Fig. 1. All the sequences present in Fig. 1 are un-
aligned and taken from same superfamily and con-
sist of total 9 amino acids represented by a set
A={A,D,G,H,K,M, S,V,Y }. These unaligned se-
quences are aligned using BioEdit tool. The global
similarity measure is determined by calculating the
probability of occurrence of each amino acid in a par-
ticular position with respect to the total number of se-
quences present in the superfamily. It is mathemati-
cally represented by
(Probability)
i j
= (Occurence)
i j
/n (1)
where (Probability)
i j
represent the probability of
occurrence of i
th
amino acid at j
th
position,
(Occurence)
i j
denote the frequency of i
th
amino acid
at j
th
position and n represent the total number of se-
quences in a particular superfamily. For example, as
shown in Fig. 1, the amino acid G occurs in the third
position three times out of five sequences, therefore
probability of occurrence of G is (Probability)
i j
=
3
5
.
Thus in the same way, the global similarity measure
for all the sequences shown in Fig. 1 is computed and
presented in Table 1. Once the global similarity mea-
sure is evaluated, the position specific weight of each
amino acid is calculated. This is discussed in the sub-
sequent section.
Table 1: Global Similarity Measure of Protein Sequences
present in Fig. 1.
Amino acids Position1 Position2 Position3 Position4 Position5
A 0 0.2 0.2 0.2 0
D 0 0 0 0.2 0
G 0 0 0.6 0 0
H 0 0 0 0 0.6
K 0 0.8 0.2 0 0
M 1 0 0 0 0
S 0 0 0 0 0.2
V 0 0 0 0.6 0
Y 0 0 0 0 0.2
Table 2: Feature Vector of Each Sequence Present in Fig. 1.
Sequence e
1
e
2
e
3
e
4
e
5
e
6
1 1.4 0.2 0 0.6 1 0
2 0.8 0 0 0.2 1.6 0.2
3 1.4 0 0 0.6 1.6 0
4 0.2 0 0 0.6 1 0
5 1.4 0 0 0.6 1.6 0
2.2 Local Similarity Measure for
Feature Extraction
Given a protein sequence, the weight of each amino
is evaluated by adding all the position specific occur-
rences of amino acid at that place and the respective
probability of occurrence of amino acid in that place
from the entire super family. It is mathematically rep-
resented as:
Weight(i) = (PSO)
i
× (Probability)
i j
(2)
where Weight(i) denote the weight of i
th
amino acid,
(PSO)
i
represent the position specific occurrence of
i
th
amino acid and (Probability)
i j
represent the prob-
ability of occurrence of i
th
amino acid at j
th
position.
For example, in Fig. 1 corresponding to the sequence1
i.e. MKGDH, the weight of each amino acid is calcu-
lated as follows:
Weight(M)=1×1.0=1.0, Weight(K)=1×0.8=0.8
Weight(G)=1×0.6=0.6, Weight(D)=1×0.2=0.2
Weight(H)=1×0.6=0.6
The weights of all other amino acids present in Fig. 1
with respect to the sequence1 is zero. This is be-
cause these amino acids are not present in sequence1.
Hence, for all other remaining sequences the weight
of each amino acid present within the sequence are
calculated in the similar manner.
Therefore, for sequence2 i.e. MKAVY, the weight
of each amino acid is evaluated as follows.
Weight(M)=1×1.0=1.0, Weight(K)=1×0.8=0.8
Weight(A)=1×0.2=0.2, Weight(V)=1×0.6=0.6
Weight(Y)=1×0.2=0.2
Similarly, for sequence3 i.e. MKGVH, the weight
of each amino acid is evaluated as follows.
Weight(M)=1×1.0=1.0, Weight(K)=1×0.8=0.8
Weight(G)=1×0.6=0.6, Weight(V)=1×0.6=0.6
Weight(H)=1×0.6=0.6
For sequence4 i.e. MAKAS, the weight calcula-
tion of each amino acid is presented as follows.
Weight(M)=1×1.0=1.0, Weight(K)=1×0.2=0.2
Weight(S)=1×0.2=0.2,Weight(A)=1×0.2+1×0.2=0.4
For sequence5 i.e. MKGVH, the weight calcula-
tion of each amino acid is presented as follows.
Weight(M)=1×1.0=1.0, Weight(K)=1×0.8=0.8
Weight(G)=1×0.6=0.6, Weight(V)=1×0.6=0.6
Weight(H)=1×0.6=0.6
ANovelTechniqueofFeatureExtractionBasedonLocalandGlobalSimilarityMeasureforProteinClassification
221

Furthermore, these amino acids within the se-
quence share some structural similarity with each
other. Thus, encoding of these amino acids present
within the sequence is another important issue in or-
der to represent these amino acids as a feature vector.
Therefore, encoding method is presented in the sub-
sequent section.
2.3 Encoding of Protein Sequences
According to PAM (Dayhoff and Schwartz, 1978),
the amino acids belong to the six exchange groups.
This is because these amino acids within the
group exhibits high evolutionary similarity. The
Six-letter exchange groups are formally repre-
sented as: e
1
={H,R,K}, e
2
={D,E, N, Q}, e
3
={C},
e
4
={S,T,P,A,G}, e
5
={M,I,L,V } and e
6
={F,Y,W }.
For a given protein sequence1 MKGDH present in
Fig. 1, the amino acids M∈ e
5
, K∈ e
1
, G∈ e
4
, D∈ e
2
,
H∈ e
1
. The encoding of these amino acids is done by
finding the belongingness of each amino acid to the
specific group and assign the addition of weight val-
ues of amino acids to the specific group. The weight
value of amino acid M i.e. 1 is assign to the exchange
group e
5
, the amino acid K and H both belongs to the
exchange group e
1
, so the addition of their weight
values i.e. Weight(K) +Weight(H) = 0.8 + 0.6 = 1.4
is assign as an overall weight to the exchange group
e
1
. Similarly, the amino acids G and D belongs to
the exchange group e
4
and e
2
, so the weight values
of G i.e. 0.6 and D i.e. 0.2 is assign to the exchange
groups e
4
and e
2
. Thus, one can observe that none
of the amino acid from sequence1 belongs to the
exchange e
3
and e
6
so the weight values assign to
the exchange groups e
3
and e
6
is 0. Hence for se-
quence1 MKGDH, the feature vectors is obtained as
{(e
1
,1.4),(e
2
,0.2),(e
3
,0),(e
4
,0.6),(e
5
,1),(e
6
,0)}.
The feature vectors for remaining sequences shown
in Fig. 1 are determined in the similar manner and
presented in Table 2. The feature vectors generated
using the proposed method consider both the local
and global similarity and thus extract only 6 relevant
features corresponding to each protein sequence.
Therefore, it works effectively with any classification
algorithm when applied with protein sequence data.
3 EXPERIMENTAL RESULTS
AND DISCUSSION
In this section, the experimentation is carried out to
investigate the performance of the proposed approach
on BLTA classifier (Gray and Michel, 1992). All
Table 3: Data used in the experiments.
Name of Number of Minimum length Maximum length
superfamilies sequences of sequence of sequence
RAS 500 171 296
Globin 500 128 339
codes are written in the MATLAB computing envi-
ronment and tested on Intel(R) Xeon(R) E5 − 1607
Workstation PC. The data used for the experimen-
tal purpose are obtained from the International Pro-
tein Sequence Database (Barker et al., 2004), release
2012, in the Protein Information Resource (PIR). Ta-
ble 3, illustrate the information of the two superfam-
ilies used in the experimentation. In all the experi-
ments, the 10-fold cross validation test is performed
and corresponding results are reported subsequently.
3.1 Parameter Specification
The proposed feature extraction approach is com-
pared with (Mansouri et al., 2008), (Bandyopadhyay,
2005), (Wang et al., 2001) using four parameters
i.e. Mean (M), Standard Deviation (SD), Classifica-
tion Accuracy (CA) and Total Computational Time
(TCT). These four parameters are computed by each
approach only after the features are extracted corre-
sponding to all protein sequences and classification is
performed with BLTA classifier.
The Mean (M) is defined as follows
M =
CCS
n
(3)
where CCS is the number of correctly classified se-
quences, n is the total number of sequences. The
mean determines the number of protein sequences are
correctly classified by each approach from the total
number of sequences.
The Standard Deviation (SD) is defined as
SD =
h
1
n − 1
n
∑
i=1
(P
i
− M)
2
i
1
2
(4)
where P
i
denote the i
th
protein sequence. The SD is
computed corresponding to each approach, it evalu-
ates the overall variation occur in the mean across ten
fold validation.
The total Classification Accuracy (CA) is defined as
CA = (M ±SD) × 100 (5)
The CA is computed for each approach which deter-
mines the total classification accuracy by considering
the overall variation in mean and standard deviation
across ten fold cross validation.
The Total Computational Time (TCT) is defined as
TCT = FET +CT (6)
BIOINFORMATICS2015-InternationalConferenceonBioinformaticsModels,MethodsandAlgorithms
222

Table 4: The Number of Features Extracted and the Neurons Required by all the Approaches in Each Layer.
Approaches Consideration Number of Number of Inputs Number of neurons
of Methods features extracted in Input Layer
Hidden Inhibition Output
Layer Layer Layer
Proposed approach Global and Local Similarity 6 18 500 500 2
Mansoori Local Similarity 6 18 500 500 2
Bandyopadhyay Global Similarity 20 60 500 500 2
Wang Global and Local Similarity 400 1200 500 500 2
where FET is the total feature extraction time, CT de-
notes the classification time. The TCT is a sum of
time required in extracting the feature by a particu-
lar approach including the time required in classifying
protein sequences to the superfamilies.
3.2 Performance Comparison with
Other Approaches
The number of features extracted and the neurons
required by all the approaches while evaluating the
performance on BLTA classifier are summarized in
Table 4. It can be observed from the table that,
the number of features extracted by the proposed
approach is similar to the number of features ex-
tracted by (Mansouri et al., 2008). But, the proposed
approach consider both the local and global simi-
larity measure whereas the (Mansouri et al., 2008)
only considers the local similarity measure to com-
pute the features corresponding to each sequence be-
longs to their respective superfamily. On the contrary,
the other approaches developed by (Bandyopadhyay,
2005), (Wang et al., 2001) extract 20 and 400 fea-
tures corresponding to each sequence and thus, it re-
sults in extraction of many irrelevant features for the
classification of unknown protein sequence.To judge
the effectiveness of proposed approach, exhaustive re-
sults across ten fold cross validation along with the
performance comparison with three different exist-
ing feature extraction approaches (Mansouri et al.,
2008), (Bandyopadhyay, 2005), (Wang et al., 2001)
on BLTA classifier by varying m-circle values is re-
ported in Table 5. Furthermore, of proposed ap-
proach . The four parameters i.e. Mean, Standard
Deviation, Classification Accuracy and the Compu-
tational Time (seconds) corresponding to all the ap-
proaches is calculated by varying m-circle values of
BLTA classifier. It is found that on protein data
Table 5: Comparison of Results in terms of Mean, Standard Deviations, Classification Accuracy and Computational Time
with other Feature Extraction Approaches by Varying m-circle values of BLTA Classifier is Reported.
Number of Proposed feature extraction approach (Mansouri et al., 2008) proposed by Mansoori
m-circle
Mean Standard Classification Computational Mean Standard Classification Computational
Deviation Accuracy Time (seconds) Deviation Accuracy Time (seconds)
2 0.9225 0.0450 92.26±4.50 6.87±0.11 0.8469 0.0100 84.70±1.00 7.63±0.17
4 0.9290 0.0424 92.90±4.25 6.55±0.24 0.8477 0.0108 84.78±1.08 7.21±0.06
8 0.9431 0.0352 94.32±3.52 6.54±0.10 0.8493 0.0106 84.94±1.06 7.23±0.14
16 0.9379 0.0385 93.79±3.86 6.48±0.09 0.8510 0.0084 85.10±0.85 7.15±0.07
32 0.9379 0.0385 93.79± 3.86 6.44±0.11 0.8510 0.0084 85.10±0.85 7.15±0.06
64
0.9379 0.0385 93.79±3.86 6.57±0.23 0.8542 0.0054 85.42±0.55 7.11±0.07
128 0.9379 0.0385 93.79±3.86 6.50±0.30 0.8542 0.0054 85.42±0.55 7.11±0.06
256 0.9379 0.0385 93.79±3.86 6.58±0.21 0.8542 0.0054 85.42±0.55 7.14±0.09
512 0.9379 0.0385 93.79±3.86 6.50±0.14 0.8542 0.0054 85.42±0.55 7.15±0.1
1024 0.9379 0.0385 93.79±3.86 6.41±0.08 0.8542 0.0054 85.42±0.55 7.13±0.14
Number of (Bandyopadhyay, 2005) proposed by Bandyopadhyay (Wang et al., 2001) proposed by Wang
m-circle
Mean Standard Classification Computational Mean Standard Classification Computational
Deviation Accuracy Time (seconds) Deviation Accuracy Time (seconds)
2 0.6734 0.0829 67.34±8.30 10.60±0.18 0.5141 0.0026 51.41±0.27 63.98±1.26
4 0.6744 0.0835 67.45±8.36 10.22±0.11 0.5141 0.0026 51.41±0.27 63.44±1.24
8 0.6748 0.0838 67.49±8.38 10.18±0.14 0.5141 0.0026 51.41±0.27 63.41±1.31
16 0.6750 0.0838 67.51±8.38 10.20±0.13 0.5141 0.0026 51.41±0.27 63.40±1.26
32 0.6750 0.0838 67.51±8.38 10.13±0.14 0.5141 0.0026 51.41±0.27 63.40±1.28
64 0.6750 0.0838 67.51±8.38 10.13±0.09 0.5141 0.0026 51.41±0.27 63.42±1.20
128 0.6750 0.0838 67.51±8.38 10.14±0.14 0.5141 0.0026 51.41±0.27 63.54±1.26
256 0.6750 0.0838 67.51±8.38 10.13±0.09 0.5141 0.0026 51.41±0.27 63.49±1.31
512 0.6750 0.0838 67.51±8.38 10.14±0.17 0.5141 0.0026 51.41±0.27 63.39±1.20
1024 0.6750 0.0838 67.51±8.38 10.16±0.09 0.5141 0.0026 51.41±0.27 63.40±1.22
ANovelTechniqueofFeatureExtractionBasedonLocalandGlobalSimilarityMeasureforProteinClassification
223

set, highest Classification Accuracy achieved by pro-
posed technique is 94.32 ± 3.52 on m-circle value 8
with Computational Time 6.54±0.10 (s). Instead,
it attains 92.26 ± 4.50 as the minimum Classifica-
tion Accuracy with Computational Time 6.87±0.11
(s) on m-circle value 2. On the other hand, method
given by (Mansouri et al., 2008) attains 85.42 ±
0.55 as maximum Classification Accuracy for m-
circle values {64,...,1024} with Computational Time
varies from {7.11±0.06,..,7.15±0.1} (s) whereas it
gives the minimum Classification Accuracy 84.70 ±
1.00 on m-circle value 2 with Computational Time
7.63±0.17 (s). On the contrary, the method pro-
posed by (Bandyopadhyay, 2005) achieves the best
Classification Accuracy rate 67.51 ± 8.38 on m-
circle values {16,...,1024} with Computational Time
from {10.13±0.09,..,10.20±0.13} (s). Although, it
gives the worst Classification Accuracy rate 67.34 ±
8.30 for m-circle value 2 with Computational Time
10.60±0.18 (s). The other method developed by
(Wang et al., 2001), exhibits 51.41 ± 0.27 as mini-
mum and maximum Classification Accuracy rate for
all the values of m-circle with Computational Time
varies from {63.39±1.20,..,63.98±1.26}(s). More-
over, exhaustive results reported in Table 5, jus-
tify the significance of proposed approach due to
the improvements in Classification Accuracy rate as
well as in Computational Time when compared with
the methods proposed by (Mansouri et al., 2008),
(Bandyopadhyay, 2005), (Wang et al., 2001).
4 CONCLUSIONS
In this paper, a novel feature extraction approach is
proposed for classifying the protein sequences into
the superfamilies. The proposed approach compute
both the local and global similarity measures for ex-
tracting relevant features corresponding to each pro-
tein sequence. The global similarity measure is cal-
culated by considering probability of occurrence of
the positional variance of each amino acid among all
the sequences within the superfamily. However, the
local similarity measure is produced by evaluating a
weighting scheme (Karchin and Hughey, 1998) of the
global probability and then assigns the weighted prob-
ability of each amino acid to the six exchange groups
(Dayhoff and Schwartz, 1978). Finally, the 6 features
are extracted corresponding to each protein sequence
which is classified using Boolean-Like Training Al-
gorithm (BLTA) (Gray and Michel, 1992).
The experimental work is carried out on two su-
perfamilies Ras and Globin to probe the efficacy of
the proposed approach on BLTA classifier in compar-
ison with other approaches (Mansouri et al., 2008),
(Bandyopadhyay, 2005), (Wang et al., 2001). More-
over, the results are analyzed and reported in terms of
four parameters-Mean, Standard Deviation, Classifi-
cation Accuracy and Computational Time with vari-
ation in m-circle values of BLTA classifier. The ob-
servation can be drawn from the experimental re-
sults, that the proposed approach extract very limited
number of features in comparison with other meth-
ods. Therefore, it outperforms on the BLTA classi-
fier and thus, achieves best Classification Accuracy
94.32 ± 3.52 with Computational Time 6.54±0.10 (s)
on m-circle value 8. Hence, its performance is much
higher in comparison to other methods (Mansouri
et al., 2008), (Bandyopadhyay, 2005), (Wang et al.,
2001) in terms of Classification Accuracy and Com-
putational Time.
REFERENCES
Bandyopadhyay, S. (2005). An efficient technique for su-
perfamily classification of amino acid sequences: fea-
ture extraction, fuzzy clustering and prototype selec-
tion. Fuzzy Sets and Systems, 152(1):5–16.
Barker, W., Garavelli, J., Huang, H., McGarvey, P., Orcutt,
B., G.Y.Srinivasarao, Xiao, C., Yeh, L., Ledley, R.,
Janda, J., F.Pfeiffer, H.W.Mewes, A. T., and Wu, C.
(2004). The protein information resource (pir). Nu-
cleic Acids Research, 28(1):41–44.
Dayhoff, M. and Schwartz, R. (1978). A model of evo-
lutionary change in proteins. In In Atlas of protein
sequence and structure. Citeseer.
Gray, D. and Michel, A. (1992). A training algorithm for bi-
nary feedforward neural networks. Neural Networks,
IEEE Transactions on, 3(2):176–194.
Iqbal, M. J., Faye, I., Samir, B. B., and Said, A. M. (2014).
Efficient feature selection and classification of protein
sequence data in bioinformatics. The Scientific World
Journal, 2014.
Karchin, R. and Hughey, R. (1998). Weighting hidden
markov models for maximum discrimination. Bioin-
formatics, 14(9):772–782.
Mansouri, E., A.M. Zou, S. Katebi, H. M. R. B., and Sadr,
A. (2008). Generating fuzzy rules for protein classifi-
cation. Iranian Journal of Fuzzy Systems.
Solovyov, A. and Lipkin, W. I. (2013). Centroid based clus-
tering of high throughput sequencing reads based on
n-mer counts. BMC bioinformatics, 14(1):268.
Vergara, J. R. and Est
´
evez, P. A. (2014). A review of fea-
ture selection methods based on mutual information.
Neural Computing and Applications, 24(1):175–186.
Vipsita, S. and Rath, S. K. (2013). Two-stage approach for
protein superfamily classification. Computational Bi-
ology Journal, 2013.
Wang, J., Ma, Q., Shasha, D., and Wu, C. (2001). New tech-
niques for extracting features from protein sequences.
IBM Systems Journal, 40(2):426–441.
BIOINFORMATICS2015-InternationalConferenceonBioinformaticsModels,MethodsandAlgorithms
224
