
Sitting Posture Detection using Fuzzy Logic
Development of a Neuro-fuzzy Algorithm to Classify Postural Transitions
in a Sitting Posture
Bruno Ribeiro
1
, Leonardo Martins
1,2
, Hugo Pereira
1
, Rui Almeida
1
, Cláudia Quaresma
1,3
,
Adelaide Ferreira
1
and Pedro Vieira
1,4
1
Department of Physics, Faculty of Sciences and Technology of the New University of Lisbon,
Quinta da Torre, 2829-516, Caparica, Portugal
2
UNINOVA, Institute for the Development of New Technologies, Quinta da Torre, 2829-516, Caparica, Portugal
3
CEFITEC, Faculty of Sciences and Technology of the New University of Lisbon, Quinta da Torre, 2829-516,
Caparica, Portugal
4
Centre of Atomic Physics, Faculty of Sciences and Technology of the New University of Lisbon,
Quinta da Torre, 2829-516, Caparica, Portugal
Keywords: Intelligent Chair, Pressure-distribution Sensors, Sitting Posture, Posture Classification, Fuzzy Logic, Neural
Networks.
Abstract: In a previous work, a chair prototype was used to detect 11 standardized seating postures of users, using just
8 air bladders (4 in the chair’s seat and 4 in the backrest) and one pressure sensor for each bladder. In this
paper we describe a new classification algorithm, which was developed in order to classify the postures
using as input the Centre of Pressure, the Posture Adoption Time and the Posture Output from the existing
Neural Network Algorithm. This new Posture Classification Algorithm is based on Fuzzy Logic and is able
to determine if the user is adopting a good or a bad posture for specific time periods. The newly developed
Classification Algorithms will prompt the improvement of new Posture Correction Algorithms based on
Fuzzy Actuators.
1 INTRODUCTION
Society sedentary behaviours are influenced by
many factors and on various domains, including
spending extended periods of time in a sitting
position in a variety of settings, such as the
occupational workspace, transports, leisure activities
and household activities (Owen et al., 2011; Chau et
al., 2010).
Low back pain has been identified as one of the
leading causes of work-related disability and loss of
productivity in industrialized countries (Ramdan et
al., 2014; Punnett and Wegman, 2004), but
systematic studies haven’t been able to establish a
causal and independent relationship between
occupational sitting and low back pain (Hartvigsen
et al., 2000; Roffey et al., 2010), although an
increasing risk of this disorder has been associated
with sitting during extended periods of time (Todd et
al., 2007).
This situation happens because when a person
has prolonged sitting behaviours, this will lead to a
decrease of the lumbar lordosis (Van Dieën et al.,
2001; Cagnie et al., 2007) which then increase the
physical risk factors related to back, neck and
shoulder pain (Ariëns et al., 2001; Juul-Kristensen et
al., 2004). This pain is due to anatomical alterations
and degeneration of the intervertebral disks and
joints (Adams and Hutton, 1986; Kingma et al.,
2000).
Recent studies have shown that still doesn’t exist
a consensus on what comprises a neutral spine
posture in a sitting posture (O’Sullivan et al., 2012)
due to the difficulty of doing quantitative clinical
studies that target the identification of 'correct' and
'incorrect' postures. The main approaches of such
studies is to use multiple camera sensors to build a
3D optical model of the body posture (Edmondston
et al., 2007) or using sensors applied directly to the
skin able to assess the spinal angles in different
postures (Claus et al., 2009) or to calculate the
relative distance between anatomical landmarks of
191
Ribeiro B., Martins L., Pereira H., Almeida R., Quaresma C., Ferreira A. and Vieira P..
Sitting Posture Detection using Fuzzy Logic - Development of a Neuro-fuzzy Algorithm to Classify Postural Transitions in a Sitting Posture.
DOI: 10.5220/0005287101910199
In Proceedings of the International Conference on Health Informatics (HEALTHINF-2015), pages 191-199
ISBN: 978-989-758-068-0
Copyright
c
2015 SCITEPRESS (Science and Technology Publications, Lda.)
the spine (O’Sullivan et al., 2010).
In a normal sitting position, the ischial
tuberosities, the thigh and gluteal muscles support
most of the person’s weight, while the remaining
pressure load is transferred to the ground by the feet
and to the backrest and armrests (Pynt et al., 2001).
In most of the ‘incorrect’ postures the trunk is not
totally supported in the backrest due to the lateral
flexion of the upper part of the trunk, or due to
forward or backward inclination of the trunk or due
to leg crossing. In these positions, the weight is
incorrectly transferred which can have an amplifying
effect in back and neck associated disorders (Lis et
al., 2007).
To promote a more dynamic sitting posture and
increase physical activities, chair manufacturers
have developed office chairs with structural
elements such as, seat pan motors, seat pan
suspension systems and moveable joints that can
permit movement in the horizontal plane or even
freely in all directions. Studies showed that different
chairs didn’t influenced a significant difference body
dynamics (such as muscle activation), while each of
the studied task strongly affected the body dynamics
(Ellegast et al., 2012). This suggests the need to
develop a intelligent chairs capable of identifying
the user posture or the associated task, and alerting
the users of prolonged sitting behaviours.
Such intelligent chairs have been developed in
recent years by numerous research groups, by
implementing sheets of surface-mounted pressure
sensors placed in a 2D array or using pure
mathematical and statistical approaches to find the
best way to place singular force-sensitive resistors in
the chair or even conductive textiles (Zhu et al.,
2003; Forlizzi et al., 2005; Tan et al., 2001; Zheng
and Morrell, 2010; Schrempf et al., 2011; Mutlu et
al., 2007).
These intelligent chairs have been shown to be
capable of detecting the presence of a person, detect
the sitting posture of that person and alerting the
person to improve their sitting posture or even as an
input device in an office environment. They can be
used as physiological monitor and create report tools
of everyday activities which is already being
implemented in real homes for year-long tests
(Palumbo et al., 2014).
In a previous work, a chair prototype was used to
classify 11 standardized seating postures of users,
using 8 air bladders (4 in the chair’s seat and 4 in the
backrest) by using pressure sensor for each bladder
to detect the bladder’s interior pressure (Martins et
al., 2014). The bladders from the previous prototype
are shown in Figure 1-A. The classification
algorithm was based on Neural Networks and
Decision trees and was able to make a real-time
overall classification 93% (for eight postures) and
dropped to 70% (for the eleven standardized
postures) (Martins et al., 2014).
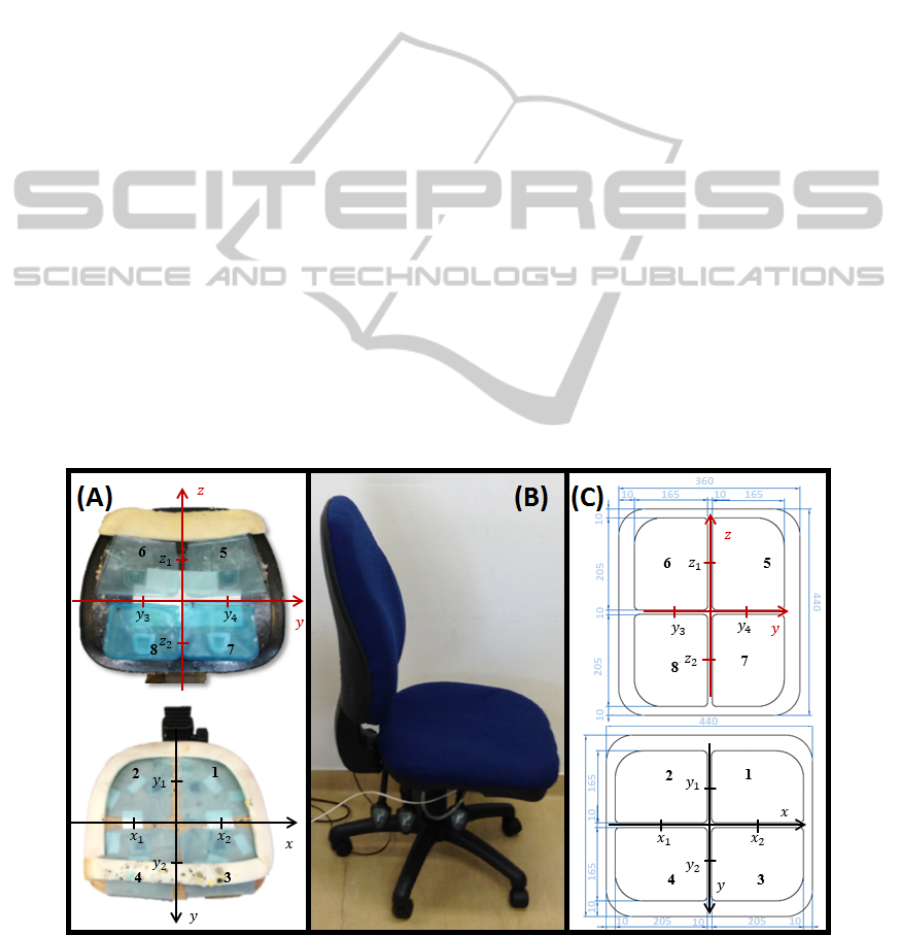
Figure 1: (A) Interior of the previous prototype and Centre of Pressure (COP) measurement (B) New Prototype (C)
Schematic of the new air bladder system and COP measurement. Bladder 1 (Back Left – BL), Bladder 2 (Back Right – BR),
Bladder 3 (Front Left - FL), Bladder 4 (Front Right - FR), Bladder 5 (Up Left – UL), Bladder 6 (Up Right – UR), Bladder 7
(Down Left – DL) and Bladder 8 (Down Right – DR).
HEALTHINF2015-InternationalConferenceonHealthInformatics
192

In this work we integrate Fuzzy Logic to the
existing Neural Network-based Algorithm to classify
the transition between postures and intermediate
postures that cannot be accurately classified using
the previously developed algorithms.
2 EXPERIMENTAL SECTION
2.1 Equipment
In a previous work, a chair prototype was built with
a 2-by-2 matrix of air bladders (see Figure 1-A).
Each individual air bladder was made with
thermoplastic polyurethane, were manually sealed
and had 20x19cm of dimensions and were placed in
the seat pan and the backrest (as can be seen in
figure 1). This arrangement cover the most
important and distinguishable areas of the seated
posture (Pynt et al., 2001), such as the ischial
tuberosities, the posterior thigh region, the lumbar
region of the spine and the scapula (Martins et al.,
2014).
For this project we started by projecting a new
set of air bladders that were industrially made (this
makes a big difference as it is guaranteed that the
volume inside each bladder is the same when they
are fully inflated) and integrated in a different office
chair (seen in Figure 1-B). The new bladder system
and its measurements can be seen in figure 1-C. The
bladder placement had the same strategy of the
previous work. The original padding foam was also
used, and placed above the pressure bladders, in
order to keep the original anatomical cut of the seat
pad and backrest. As it is guaranteed that each
bladder has exactly the same geometry, in this case
we also used the same pressure sensors for the
backrest and seatpad (in the previous work, the
sensors were different), which were the Honeywell
24PC Series piezoelectric gauge pressure sensor,
with a max rate of 15 psi, with a sensitivity of
15mV/psi. The values of x
1
, x
2
, z
1
, z
2
correspond to
around 10.5 cm and y
1
, y
2
, y
3
, y
4
to around 8.5 cm.
This values is calculated by halving the bladders
sizes (20.5 and 16.5), adding half of the 10 mm
spacing between each bladder, and make rounding
adjustments due to the curvature of the bladders.
Bluetooth communication was also added to this
prototype, as in the previous prototype, making it
capable of transferring the daily postural information
to computers and smartphones, allowing a statistical
analysis of the postures taken during the day
(Martins et al., 2014).
2.2 Experimental Procedure and
Participants
Two experiments were done for this work. The first
one (A) followed a similar protocol then in the
previous work (Martins et al., 2014) and served for
data acquisition in order to create the Seated Posture
Classification Algorithms, based on Neural
Networks. The second experiment (B) was used to
study how the Neural Network behaves during
standard posture changes (in intermediate postures).
From the previous experiments (Martins et al.,
2014) we increased the number of subjects from 30
to 50, and also tried to have more indicative sample
of office workers (increasing the Age of the
participants from around 21 to 26). The dataset for
both experiments is presented in Table 1. Based on
the knowledge from previous experiments (Martins
et al., 2014) and since now the bladders have exactly
the same volume, we inflated all the bladders for 5
seconds (instead of having different inflation times
for each bladder) so we could take precise reading of
the bladder interior pressure, but not enough to
originate discomfort to the users. Before the
experiment, the participants were asked to empty
their pockets and to adjust the stool height to the
popliteal height.
Table 1: Data of the participants in the experiment,
namely, Sex, Age, Weight and Height. Note: a Values for
Average±Standard Deviation and (M/F) corresponds to
(Male/Female).
No. of
subjects (M/F)
Age
(years)
a
Weight
(Kg)
a
Height
(cm)
a
Experiment A
50 (25/25) 26,4±9,9 66,8±12,1 170,9±10,0
Experiment B
12 (6/6) 25,8±6,6 72,8±12,1 173,1±10,7
For the first experiment, we used a similar protocol
then the previous work (Martins et al., 2014), and
showed a presentation of postures P1 to P6 (as can
be seen in figure 2), each for a duration of 20
seconds. First we asked the participants to mimic the
postures without leaving the chair. Then we asked
them to repeat the same postures two more times,
but after every postural change we asked the
participant to walk out of the chair and move to a
certain point in the room and sit back again. The
chosen postures were the same as the previous work
(Martins et al., 2014), which were based on the most
familiar postures observed in office environments
(Zhu et al., 2003; Forlizzi et al., 2005; Tan et al.,
2001; Zheng and Morrell, 2010; Mutlu et al., 2007;
Vergara and Page, 2000)
SittingPostureDetectionusingFuzzyLogic-DevelopmentofaNeuro-fuzzyAlgorithmtoClassifyPosturalTransitionsin
aSittingPosture
193
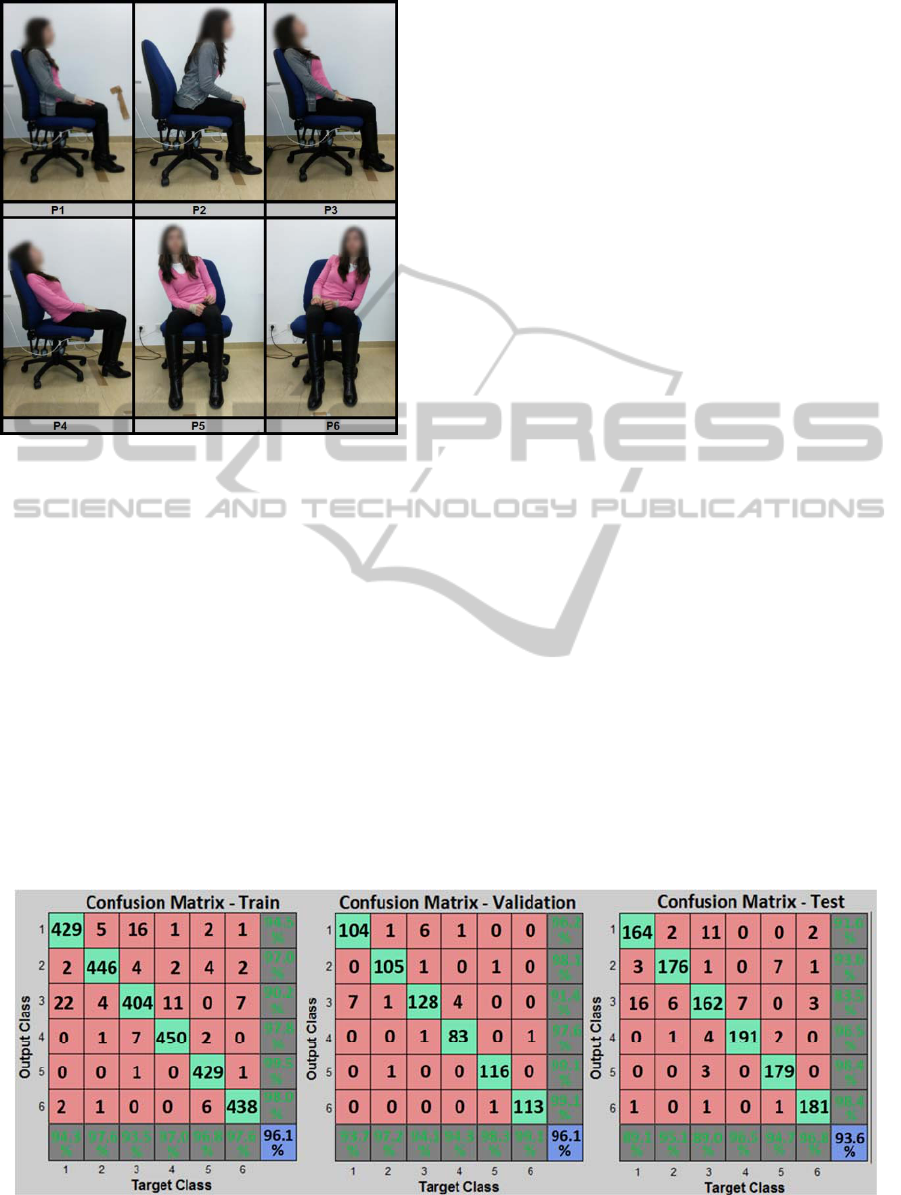
Figure 2: Seated postures used in the experiments and
respective class label: (P1) seated upright, (P2) leaning
forward, (P3) leaning back, (P4) leaning back with no
lumbar support, (P5) leaning right, (P6) leaning left.
As in previous work, on experiment A we also
didn’t use the entire 20 seconds of acquired data,
because when a user changes its posture, the sensed
pressure values oscillate (Transition zone) and then
stabilize (Stable zone) as shown in figure 3. The
chosen data to be used as input was extracted only
from the Stable zone.
Here, using a sampling rate of 8 Hz (which is
enough to classify sitting posture behaviour), we
took 100 time-points (which correspond to 12.5
seconds out of 20 for each posture), and divided
them in groups of 20 pressure acquisition. Each
group was averaged, forming 5 pressure maps that
serve as input to the Neural Networks, contributing
to a total of 4500 pressure maps (50 participants * 6
postures * 5 averages * 3 repetitions).
For experiment B, we wanted to see how the
Neural Network algorithm worked during the
Transition zone (see figure 4) between Posture P1
and other Postures (which for this first experiment is
only done to P5 and P6). For this, we asked the
participants to move from P1 to P5, back to P1, then
move to P6 and back to P1 (and repeat this 5 times).
We observed that during a postural transition, the
classification was intermittent (this corresponds to
the Transition Zone identified in Figure 4). So for
this experiment we took a picture when the ANN
algorithm first changed its value (entering the
Transition Zone), and a second picture when the
algorithm kept giving the right answer (entering the
Stable Zone) The observed results from the
influence of the lateral angle in the Neural Network,
prompted the integration of Fuzzy Logic to cope
with the instability of the Neural Network.
2.3 Classification Methods
Artificial neural network-based classification
algorithms have been shown to be useful in many
engineering and biomedical applications (Paliwal
and Kumar, 2009). In the previous work we have
used them and since they show the ability to handle
very well our multiclass problem, we took the
decision to continue using them. They also have the
advantage of being easily implemented in other
systems (by importing the weights and bias
matrices).
For the parameterization of the ANN, we tested
again the same parameters as in the previous work,
by making combinations of layers, neurons, training
and transfer functions (Martins et al., 2014).
Fuzzy logic and specially Neuro-fuzzy
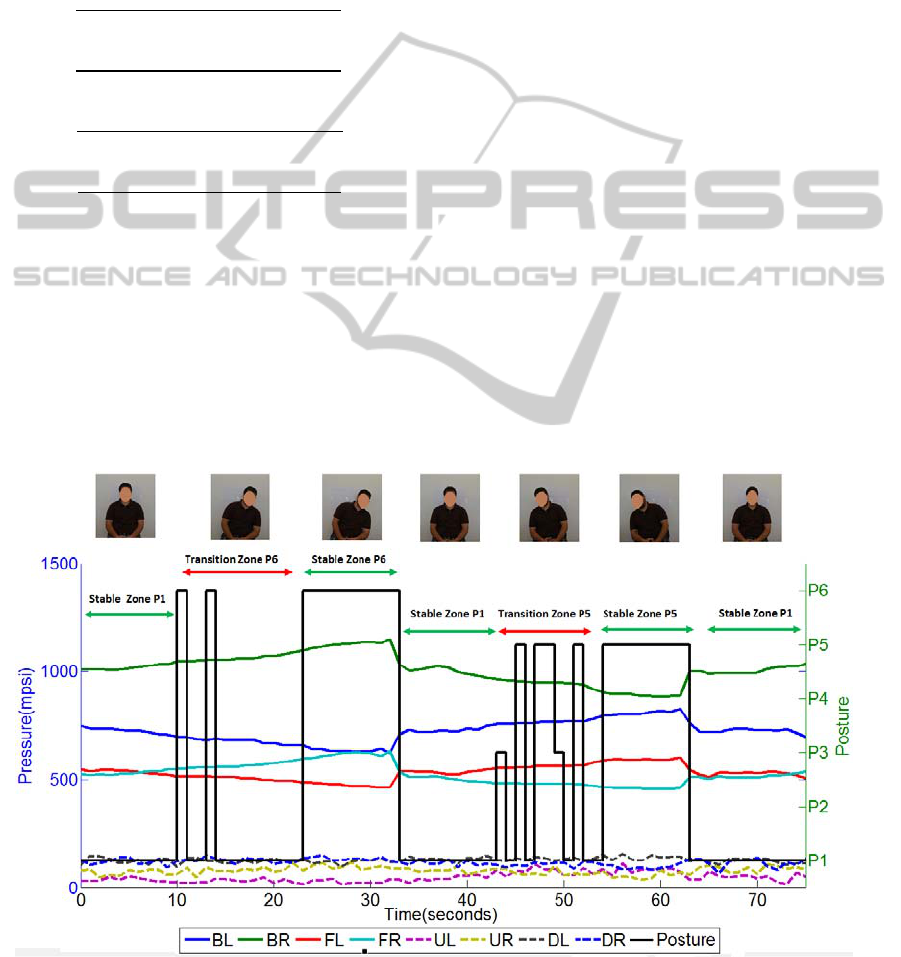
Figure 3: Confusion matrices for the training data (left matrix - corresponding to 60% of the total data), validation data
(centre matrix – 15 % of data), and testing data (left matrix – 25% of data).
HEALTHINF2015-InternationalConferenceonHealthInformatics
194
integrations have also been used in many
engineering and biomedical applications (Kar et al.,
2014). Here we use as input variables for the Neuro-
fuzzy algorithm, the Centre of Pressure (COP) of the
seat pad and backrest (which are calculated based on
equations 1-4 and figure 1), the posture output from
the Neural Network and the time spent in that output
posture. This algorithm evaluates the posture each
15 minutes.
∑
(1)
∑
(2)
∑
(3)
∑
(4)
3 RESULTS AND DISCUSSION
3.1 Results from Experiment A
As in the previous study, the best result was again
using the Resilient-back Propagation algorithm, with
the tansig function, but now with 1 layers of 40
neurons (comparing with the 1 layer of 15 neurons
from the previous work). This result shows that our
new bladder system changed slightly the pressure
maps, which influenced how the classification
algorithms adapted. The confusion matrix for the
training, validation and testing data, using the best
parameters is shown in figure 3.
3.2 Results from Experiment B
For experiment B, first we studied how the lateral
angle influenced the classification algorithm. Figure
4 shows one cycle of this experiment, where it
shows the Transition Zones between postures. To
calculate the angle where these transitions occur, we
took a picture of the participants every time they
entered into a new Zone, and then measured the
trunk inclination in Position P1 (for reference) and
the trunk inclination in the other positions. In order
to include the variability among raters this
measurements were done by 3 different experts, so
we also calculated the degree of reliability among
raters by using two way Intra Class Correlation
(ICC) for each Angle measurement (Fleiss., 1986a).
The average, standard deviation values of each
Transition Angle and the ICC score are presented in
Table 2. For the first Transition, we identified an
average angle of 11.0º (for P5) and 13.5º (for P6),
and for the second Transition we identified an angle
of 17.6º and 20.0º, respectively for P5 and P6. This
Figure 4: Example the pressure map for one cycle of Experiment B. The transition from a Stable Zone in P1 to a Stable
Zone in P6 (in green arrows) and then P1 to P5 goes through a Transition Zone (in red arrow), where the classification is
intermittent. Legend of each bladder is according to figure 1.
SittingPostureDetectionusingFuzzyLogic-DevelopmentofaNeuro-fuzzyAlgorithmtoClassifyPosturalTransitionsin
aSittingPosture
195

values are in good agreement with the identification
of a lateral trunk bending angle, which has normally
been defined at 15º (Hobson, 1992). This angle is in
our Transition Zone, where we are able to classify as
a lateral bending posture (P5 or P6), but there are
also mistakes with other postures, due to shear
movement (P3 and P1). The ICC values show that
the angles measured by each expert rater have good
reliability (values between 0.5 and 0.75 have a good
reliability, and higher than 0.75 have an excellent
reliability), validating our measurements (Fleiss.,
1986b).
We use a two-sample Kolmogorov-Smirnov
(KS) test, to check if the P5 and P6 angles have of
each subject have the same distribution. Table 2
shows the results of the KS tests for each Transition
and for each subject at a 1% significance level.
Table 2: Measurement of the lateral angle when the
Transition Zone if identified from P1 to the respective
Posture, and when the angle when the Stable Zone is
identified of the respective Posture.
Subject
1st – P5
(/º)
2nd – P5
(/º)
1st – P6
(/º)
2nd – P6
(/º)
1
10.7±2.2
17.5±2.6
12.9±3.4 20.6±2.4
2
6.5±0.7
11.8±1.1
6.7±1.2 11.4±1.0
3
13.5±2.4
19.6±2.7
16.7±3.6 23.9±2.2
4
8.4±1.4
15.1±1.9
9.2±1.1 14.0±1.6
5
11.6±3.4
22.2±2.9
13.9±3.0 25.7±6.0
6
12.9±2.2
21.4±2.5
17.3±3.5 22.9±5.0
7
16.2±3.6
23.2±2.5
26.7±4.3 35.5±3.3
8
11.3±1.4
17.2±1.6
10.4±1.5 16.8±2.4
9
7.4±1.7
12.9±2.7
10.4±1.6 15.2±1.8
10
11.5±1.4
17.3±2.3
11.5±1.4 17.2±2.1
11
12.0±2.0
16.8±2.4
12.8±1.8 18.1±2.7
12
10.5±2.6
16.6±1.7
13.7±2.3 18.7±2.9
Average
11.0±3.4
17.6±4.0 13.5±5.5 20.0±6.9
ICC
0.53
0.74 0.77 0.70
From these results we can see that participant 7 had
both of their angle measurements rejected (and we
can easily see that the right and left angles are quite
different (16.2 compared to 26.7 and 23.2 compared
to 35.5). This can happen because participant 7 was
the person with the lowest height and weight (1.58
m and 48 kg respectively), and the classification
algorithm can have problems with persons with
anthropometric data far from the average population.
This can also happen when the participant doesn’t
seat symmetrically compared to the air bladders in
posture P1 or they move their pelvis during posture
transitions. There were 2 other measurements that
were rejected (participant 6 – test 1 and participant 3
- test 2), which means that the classification system
can have a small bias to one of the lateral sides. In
the Stable Zone during posture P5/P6, the ANN
classification algorithm does not differentiate
between smaller lateral flexion and larger flexion
(e.g. 20º compared to 35º), as the output of the ANN
is the same for these postures. We implement Fuzzy
Logic to differentiate between these types of
postures and also integrate the adopted time in each
sitting posture.
Table 3: Two-sample KS test at a 1% significance level.
Test 1 checks the null hypothesis that the data from the 1st
angles of P5 and P6 are from the same distribution. Test 2
checks the null hypothesis for the 2nd angles.
Subject Test 1 p-value Test 2 p-value
1 0 1.6786e-02 0 1.6786e-02
2 0 3.0794e-01 0 8.8990e-01
3 0 5.1467e-02 1 2.3766e-04
4 0 5.8861e-02 0 1.3586e-01
5 0 1.6786e-02 0 5.1467e-02
6 1 4.7152e-03 0 3.0794e-01
7 1 8.7713e-07 1 1.0054e-07
8 0 1.3586e-01 0 5.8861e-01
9 0 5.1467e-02 0 5.1467e-02
10 0 9.9832e-01 0 9.9832e-01
11 0 8.8990e-01 0 3.0794e-01
12 0 5.1467e-02 0 1.6786e-02
4 CLASSIFICATION BY FUZZY
LOGIC
To develop the fuzzy logic algorithm, we created
membership functions (shown in figure 5) dependent
on the COP of the backrest and seatpad and the time
spent in each posture. The set of rules are presented
in Table 4. The max time for the time function is
900 seconds (15 minutes), as we will evaluate the
sitting posture every 15 minutes. The interval for
each time membership function is based on ISO
standards for trunk inclination (Standardization,
2000), although those values are for standing
postures instead of sitting postures, so they were
increased accordingly. The maximum values for the
Centre of Pressure were previously mentioned and
are shown in figure 1-C. As an example, if in 15
minutes, the user was found to have been in two
postures P3 and P6 (respectively for 360 and 540
seconds), with an average value for the COPx_seat,
COPy_seat, COPy_back, COPz_back respectively
of [2.38; -1.76; 1.22; -2.17] cm for P3 and [-5.61; -
1.68; -2.97; -4.48] cm for P6. Using the MATLAB©
Fuzzy Logic Toolbox and the Mamdani Centre of
Gravity Defuzzification algorithm (Mamdani E. H.,
1974), we can reach a value of 0.354 and 0.443 (for
HEALTHINF2015-InternationalConferenceonHealthInformatics
196
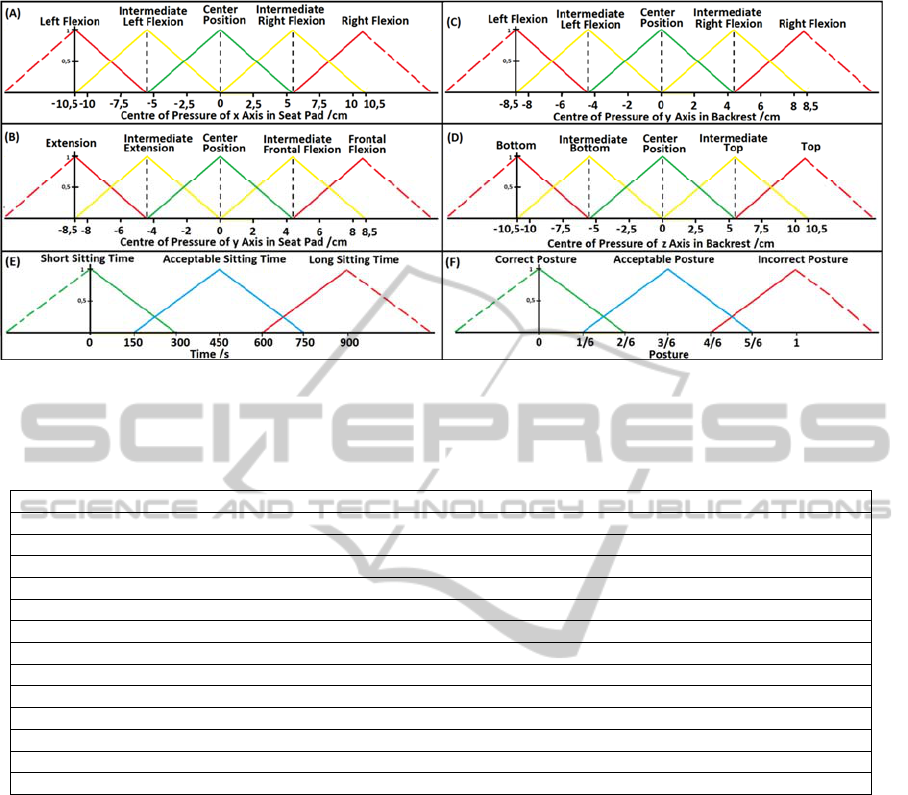
Figure 5: Membership functions of the fuzzy logic algorithm. Dashed lines represent values that are not possible to attain,
but we use a full triangle function to avoid asymmetric distributions. (A), (B), (C), (D) and (E) represent the antecedent
membership functions and (F) represents the consequent membership functions.
Table 4: Set of rules for the Fuzzy Logic Algorithm.
IF (Time = Long) THEN (Posture = Incorrect)
IF (Time = Short) OR (Cxh OR Cxv OR Czv OR Cyh = Center THEN (Posture = Correct)
IF (Cxh = Right flexion) OR (Cyh = Frontal Flexion) THEN (Posture = Incorrect)
IF (Cxv = Right flexion) OR (Czv = Top) THEN (Posture = Incorrect)
IF (Cxh = Left flexion) OR (Cyh = Extension) THEN (Posture = Incorrect)
IF (Cxv = Left flexion) OR (Czv =Bottom) THEN (Posture = Incorrect)
IF (Cxh = Int. Right Flexion) OR (Cyh = Int. Frontal Flexion)) AND (Time = Long) THEN (Posture = Incorrect)
IF ((Cxv = Int. Right Flexion) OR (Czv = Int. Top)) AND (Time = Long) THEN (Posture = Incorrect)
IF ((Cxh = Int. Left Flexion) OR (Cyh = Int. Extension)) AND (Time = Long) THEN (Posture = Incorrect)
IF ((Cxv = Int. Left Flexion) OR (Czv = Int. Bottom)) AND (Time = Long) THEN (Posture = Incorrect)
IF (Cxh = Int. Right Flexion) OR (Cyh = Int. Frontal Flexion)) AND (Time = Accept.) THEN (Posture = Incorrect)
IF ((Cxv = Int. Right Flexion) OR (Czv = Int. Top)) AND (Time = Accept.) THEN (Posture = Accept.)
IF ((Cxh = Int. Left Flexion) OR (Cyh = Int. Extension)) AND (Time = Accept.) THEN (Posture = Accept.)
IF ((Cxv = Int. Left Flexion) OR (Czv = Int. Bottom)) AND (Time = Accept.) THEN (Posture = Accept.)
P3 and P6 respectively). Using these values, we can
now try to implement a fuzzy logic actuator system
to inflate and deflate specific air bladders depending
on the detected postures.
5 CONCLUSIONS AND FUTURE
WORK
In a previous work, a chair prototype was used to
classify 11 standardized seating postures of users,
using 8 air bladders (4 in the chair’s seat and 4 in the
backrest). Here we showed that using industrialized
air bladders, improved the stability of the previously
developed Posture Classification Algorithm, which
was based on Neural Networks integrated with
Decision Trees. One of the identified gaps in that
system was the classification behaviour in
intermediate postures or during posture changing, as
the previous classification was only made in a so
called “stable zone”.
In this paper we studied how the classification
algorithm handled lateral postural changes, and
identified a stability and instability zones. During
lateral flexion, the stability zone was found to be
around an interval of 9º, between 11º and 20º. After
20º, the ANN algorithm is stable in classifying the
lateral flexion postures. To differentiate between
intermediate trunk flexion and extension we devise
an approach based on integrating Fuzzy logic into
the existing Neural Network-based Classification
Algorithm that was capable of classifying 6 standard
sitting positions
For future work we will need to check the
influence of the angle in frontal flexion and during
trunk extension, and lateral flexion during leg
crossing positions. Based on the output of the
SittingPostureDetectionusingFuzzyLogic-DevelopmentofaNeuro-fuzzyAlgorithmtoClassifyPosturalTransitionsin
aSittingPosture
197

Neuro-fuzzy classification algorithm we will devise
a Fuzzy actuation system to create a new Posture
Correction algorithm, since the previous algorithm is
based on simple Boolean logic (Martins et al., 2014).
ACKNOWLEDGEMENTS
This project (QREN 13330 – SYPEC) is supported
by FEDER, QREN – Quadro de Referência
Estratégico Nacional, Portugal 07/13 and
PORLisboa – Programa Operacional Regional de
Lisboa. The authors wish to thank Eng. Pedro
Duque, Eng. Rui Lucena, Eng. João Belo and Eng.
Marcelo Santos for the help provided in the
construction of the first prototype.
REFERENCES
Adams, M. & Hutton, W., 1986. The effect of posture on
diffusion into lumbar intervertebral discs. Journal of
anatomy, 147, pp.121–34.
Ariëns, G.A. et al., 2001. Are neck flexion, neck rotation,
and sitting at work risk factors for neck pain? Results
of a prospective cohort study. Occupational and
environmental medicine, 58(3), pp.200–7.
Cagnie, B. et al., 2007. Individual and work related risk
factors for neck pain among office workers : a cross
sectional study. European Spine Journal, 16(5),
pp.679–686.
Chau, J.Y. et al., 2010. Are workplace interventions to
reduce sitting effective ? A systematic review.
Preventive Medicine, 51(5), pp.352–356.
Claus, A.P. et al., 2009. Is “ ideal ” sitting posture real ?:
Measurement of spinal curves in four sitting postures.
Manual Therapy, 14(4), pp.404–408.
Van Dieën, J.H., De Looze, M.P. & Hermans, V., 2001.
Effects of dynamic office chairs on trunk kinematics,
trunk extensor EMG and spinal shrinkage.
Ergonomics, 44(7), pp.739–750.
Edmondston, S.J. et al., 2007. Postural neck pain : An
investigation of habitual sitting posture , perception of
“ good ” posture and cervicothoracic kinaesthesia.
Manual Therapy, 12(4), pp.363–371.
Ellegast, R.P. et al., 2012. Comparison of four specific
dynamic office chairs with a conventional office chair:
impact upon muscle activation, physical activity and
posture. Applied ergonomics, 43(2), pp.296–307.
Fleiss., J.L., 1986a. Reliability of Measurement. In The
design and analysis of clinical experiments. pp. 1–32.
Fleiss., J.L., 1986b. Reliability of Measurement. In The
design and analysis of clinical experiments. pp. 1–32.
Forlizzi, J. et al., 2005. The SenseChair : The lounge chair
as an intelligent assistive device for elders. In DUX
’05 Proceedings of the 2005 conference on Designing
for User eXperience. p. Article No. 31.
Hartvigsen, J. et al., 2000. Is sitting-while-at-work
associated with low back pain? A systematic , critical
literature review. Scand J Public Health, 28(3),
pp.230–239.
Hobson, D.A., 1992. Comparative effects of posture on
pressure and shear at the body-seat interface. The
Journal of Rehabilitation Research and Development,
29(4), p.21.
Juul-Kristensen, B. et al., 2004. Computer users’ risk
factors for developing shoulder, elbow and back
symptoms. Scandinavian Journal of Work,
Environment & Health, 30(5), pp.390–398.
Kar, S., Das, S. & Ghosh, P.K., 2014. Applications of
neuro fuzzy systems: A brief review and future
outline. Applied Soft Computing, 15, pp.243–259.
Kingma, I. et al., 2000. Monitoring water content in
deforming intervertebral disc tissue by finite element
analysis of MRI data. Magnetic Resonance in
Medicine, 44(4), pp.650–4.
Lis, A.M. et al., 2007. Association between sitting and
occupational LBP. European Spine Journal, 16(2),
pp.283–298.
Mamdani E. H., 1974. Control & Science Application of
fuzzy algorithms for control of simple dynamic plant.
Electrical Engineers, Proceedings of the Institution of,
121(12), pp.1585–1588.
Martins, L. et al., 2014. Intelligent Chair Sensor:
Classification and Correction of Sitting Posture.
International Journal of System Dynamics
Applications, 3(2), pp.65–80.
Mutlu, B. et al., 2007. Robust , Low-cost , Non-intrusive
Sensing and Recognition of Seated Postures. In UIST
’07 Proceedings of the 20th annual ACM symposium
on User interface software and technology. pp. 149–
158.
O’Sullivan, K. et al., 2010. Neutral lumbar spine sitting
posture in pain-free subjects. Manual Therapy, 15(6),
pp.557–561.
O’Sullivan, K. et al., 2012. What do physiotherapists
consider to be the best sitting spinal posture? Manual
therapy, 17(5), pp.432–7.
Owen, N. et al., 2011. Adults’ sedentary behavior
determinants and interventions. American journal of
preventive medicine, 41(2), pp.189–96.
Paliwal, M. & Kumar, U. a., 2009. Neural networks and
statistical techniques: A review of applications. Expert
Systems with Applications, 36(1), pp.2–17.
Palumbo, F. et al., 2014. Sensor network infrastructure for
a home care monitoring system. Sensors (Basel,
Switzerland), 14(3), pp.3833–60.
Punnett, L. & Wegman, D.H., 2004. Work-related
musculoskeletal disorders: the epidemiologic evidence
and the debate. Journal of Electromyography and
Kinesiology, 14(1), pp.13–23.
Pynt, J., Higgs, J. & Mackey, M., 2001. Seeking the
optimal posture of the seated lumbar spine.
Physiotherapy Theory and Practice, 17(1), pp.5–21.
Ramdan, N.S.A. et al., 2014. On Lower-back Pain and Its
Consequence to Productivity. Journal of Industrial
and Intelligent Information, 2(2), pp.83–87.
HEALTHINF2015-InternationalConferenceonHealthInformatics
198

Roffey, D.M. et al., 2010. Causal assessment of
occupational sitting and low back pain: results of a
systematic review. The spine journal : official journal
of the North American Spine Society, 10(3), pp.252–
61.
Schrempf, A. et al., 2011. PostureCare - Towards a novel
system for posture monitoring and guidance. In 18th
World Congress of the International Federation of
Automatic Control (IFAC). pp. 593–598.
Standardization, I.O. for, 2000. Ergonomics—Evaluation
of static working postures. , 2000, pp.1–26.
Tan, H.Z. et al., 2001. A Sensing Chair Using Pressure
Distribution Sensors. IEEE/ASME TRANSACTIONS
ON MECHATRONICS, 6(3), pp.261–268.
Todd, A.I., Bennett, A.I. & Christie., C.J., 2007. Physical
implications of prolonged sitting in a confined
posture-A literature review. Ergonomics SA: Journal
of the Ergonomics Society of South Africa: Special
Edition, 19(2), pp.7–21.
Vergara, M. & Page, A., 2000. System to measure the use
of the backrest in sitting-posture office tasks. Applied
Ergonomics, 31(3), pp.247–254.
Zheng, Y. & Morrell, J., 2010. A Vibrotactile Feedback
Approach to Posture Guidance. In IEEE Haptics
Symposium. pp. 351–358.
Zhu, M., Mart, A.M. & Tan, H.Z., 2003. Template-based
Recognition of Static Sitting Postures. In Proceedings
of The Workshop on Computer Vision and Pattern
Recognition for Human Computer Interaction, held at
the IEEE Conference on Computer Vision and Pattern
Recognition (CVPR03), IEEE Computer Society,
Madison, Wisconsin. pp. 1–6.
SittingPostureDetectionusingFuzzyLogic-DevelopmentofaNeuro-fuzzyAlgorithmtoClassifyPosturalTransitionsin
aSittingPosture
199
