
Patch Autocorrelation Features for Optical Character Recognition
Radu Tudor Ionescu
1
, Andreea-Lavinia Popescu
2
and Dan Popescu
2
1
Faculty of Mathematics and Computer Science, University of Bucharest, 14 Academiei Street, Bucharest, Romania
2
Faculty of Automatic Control and Computer Science, Politehnica University of Bucharest, 313 Splaiul Independentei
Street, Bucharest, Romania
Keywords:
Autocorrelation, Image Autocorrelation, Optical Character Recognition, Digit Recognition, Patch-based
Method, Image Classification.
Abstract:
The autocorrelation is often used in signal processing as a tool for finding repeating patterns in a signal. In
image processing, there are various image analysis techniques that use the autocorrelation of an image for a
broad range of applications from texture analysis to grain density estimation. In this paper, a novel approach
of capturing the autocorrelation of an image is proposed. More precisely, the autocorrelation is recorded in
a set of features obtained by comparing pairs of patches from an image. Each feature stores the euclidean
distance between a particular pair of patches. Although patches contain contextual information and have
advantages in terms of generalization, most of the patch-based techinques used in image processing are heavy
to compute with current machines. Therefore, patches are selected using a dense grid over the image to reduce
the number of features. This approach is termed Patch Autocorrelation Features (PAF). The proposed approach
is evaluated in a series of handwritten digit recognition experiments using the popular MNIST data set. The
Patch Autocorrelation Features are compared with the euclidean distance using two classification systems,
namely the k-Nearest Neighbors and Support Vector Machines. The empirical results show that the feature
map proposed in this work is always better than a feature representation based on raw pixel values, in terms of
accuracy. Furthermore, the results obtained with PAF are comparable to other state of the art methods.
1 INTRODUCTION
The classical problem in computer vision is that of
determining whether or not the image data contains
some specific object, feature, or activity. A partic-
ular formulation of this problem is optical character
recognition. Computer vision researchers have devel-
oped sophisticated methods for this image classifica-
tion task. Among the state of the art models are vir-
tual SVMs (DeCoste and Sch
¨
olkopf, 2002), boosted
stumps (K
´
egl and Busa-Fekete, 2009), and convolu-
tional neural networks (LeCun et al., 1998), (Ciresan
et al., 2012). However, simple methods such as the
k-Nearest Neighbor (k-NN) model have also obtained
very good recognition results, sometimes being much
better than more sophisticated techniques. Some of
the techniques that fall in this category of simple yet
very accurate methods and worth to be mentioned are
the k-NN models based on Tangent distance (Simard
et al., 1996), shape context matching (Belongie et al.,
2002), non-linear deformation (Keysers et al., 2007),
and Local Patch Dissimilarity (Dinu et al., 2012), re-
spectively.
This paper introduces a simple feature represen-
tation for images that is based on the autocorrela-
tion of the image with itself. In this representa-
tion, each feature is determined by the euclidean dis-
tance between a pair of patches extracted from the
image. This novel feature representation is termed
Patch Autocorrelation Features (PAF). The autocor-
relation is a mathematical tool for finding repeat-
ing patterns which has a wide applicability in vari-
ous domains such as signal processing, optics, statis-
tics, image processing, or astrophysics. The autocor-
relation of an image gives some information about
the repeating patterns that occur in the image, and
it is extremely useful in texture analysis and classi-
fication. Several approaches of using the autocorre-
lation for image classification tasks have been pro-
posed so far (Brochard et al., 2001), (Popovici and
Thiran, 2001), (Horikawa, 2004), (Horikawa-2004,
2004), (Toyoda and Hasegawa, 2007), but the idea
of representing the image autocorrelation directly in
a set of features is new. As many other computer
vision techniques (Efros and Freeman, 2001), (De-
selaers et al., 2005), (Barnes et al., 2011), the PAF
419
Ionescu R., Popescu A. and Popescu D..
Patch Autocorrelation Features for Optical Character Recognition.
DOI: 10.5220/0005289804190426
In Proceedings of the 10th International Conference on Computer Vision Theory and Applications (VISAPP-2015), pages 419-426
ISBN: 978-989-758-089-5
Copyright
c
2015 SCITEPRESS (Science and Technology Publications, Lda.)

map considers patches rather than pixels, in order to
capture distinctive features such as edges, corners,
shapes, and so on. In other words, the PAF representa-
tion stores information about repeating edges, cornes,
and other shapes that can be found in the analyzed im-
age. Patches contain contextual information and have
advantages in terms of generalization, but they usu-
ally involve a lot of computations. To reduce the time
necessary to compute the PAF representation, patches
are compared using a grid over the image. The den-
sity of this grid can be adjusted to obtain the desired
trade-off between accuracy and speed.
Several handwritten digit recognition experiments
are conducted in this work in order to demonstrate the
performance gained by using the PAF representation
instead of a standard representation. More precisely,
experiments are performed using two different clas-
sifiers (k-NN and SVM) on images from the MNIST
data set. A set of experiments are conducted using
500 images, 1000 images, and the entire MNIST data
set, respectively. Another set of experiments are con-
ducted using deslanted digits, which can be classified
more accurately. The empirical results obtained in all
the experiments indicate that the PAF representation
is constantly better than the standard representation.
The best results obtained with the PAF representation
are similar to some of the state of the art methods.
The paper is organized as follows. Related work
on image analysis using autocorrelation and patch-
based methods is presented in Section 2. The Patch
Autocorrelation Features are described in Section 3.
A series of handwritten digit recognition experiments
are presented in Section 4. Finally, the conclusions
are drawn in Section 5.
2 RELATED WORK
2.1 Autocorrelation in Image Analysis
The autocorrelation is the cross-correlation of a sig-
nal with itself. In signal processing, it is used to find
repetitive patterns in a signal over time. Images can
also be regarded as spatial signals. Thus, it makes
sense to measure the spatial autocorrelation of an im-
age. Indeed, the autocorrelation has already been used
in image processing (Brochard et al., 2001), (Popovici
and Thiran, 2001), (Horikawa, 2004), (Toyoda and
Hasegawa, 2007). The authors of (Brochard et al.,
2001) present a method for feature extraction from
texture images. The method is invariant to affine
transformations, this being achieved by transform-
ing the autocorrelation function (ACF) and then by
determining an invariant criterion which is the sum
of the coefficients of the discrete correlation matrix.
A method for using higher order local autocorrela-
tions (HLAC) of any order as features is presented
in (Popovici and Thiran, 2001). The method exploits
the special form of the inner products of autocorre-
lations and the properties of some kernel functions
used by SVM. The authors of (Toyoda and Hasegawa,
2007) created large mask patterns for HLAC features
and constructed multi-resolution features to support
large displacement regions. The method is succes-
fully applied to texture classification and face recog-
nition. Kernel canonical correlation analysis based on
autocorrelation kernels is applied to invariant texture
classification in (Horikawa, 2004). The autocorrela-
tion kernels represent the inner products of the auto-
correlation functions of original data.
2.2 Patch-based Techniques
For numerous computer vision applications, the im-
age can be analyzed at the patch level rather than
at the individual pixel level or global level. Patches
contain contextual information and have advantages
in terms of computation and generalization. For ex-
ample, patch-based methods produce better results
and are much faster than pixel-based methods for
texture synthesis (Efros and Freeman, 2001). How-
ever, patch-based techniques are still heavy to com-
pute with current machines, as stated in (Barnes et al.,
2011).
A paper that describes a patch-based approach for
rapid image correlation or template matching is (Guo
and Dyer, 2007). By representing a template image
with an ensemble of patches, the method is robust
with respect to variations such as local appearance
variation, partial occlusion, and scale changes. Rect-
angle filters are applied to each image patch for fast
filtering based on the integral image representation.
An approach to object recognition was proposed
by (Deselaers et al., 2005), where image patches
are clustered using the EM algorithm for Gaussian
mixture densities and images are represented as his-
tograms of the patches over the (discrete) membership
to the clusters. Patches are also regarded in (Paredes
et al., 2001), where they are classified by a nearest
neighbor based voting scheme.
The work of (Agarwal and Roth, 2002) describes
a method where images are represented by binary fea-
ture vectors that encode which patches from a code-
book appear in the images and which spatial relation-
ship they have. The codebook is obtained by cluster-
ing patches from training images whose locations are
determined by interest point detectors.
The patch transform, proposed in (Cho et al.,
VISAPP2015-InternationalConferenceonComputerVisionTheoryandApplications
420
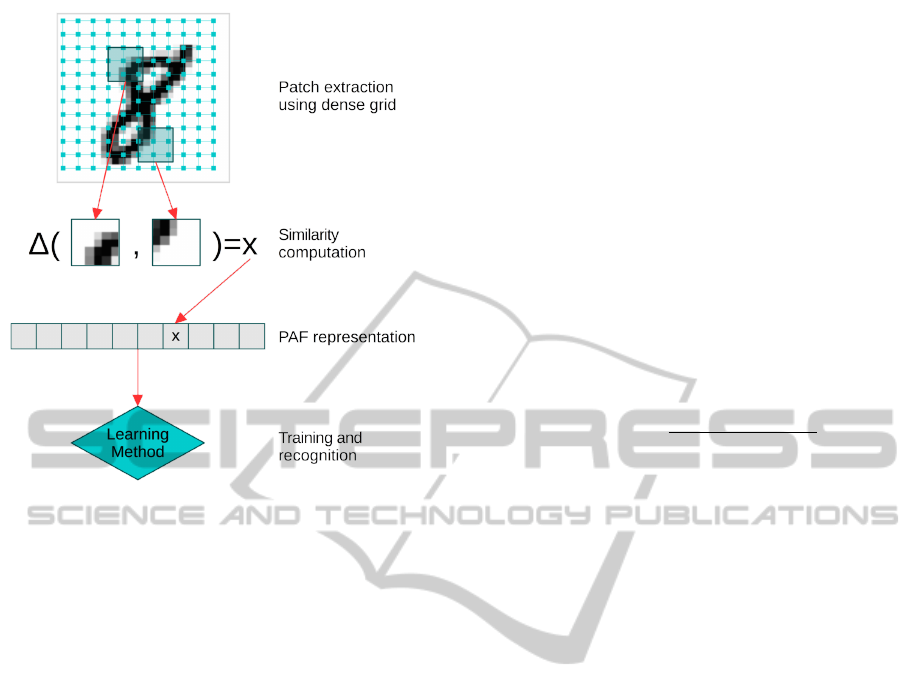
Figure 1: The classification system based on Patch Auto-
correlations Features. The PAF representation is obtained
by storing the similarity between pairs of patches that are
previously extracted using a dense grid over the input im-
age. The PAF maps of train images are used to learn dis-
criminant features. The trained classifier can then be used
to predict class labels for new images represented through
the same PAF vector.
2010), represents an image as a bag of overlapping
patches sampled on a regular grid. This representa-
tion allows users to manipulate images in the patch
domain, which then seeds the inverse patch transform
to synthesize a modified image.
Patches have also been used for handwritten digit
recognition in (Dinu et al., 2012). The authors
of (Dinu et al., 2012) present a dissimilarity measure
for images that quantifies the spatial non-alignment
between two images.
In (Barnes et al., 2011), a new randomized algo-
rithm for quickly finding approximate nearest neigh-
bor matches between image patches is introduced.
This algorithm forms the basis for a variety of ap-
plications including image retargeting, completion,
reshuffling, object detection, digital forgery detection,
and video summarization.
3 PATCH AUTOCORRELATION
FEATURES
The Patch Autocorrelation Features are inspired from
the autocorrelation used in signal processing. Instead
of quantifying the autocorrelation through a coeffi-
cient, the approach proposed in this work is to store
the similarities between patches computed at various
spatial intervals individually in a vector. This vector
contains the Patch Autocorrelation Features that can
be used for image classification.
In this work, the L
2
euclidean distance is used to
compute the similarity between patches, but it can
be substituted with any other distance or similarity
measure that could possibly work better in practice.
The only requirement is that the patches used by
PAF should be all of the same size in order to prop-
erly compute the similarity between patches. To re-
duce the number of parameters that need to be tuned,
another constraint to use squared patches was also
added. Formally, the L
2
euclidean distance between
two gray-scale patches X and Y each of p × p pixels
is:
∆
L
2
(X,Y ) =
v
u
u
t
p
∑
i=1
p
∑
j=1
(X
i, j
−Y
i, j
)
2
,
where X
i, j
represents the pixel found on row i and col-
umn j in X, and Y
i, j
represents the pixel found on row
i and column j in Y . At this point, one can observe
that the PAF representation contains a quadratic num-
ber of features with respect to the number of consid-
ered patches. More precisely, if n denotes the num-
ber of patches extracted from the image, then the re-
sulted number of features will be n(n − 1)/2, since
each pair of patches needs to be considered once and
only once. Thus, the computational complexity of
PAF is O(n
2
). However, a dense grid is applied over
the image to reduce the number of patches n. Extract-
ing patches or local features using a sparse or a dense
grid is a popular approach in computer vision (Cho
et al., 2010), (Ionescu and Popescu, 2014). The den-
sity of the grid is directly determined by a single pa-
rameter that specifies that distance (in pixels) between
consecutive patches. In practice, a good trade-off be-
tween accuracy and speed can be obtain by adjusting
this parameter.
The following steps describe how to compute the
PAF representation for an input image. The first step
is to apply a grid over the image to extract patches at a
given space interval. The patches are then compared
two by two, and the euclidean distance between each
pair of patches is recorded in a specific order in the
PAF vector. An important remark is to generate the
features in the same order for different images to en-
sure that each image is represented in the same way,
which is a mandatory characteristic of feature repre-
sentations used in machine learning. For instance, if
the similarity of two patches with the origins given by
the coordinate points (x,y) and (u,v) in image I, re-
PatchAutocorrelationFeaturesforOpticalCharacterRecognition
421
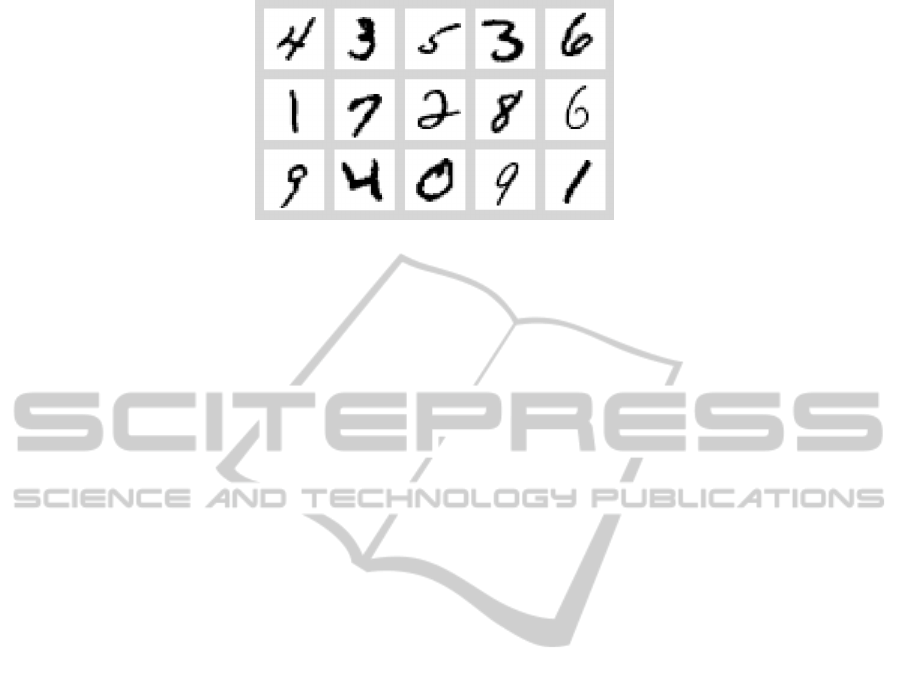
Figure 2: A random sample of 15 handwritten digits from the MNIST data set.
spectively, is stored at index k in the PAF vector of
image I, then the similarity of the patches having the
origins in (x,y) and (u,v) in any other image must al-
ways be found at index k in the PAF map. This will
enable any learning method to find the discriminant
features from the PAF vectors. The entire process that
involves the computation of the PAF vector for image
classification is summarized in Figure 1.
4 EXPERIMENTS AND RESULTS
4.1 Data Sets Description
Isolated handwritten character recognition has been
extensively studied in the literature (Suen et al.,
1992), (Srihari, 1992), and was one of the early suc-
cessful applications of neural networks (LeCun et al.,
1989). Comparative experiments on recognition of
individual handwritten digits are reported in (LeCun
et al., 1998). While recognizing individual digits is
one of many problems involved in designing a prac-
tical recognition system, it is an excellent benchmark
for comparing shape recognition methods.
The data set used for testing the feature represen-
tation presented in this paper is the MNIST set, which
is described in detail in (LeCun et al., 1998). The reg-
ular MNIST database contains 60,000 train samples
and 10,000 test samples, size-normalized to 20 × 20
pixels, and centered by center of mass in 28 × 28
fields. A random sample of 15 images from this data
set is presented in Figure 2. The data set is available
at http://yann.lecun.com/exdb/mnist/.
4.2 Learning Methods
The PAF representation must be used in a learning
context in order to evaluate its performance. Two
learning methods based on the PAF representation are
evaluated to provide a more clear overview of the
performance improvements brought by PAF and to
demonstrate that the improvements are not due to a
specific learning method. The first classifier, that is
intensively used through all the experiments, is the k-
Nearest Neighbors (k-NN). The k-NN classifier was
chosen because it directly reflects the characteristics
of the PAF representation, since there is no actual
training involved in the k-NN model.
A state of the art kernel method is also used in
the experiments, namely the SVM (Cortes and Vap-
nik, 1995) based on the linear kernel. Kernel-based
learning algorithms work by embedding the data into
a Hilbert space, and searching for linear relations in
that space using a learning algorithm. The embedding
is usually performed implicitly, that is by specifying
the inner product between each pair of points rather
than by giving their coordinates explicitly. However,
the PAF representation can also be regarded as an ex-
plicit embedding map of the original representation
given by the raw pixel data. After embedding the fea-
tures using the PAF map, the linear SVM classifier is
used to select the most discriminant features. In the
case of binary classification problems, Support Vec-
tor Machines try to find the vector of weights that
defines the hyperplane that maximally separates the
images in the Hilbert space of the training examples
belonging to the two classes. The SVM is a binary
classifier, but handwritten digit recognition is usually
a multi-class classification problem. There are many
approaches for combining binary classifiers to solve
multi-class problems. Typically, the multi-class prob-
lem is broken down into multiple binary classifica-
tion problems using common decomposing schemes
such as: one-versus-all and one-versus-one. In the ex-
periments presented next the one-versus-all scheme is
adopted.
4.3 Organization of Experiments
Several classification experiments are conducted us-
ing the 3-NN and the SVM classifiers based on the
PAF representation. These are systematically com-
pared with two benchmark classifiers, specifically a
VISAPP2015-InternationalConferenceonComputerVisionTheoryandApplications
422
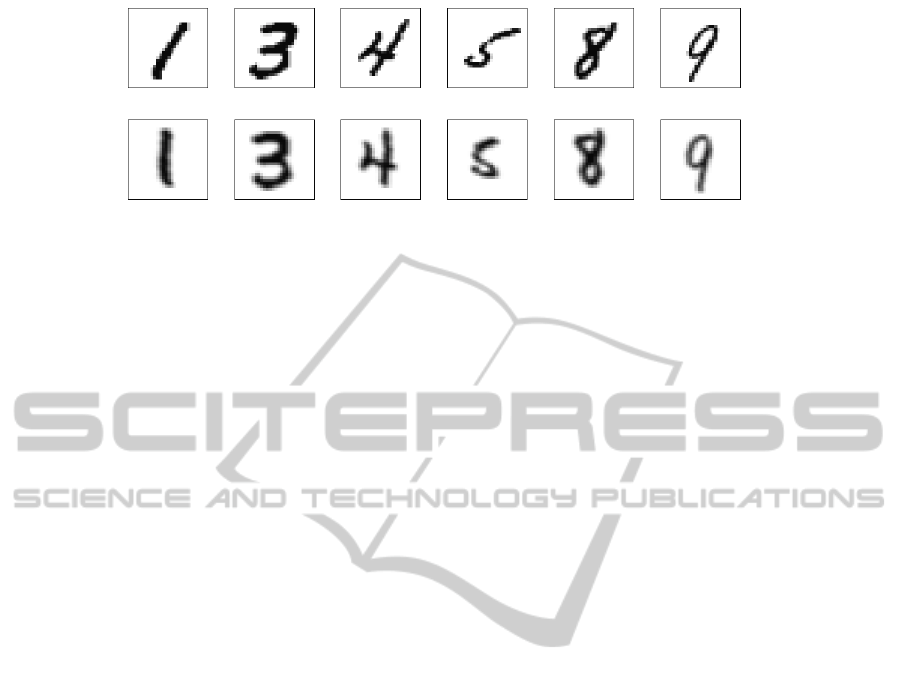
Figure 3: A random sample of 6 handwritten digits from the MNIST data set before and after deslanting. The original images
are shown on the top row and the slant corrected images are on the bottom row. A Gaussian blur was applied on the deslanted
images to hide the distortions introduced by the deslanting technique.
3-NN model based on the euclidean distance between
pixels and a SVM trained on the raw pixel representa-
tion. The experiments are organized as follows. First
of all, the two parameters of PAF and the regulariza-
tion parameter of SVM are tuned on a set of prelim-
inary experiments performed on the first 300 images
from the MNIST training set. Another set of exper-
iments are performed on the first 500 images and on
the first 1000 images from the MNIST training set,
respectively. These subsets of MNIST contain ran-
domly distributed digits from 0 to 9 produced by dif-
ferent writers. The experiments on these subsets are
performed using a 10-fold cross validation procedure.
The procedure is repeated 10 times and the obtained
accuracy rates are averaged for each representation
and each classifier. This helps to reduce the varia-
tion introduced by the random selection of samples
in each fold, and ensures a fair comparison between
results. Finally, the classifiers are evaluated on the en-
tire MNIST data set. Each experiment is repeated us-
ing deslanted digits, which was previously reported to
improve the recognition accuracy. The method used
for deslanting the digits is described in Section 4.5.
4.4 Parameter Tuning
A set of preliminary tests on the first 300 images of
the MNIST training set are performed to adjust the pa-
rameters of the PAF representation, such as the patch
size, and the pixel interval used to extract the patches.
Patch sizes ranging from 1 × 1 to 8 × 8 pixels were
considered. The best results in terms of accuracy were
obtained with patches of 5 × 5 pixels, but patches of
4 × 4 or 6 × 6 pixels were also found to work well. In
the rest of the experiments, the PAF representation is
based on patches of 5 × 5 pixels.
After setting the desired patch size, the focus is to
test different grid densities. Obviously, the best re-
sults in terms of accuracy are obtained when patches
are extracted using an interval of 1 pixel. However,
the goal of adjusting the grid density is to obtain a
desired trade-off between accuracy and speed. Girds
with intervals of 1 to 10 pixels were evaluated. The
results indicate that the accuracy does not drop signif-
icantly when the pixel interval is less than the patch
size. Consequently, a choice was made to extract
patches at every 3 pixels to favor accuracy while sig-
nificantly reducing the size of the PAF representation.
Given that the MNIST images are 28×28 pixels wide,
a grid with a density of 1 pixel generates 165.600 fea-
tures, while a grid with the chosen density of 3 pix-
els generates only 2.016 features, which is roughly 80
times smaller.
The regularization parameter C of SVM was ad-
justed on the same subset of 300 images. The best re-
sults were obtained with C = 100 and, consequently,
the rest of the results are reported using C = 100 for
the SVM.
4.5 Deslanting Digits
A good way of improving the recognition perfor-
mance is to process the images before extracting the
features in order to reduce the amount of pattern vari-
ations within each class. As mentioned in (Teow and
Loe, 2002), a common way of reducing the amount of
variation is by deslanting the individual digit images.
The deslanting method described in (Teow and Loe,
2002) was also adopted in this work and it is briefly
described next. For each image, the least-squares re-
gression line passing through the center of mass of the
pixels is computed in the first step. Then, the image
is skewed with respect to the center of mass, such that
the regression line becomes vertical. Since the skew-
ing techinque may distort the pixels, a slight Gaussian
blur is applied after skewing. A few sample digits be-
fore and after deslanting are presented in Figure 3.
4.6 Experiment on 500 MNIST Images
In this experiment, the PAF representation is com-
pared with the representation based on raw pixel data
PatchAutocorrelationFeaturesforOpticalCharacterRecognition
423

Table 1: Accuracy rates on the subset of 500 images for the
MNIST data set for the PAF representation versus the stan-
dard representation based on raw pixel data. The results
are reported with two different classifiers using the 10-fold
cross validation procedure. The results obtained on the orig-
inal images are shown on the left-hand side and the results
obtained on the deslanted images are shown on the right-
hand side.
Features Method Original Deslanted
Standard 3-NN 85.69% 89.06%
PAF 3-NN 89.96% 91.80%
Standard SVM 85.57% 92.00%
PAF SVM 91.77% 93.62%
using two classifiers. First of all, a 3-NN classifier
based on the PAF representation is compared with
a baseline k-NN classifier. The 3-NN based on the
euclidean distance measure (L
2
-norm) between input
images is the chosen baseline classifier. In (LeCun
et al., 1998) an error rate of 5.00% on the regular test
set with k = 3 for this classifier is reported. Other
studies (Wilder, 1998) report an error rate of 3.09%
on the same experiment. The experiment was recre-
ated in this work, and an error rate of 3.09% was ob-
tained. Second of all, a SVM classifier based on the
PAF representation is compared with a baseline SVM
classifier. All the tests are conducted on both original
and deslanted images.
Table 1 shows the accuracy rates averaged on 10
runs of the 10-fold cross validation procedure. The
reported results indicate that the PAF representation
improves the accuracy rate over the standard repre-
sentation. This improvement can be observed on both
original and deslanted digit images. In the case of
the 3-NN classifier, the results are roughly 3% bet-
ter when using the PAF map. However, the PAF
representation does not equally improve the accuracy
rate of the SVM for original versus deslanted im-
ages. On the original images, the SVM based on
the PAF map is more than 6% better than the base-
line SVM. On the other hand, the SVM based on the
PAF map is only 1.62% better than the baseline SVM
on the deslanted images. Overall, the best accuracy
(93.62%) is obtained by the SVM based on the PAF
map on deslanted images. The empirical results pre-
sented in Table 1 indicate that the Patch Autocorrela-
tion Features provide a better representation for the
digit recognition task. Another observation is that
the deslanting technique shows a similar gain in per-
formance. Together, the PAF representation and the
deslanting technique improve the results even further.
Indeed, the accuracy of the 3-NN model grows from
85.69% to 91.80% by using the PAF representation
on deslanted images. In the same way, the accuracy
of the SVM grows from 85.57% to 93.62%, again by
using the PAF representation on deslanted images.
Table 2: Accuracy rates on the subset of 1000 images for
the MNIST data set for the PAF representation versus the
standard representation based on raw pixel data. The results
are reported with two different classifiers using the 10-fold
cross validation procedure. The results obtained on the orig-
inal images are shown on the left-hand side and the results
obtained on the deslanted images are shown on the right-
hand side.
Features Method Original Deslanted
Standard 3-NN 86.97% 91.60%
PAF 3-NN 90.65% 93.42%
Standard SVM 86.21% 92.34%
PAF SVM 93.88% 95.38%
4.7 Experiment on 1000 MNIST Images
As in the previous experiment, the PAF representa-
tion is compared with the representation based on raw
pixel data using the same two classifiers, namely 3-
NN and SVM. A subset of 1000 images from MNIST
was selected for this experiment. The goal of the ex-
periment is to determine if trends similar to the pre-
vious experiment on 500 images can be observed. If
the PAF representation behaves in a similar way by
improving the accuracy in this experiment, then there
will be more clear evidence that the proposed repre-
sentation works well.
Table 2 shows the accuracy rates averaged on 10
runs of the 10-fold cross validation procedure. Since
there are more images in the training set, the classi-
fiers are able to achieve better accuracy rates than in
the previous experiments. This fact can be immedi-
ately observed by comparing Table 1 and Table 2.
The results reported in Table 2 indicate that the
PAF representation improves the accuracy over the
standard representation. However, the PAF represen-
tation does not equally improve the accuracy rates for
original versus deslanted images. On the original im-
ages, the PAF representation improves the accuracy of
the 3-NN classifier by 3.68% and the accuracy of the
SVM classifier by roughly 7.67%. In the same time,
the PAF representation improves the accuracy of the
3-NN classifier by almost 2% and the accuracy of the
SVM classifier by roughly 3% on the deslanted digit
images. The best accuracy (95.38%) is obtained by
the SVM based on the PAF map on deslanted images.
Judging by the overall results, the same remarks made
in the previous experiment also apply here. First of
all, the empirical results presented in Table 2 show
that the PAF representation is better than the stan-
dard representation for the digit recognition task. Sec-
ond of all, the PAF representation together with the
deslanting technique further improve the results. In
conclusion, there is strong evidence that the Patch Au-
tocorrelation Features proposed in this work provide
VISAPP2015-InternationalConferenceonComputerVisionTheoryandApplications
424

Table 3: Accuracy rates on the full MNIST data set for the
PAF representation versus the standard representation based
on raw pixel data. The results are reported on the official
MNIST test set of 10, 000 images. The results obtained on
the original images are shown on the left-hand side and the
results obtained on the deslanted images are shown on the
right-hand side.
Features Method Original Deslanted
Standard 3-NN 96.91% 98.11%
PAF 3-NN 97.64% 98.42%
Standard SVM 92.24% 94.40%
PAF SVM 98.64% 98.93%
a better representation for the digit recognition task.
4.8 Experiment on the Full MNIST
Data Set
The results presented in the previous two experiments
look promising, but the PAF vector should be tested
on the entire MNIST data set for a strong conclusion
of its performance level. Consequently, the 3-NN and
the SVM classifiers based on the PAF representation
are compared on the full MNIST data set with the 3-
NN and the SVM classifiers based on the feature rep-
resentation given by raw pixels values. The results are
reported in Table 3.
As other studies have reported (Wilder, 1998), an
error rate of 3.09% is obtained by the baseline 3-
NN model based on the euclidean distance. The 3-
NN model based on the PAF representation gives an
error rate of 2.36%, which represents an improve-
ment lower than 1%. The two 3-NN models have
lower error rates on deslanted images, proving that
the deslanting technique is indeed helpful. The base-
line 3-NN shows an improvement of 1.2% on the
deslanted images. The PAF representation brings an
improvement of 0.31% on the deslanted digits. Com-
pared to the results reported in the previous experi-
ments, the PAF representation does not have a great
impact on the performance of the k-NN model. How-
ever, there are significant improvements to the SVM
classifier. The PAF representation improves the ac-
curacy of the SVM classifier by 6.4% on the origi-
nal images, and by 4.53% on the deslanted images.
Overall, the PAF representation seems to have a sig-
nificant positive effect on the performance of the eval-
uated learning methods. The best error rate on the
official MNIST test set is 1.07%. As in the previ-
ous experiments, it is obtained by the SVM based
on Patch Autocorrelation Features. This performance
is similar to those reported by state of the art mod-
els such as Tangent distance (Simard et al., 1996),
boosted stumps (K
´
egl and Busa-Fekete, 2009), or vir-
tual SVMs (DeCoste and Sch
¨
olkopf, 2002). In con-
clusion, the PAF representation can boost the perfor-
mance of the 3-NN or the SVM models up to state of
the art accuracy levels on the handwritten digit recog-
nition task.
5 CONCLUSION
This work proposed a feature representation inspired
from the autocorrelation which has applications in
various fields including image processing. The pro-
posed representation is termed Patch Autocorrelation
Features. The approach proposed in this paper ex-
tracts patches by applying a grid over the image, then
it records the similarities between all pairs of patches
in a vector, also referred to as the PAF representation.
Several handwritten digit recognition experiments
were conducted on the popular MNIST data set. In
the experiments, the k-NN and the SVM classifiers
based on the PAF representation were compared with
benchmark k-NN and SVM models. In all the experi-
ments, the PAF representation improved the accuracy
rate of the learning methods, a fact that indicates that
the Patch Autocorrelation Features provide a robust
and consistent approach of boosting the recognition
performance with almost no extra time required.
In future work, the proposed representation can
be applied to other classification tasks such as ob-
ject recognition or texture classification. Finding new
applications also means that the PAF representation
needs to be modified in order to become invariant to
affine transformations, which currently represents a
disadvantage of the proposed method.
ACKNOWLEDGEMENTS
Andreea-Lavinia Popescu has been funded by the
Sectoral Operational Programme Human Resources
Development 2007-2013 of the Ministry of Euro-
pean Funds through the Financial Agreement POS-
DRU/159/1.5/S/134398.
REFERENCES
Agarwal, S. and Roth, D. (2002). Learning a Sparse Repre-
sentation for Object Detection. Proceedings of ECCV,
pages 113–127.
Barnes, C., Goldman, D. B., Shechtman, E., and Finkel-
stein, A. (2011). The PatchMatch Randomized Match-
ing Algorithm for Image Manipulation. Communica-
tions of the ACM, 54(11):103–110.
PatchAutocorrelationFeaturesforOpticalCharacterRecognition
425

Belongie, S., Malik, J., and Puzicha, J. (2002). Shape
matching and object recognition using shape contexts.
IEEE Transactions on Pattern Analysis and Machine
Intelligence, 24(4):509–522.
Brochard, J., Khoudeir, M., and Augereau, B. (2001). In-
variant feature extraction for 3D texture analysis using
the autocorrelation function. Pattern Recognition Let-
ters, 22(6-7):759–768.
Cho, T. S., Avidan, S., and Freeman, W. T. (2010). The
patch transform. PAMI, 32(8):1489–1501.
Ciresan, D. C., Meier, U., and Schmidhuber, J. (2012).
Multi-column Deep Neural Networks for Image Clas-
sification. Proceedings of CVPR, pages 3642–3649.
Cortes, C. and Vapnik, V. (1995). Support-Vector Networks.
Machine Learning, 20(3):273–297.
DeCoste, D. and Sch
¨
olkopf, B. (2002). Training Invariant
Support Vector Machines. Machine Learning, 46(1–
3):161–190.
Deselaers, T., Keyser, D., and Ney, H. (2005). Discrim-
inative Training for Object Recognition using Image
Patches. Proceedings of CVPR, pages 157–162.
Dinu, L. P., Ionescu, R., and Popescu, M. (2012). Lo-
cal Patch Dissimilarity for Images. Proceedings of
ICONIP, 7663:117–126.
Efros, A. A. and Freeman, W. T. (2001). Image quilting for
texture synthesis and transfer. Proceedings of SIG-
GRAPH ’01, pages 341–346.
Guo, G. and Dyer, C. R. (2007). Patch-based Image Corre-
lation with Rapid Filtering. Proceedings of CVPR.
Horikawa, Y. (2004). Use of Autocorrelation Kernels in
Kernel Canonical Correlation Analysis for Texture
Classification. Proceedings of ICONIP, 3316:1235–
1240.
Horikawa-2004 (2004). Comparison of support vector ma-
chines with autocorrelation kernels for invariant tex-
ture classification. Proceedings of ICPR, 1:660–663.
Ionescu, R. T. and Popescu, M. (2014). PQ kernel: a rank
correlation kernel for visual word histograms. Pattern
Recognition Letters.
K
´
egl, B. and Busa-Fekete, R. (2009). Boosting Products of
Base Classifiers. Proceedings of ICML, pages 497–
504.
Keysers, D., Deselaers, T., Gollan, C., and Ney, H. (2007).
Deformation Models for Image Recognition. IEEE
Transactions on Pattern Analysis and Machine Intel-
ligence, 29(8):1422–1435.
LeCun, Y., Bottou, L., Bengio, Y., and Haffner, P. (1998).
Gradient-based learning applied to document recogni-
tion. Proceedings of the IEEE, 86(11):2278–2324.
LeCun, Y., Jackel, L. D., Boser, B., Denker, J. S., Graf,
H. P., Guyon, I., Henderson, D., Howard, R. E., and
Hubbard, W. (1989). Handwritten digit recognition:
Applications of neural net chips and automatic learn-
ing. IEEE Communications, pages 41–46.
Paredes, R., Prez-Cortes, J., Juan, A., and Vidal, E. (2001).
Local Representations and a Direct Voting Scheme for
Face Recognition. Proceedings of Workshop on Pat-
tern Recognition in Information Systems, pages 71–
79.
Popovici, V. and Thiran, J. (2001). Higher order autocorre-
lations for pattern classification. Proceedings of ICIP,
3:724–727.
Simard, P., LeCun, Y., Denker, J. S., and Victorri, B.
(1996). Transformation Invariance in Pattern Recog-
nition, Tangent Distance and Tangent Propagation.
Neural Networks: Tricks of the Trade.
Srihari, S. N. (1992). High-performance reading machines.
Proceedings of the IEEE (Special issue on Optical
Character Recognition), 80(7):1120–1132.
Suen, C. Y., Nadal, C., Legault, R., Mai, T. A., and Lam, L.
(1992). Computer recognition of unconstrained hand-
written numerals. Proceedings of the IEEE (Special
issue on Optical Character Recognition), 80(7):1162–
1180.
Teow, L.-N. and Loe, K.-F. (2002). Robust vision-
based features and classification schemes for off-line
handwritten digit recognition. Pattern Recognition,
35(11):2355–2364.
Toyoda, T. and Hasegawa, O. (2007). Extension of higher
order local autocorrelation features. Pattern Recogni-
tion, 40(5):1466–1473.
Wilder, K. J. (1998). Decision tree algorithms for hand-
written digit recognition. Electronic Doctoral Disser-
tations for UMass Amherst.
VISAPP2015-InternationalConferenceonComputerVisionTheoryandApplications
426
