
Saliency Detection based on Depth and Sparse Features
Gangbiao Chen and Chun Yuan
Tsinghua University, Shenzhen 518000, China
Keywords: Saliency Detection, Sparse Coding, Depth Information, Centre Shift, Human Visual Acuity.
Abstract: In this paper, we modified the region-based Human Visual System (HVS) model by import two features,
sparse feature and depth feature. The input image is firstly divided into small regions. Then the contrast,
sparse and depth feature of each region are extracted. We calculate the center-surround feature differences
for saliency detection. In this step, the center shift method is adopted. In the weighting step, the human
visual acuity is adopted. Compared with the existing related algorithms, experimental results on a large
public database show that the modified method works better and can obtain a more accurate result.
1 INTRODUCTION
Humans often pay attention to some important parts
when they see an image at first glance. These
important parts are called salient regions in
computer visual systems. Researchers want to
develop models to detect such regions in an image.
These models are called saliency detection models,
which is widely used in many computer vision
applications such as image segmentation, object
recognition, adaptive compression of images, image
retrieval and so on.
In the last few years, various methods have been
suggested for saliency detection based on the
features of human visual system (HVS), which help
us extract a saliency map (SM) from a given input
image (Liu et al., 2011). Typically, lots of saliency
detection models try to extract saliency maps based
on mathematical or statistical principles (Hou and
Zhang, 2007). These principles mainly come from
neurology research, information theory and
statistical analysis (Achanta et al., 2008). Most of
the state-of-the-art models compute visual saliency
by dividing the image into blocks or regions
(Achanta and Susstrunk, 2009). These methods work
well as they obtain the dissimilarity between
different blocks or regions by computing global
contrast score, measured by the region’s contrast and
spatial distances to other regions in the image. These
distances often weight up dissimilarity of center
block and surround blocks to get saliency values,
which correspond to the HVS.
To improve the performance of saliency
detection, we introduce two novel visual features
into our framework, sparse feature and depth feature.
Recently, the sparse representation of images is
widely used in HVS algorithm. The sparse coding
has been proved to be an efficient coding strategy in
the primary visual cortex. We can get the
independent sparse feature for images by utilizing
such image representation. Models which utilize
such sparse features to represent image patches for
the calculation of center-surrounding differences are
proved effectively.
It is known from theories of cognitive science
that different regions of an image are sensed in
different degree by HVS, the object will draw
attention more easily if it is closer to the observer.
Since the depth information is an important factor in
human vision perception (Xiaoyi, 2009), we can
expect to enhance the performance of saliency
detection by extracting the depth feature of an
image.
In essence, the model we proposed firstly divides
the input image into small image regions as a
famous method which is called region-based
contrast (RC (Cheng et al., 2011)) does. Then the
features (include contrast, sparse and depth) for each
image region are extracted. Based on the extracted
features, the center-surround differences are
calculated. Then the differences of center and
surround blocks are weighted to get the salient value
of one feature. The final saliency map is obtained by
combining the values of different features together.
Different from the state-of the-art model which
441
Chen G. and Yuan C..
Saliency Detection based on Depth and Sparse Features.
DOI: 10.5220/0005292604410446
In Proceedings of the 10th International Conference on Computer Vision Theory and Applications (VISAPP-2015), pages 441-446
ISBN: 978-989-758-089-5
Copyright
c
2015 SCITEPRESS (Science and Technology Publications, Lda.)

regards the center of an image as the center of visual
field and calculates the Euclidean distance to weight
the center-surround differences, in our work, we
apply center shift (Rahtu et al., 2010) to modify the
center of visual and we apply a new method which is
inspired by human visual acuity to weigh up the
center-surround differences.
It is generally believed that the HVS is highly
space-variant in processing visual information for
the reason that the retina in the human eye has
different density of cone photoreceptor and ganglion
cells. There is the highest density of cone receptors
in the fovea of retina and thus the fixed region is
perceived at the highest resolution. With greater
retinal eccentricity from the fixed region, the density
of the cone receptors becomes lower and thus visual
acuity decreases. We propose to incorporate these
characteristics of the HVS into the proposed saliency
detection model. In this study, the human visual
acuity is used to weight the center-surround feature
differences for the saliency calculation.
2 RELATED WORK
Itti et al. proposed a visual attention model based on
the behaviour and the neuronal architecture of the
primates’ early visual system (Itti et al., 1998).
Based on Itti’s model, Harel et al. devised a Graph-
based Visual Saliency model through utilizing a
better dissimilarity measure for saliency (Harel et
al., 2006). Gao et al. calculated the saliency value
through a defined center-surround discriminant (Gao
and Vasconcelos, 2007). Another type of saliency
detection algorithms tries to obtain the saliency map
for images from the transform domain. Hou et al.
built a saliency detection model based on the
concept of Spectral Residual (Hou and Zhang, 2007).
Guo et al. designed a phase-based saliency detection
model based on Fourier Transform (Guo et al.,
2008). Murray et al. proposed a saliency detection
model by using Inverse Wavelet Transform on the
multi-scale features (Murray et al., 2011). Wang et
al. defined the Site Entropy Rate to measure the
saliency for images (Wang et al., 2010). Cheng et al.
proposed histogram-based contrast and regions-
based contrast model (Cheng et al., 2011), which is
proved to be one of the most effective methods.
Most of the above models mainly include two
parts, feature extract and saliency computation. At
the first part, features such as intensity, colour,
orientation, texture and motion are extracted from
the image. At the second stage, the center-surround
differences are calculated and the saliency map(SM)
is obtained by fusing the center-surround
differences. After normalization, the final SM of the
image is represented. Some of the above studies
consider the local contrast, while others focus on the
global contrast. They consider the saliency in
different directions. And the methods to weight the
salient value of these features in these studies are
different. Some models utilize the Euclidean
distances between the center region and the
surrounding regions, while others use the Gaussian
distribution of the Euclidean distances between the
center region and the surrounding regions.
If a mixture of more different features is
imported, the saliency detection will be more
comprehensive. When we see an image at the first
sight, we often notice the center of the image but
rapidly the attention will be catch by the salient
region, so the visual center is no more the center of
the image. Otherwise, in these existing studies, the
weighting methods of the center-surround
differences are not justified from the aspect of the
characteristics or theories of the HVS. And the
feature in most models is not comprehensive.
In this paper, we propose to use sparse coding
and depth information in the saliency detection to
tackle the drawbacks of the existing models
discussed above. Then revise the visual center in the
calculating the center-surround differences of
divided regions by the center shift step. And then
weight the differences of these regions by making
use of the human visual acuity. Then combine the
salient value together to get the final SM.
Experiments show that the result of our method has
a good performance.
3 THE PROPOSED APPROACH
The proposed approach is based on RC, which is
proposed by Cheng et al. We give three
modifications in RC saliency detection model. In
this section, first we present some important details
in RC, and then present the details of our
modifications.
In RC model, a widely used probabilistic model
in HVS is applied. The probabilistic model is a
feature-based visual saliency method.
A saliency detection process can be partitioned
into two steps, the primary stage and the advanced
stage. In the primary stage, the salient value is
calculated according to center-surround theory. In
the advanced stage, the saliency information is
filtered and optimized according to the gestalt theory.
The approach proposed in this paper get the
VISAPP2015-InternationalConferenceonComputerVisionTheoryandApplications
442

improvement in the primary stage. We introduce two
new features and then simulate a shifting process of
the center of an image, which is called center shift.
Then weight the center-surround differences
according to the concept of human visual acuity.
First, we present the probabilistic model in our
approach.
3.1 The Probabilistic Model
HVS always instinctively pays attention to the most
salient parts of an image, which are obtained by
estimating the salient value of regions at every pixel.
To measure the importance of every pixel, the
probabilistic model is proposed by calculating the
probability of a region to obtain the salient value.
First we divide an image into a set of regions
{R
1
, R
2
... R
n
}, where n is the total number of the
divided regions, which are segmented by a graph-
based image segmentation algorithm. The
segmentation algorithm is widely used in many
state-of-the-art HSV models. For each region R
i
, a
saliency value S
i
is estimated, and all of the values
corresponding to different regions compose the
whole image saliency map. Suppose that a random
variable T
i
denotes that region R
i
is salient, and Fi
denotes the visual features results in the visual
saliency value S
i
. Furthermore, Si could be a
conditional probability of T
i
given F
i
, that is:
S
i
=P (T
i
| F
i
)
3.2 Features
3.2.1 Depth Feature
In RC, contrast features such as intensity, colour and
orientation are extracted by using Gaussian
pyramids and center-surround operator. The details
as follow:
Suppose r is the red channel, g is green channel,
b is blue channel of an image I at scale (of the
Gaussian pyramids) σ (σ= [0, 1, 2…8]). Separately,
we use M
i
(σ), M
c
(σ) and M
o
(σ)to stand for the
intensity map, colour map, and orientation map.
The intensity feature is defined:
M
/3
The formula is the same in different scales of the
input Gaussian pyramids when we calculate M
i
(σ) to
obtain the intensity map.
The colour map can be divided into two parts,
the red–green (RG) map and the blue–yellow (BY)
map. We can obtain the M
rg
(σ) and M
by
(σ)
respectively as follow:
σ
rg
max,,
σ
bminr,g
max,,
M
o
(σ) can be obtained by the formula:
σ
‖
σ∗
θ
‖
σ∗
/
θ
Where G
o
(θ) is Gabor operator, θ is the parameter
of intensity, θ= {0
°
,45
°
,90
°
,135
°
} .
As discussed above, the depth information and
sparse coding play an important role in HVS, but
they are not considered in previous methods. So
these two new visual features are both extracted in
our work to make the detection results more
accurate.
We consider the contact of depth information
and saliency. HVS usually pay attention to the
regions next to the observer. Suppose the closer
pixel has a lower depth (Rahtu et al., 2010) then it
has a higher salient value at pixel which has a lower
depth. So we can define the depth feature as follow:
D=λ
exp
λ
max,
Where max (deep(x,y)) is the maximum depth value
in the image. When we try to get depth feature of
every region in our model, the salient value is the
maximum depth value of the present region. As one
salient object should have the same depth in HSV,
we take the maximum depth of this region as the
depth of the whole area. Here λ
and λ
are the
parameter, which are used to adjust the difference of
the image depth, and which is often determined by
experience.
3.2.2 Sparse Feature
Previous studies have shown that the sparse coding
category can simulate the properties of simple cells
of receptive field in the primary visual cortex
(Yangs et al., 2013). In these studies, images can be
represented by a linear superposition of a basis
function group and these functions are used to
maximize sparse representation of the image. On
random conditions, these basis functions are
obtained through training a large number of images.
These learned sparse basis functions strongly
resemble the receptive field properties found in the
primary visual cortex. For an input image I, the
sparse features f
i
can be described as its response to
the bank of filter functions W
i
.
W
I
SaliencyDetectionbasedonDepthandSparseFeatures
443

The sparse coding strategy tries to find an optimal
invertible weighting matrix W so that the images I
can be represented by sparse features. Generally, this
weighting matrix can be obtained by Independent
Component Analysis (ICA). With the linear
transform of images, the ICA algorithms decompose
images into independent components by learning
(Hyvarinen, 1999). These independents are called
sparse coding basis. Then, an image can be
represented by a linear combination of a group of
sparse coding basis. An alternative way on how to
represent an image I of Formula (1) is as follows.
I=∑ f
i
A
i
Where f
i
[i=1, 2…n] is the sparse feature for images
as in this formula, and n is the total number of the
basis. For the image I, f
i
is the coefficients of the
sparse coding basis A
i
. We can obtain W
i
by the next
formula:
W
i
= A
i
-1
At present, many ICA algorithms have been
proposed to extract the sparse coding basis for
signals. In this paper, we use a robust ICA algorithm
to learn a set of sparse coding basis on the base of
over 18,000 natural image patches. We choose the
first 64 basis of the total 192 basis to make the set.
This set of sparse coding basis is used to generate
the sparse features for image patches in the proposed
saliency detection model.
3.2.3 Center Shift
According to the distribution regularities of the
image features, the focus will shifted from the image
center to other position when we searching a salient
object. By simulating the shifting process of HVS,
we notice that that the center of the visual field plays
an important role in saliency detection. We call this
shifting process center shift. When we search for a
salient region in any region of the visual field, we
first pay attention to the center of the image and then
our attention is rapidly attracted by distinctive
regions with distinctive features (colour, texture and
so on). So the center of visual field shifts toward the
distinctive regions. Compared to the initial center,
we prefer to take the shifted center as a salient
center. Suppose the coordinates of the initial center
is:
x
,y
W
2
,
H
2
Where W is the width of the image and H is the
height. Then we can get an initial SM by utilizing
the initial center. Take the intensity center of this
SM as shift center, which is calculated as follow:
x
,y
m
m
,
m
m
In the above formula, m
,m
,m
can be
determined according to the formula below:
m
,
,
Where , is the pixel value at (x,y) of the initial
SM obtained in the last step. Then we take the
intensity center
x
,y
as the shifted center and
generate a new SM according to the original method.
The whole process above is called center shift.
3.2.4 Human Visual Acuity
A It is proved that the human visual acuity (HVA)
can be measured by a function of the retinal
eccentricity (Fang et al., 2013). According to the
experimental results of exiting studies, the contrast
threshold can be represented as a function of the
spatial frequency and retinal eccentricity as follows:
T
f,e
T
exp
Where f is the spatial frequency, e is the retinal
eccentricity, T
is the minimum contrast threshold,
is the spatial frequency decay constant and
is the
half resolution eccentricity. According to the
experimental results, we set these parameters as
follows: T
1/64, 0.1,
2.32. Then
HVA can be represented as follows:
C
f,e
1
T
f,e
In the model proposed in this paper, HVA is used as
a method to weight up the center-surround
differences of the divided regions of the image.
In this paper, the salient value of each region is
calculated by weighing the center-surround
differences of the target region. As to the input patch
p of the image, the salient value is obtained by the
following formula:
S
Cf,e
D
Where e
is the retinal eccentricity of region q
which is one of the surrounded regions when we
take p as the center region
is the center-surround
difference of p and q.
According to the theory of retinal eccentricity,
the retinal eccentricity is higher in center region than
the surround regions. So the method can meet the
VISAPP2015-InternationalConferenceonComputerVisionTheoryandApplications
444
fact that a patch is salient if the neighbouring
patches have a greater difference than that of the
remote ones. This fact can better match the
properties of HSV because the remote regions make
less contribution (Han and Vasconcelos, 2010).
In the above formula, Cf,e
is obtained. And
can be calculated as follows:
D
|
|
Where
is the feature value at patch p. The
features include contrast, depth and sparse we
mentions above. The result is provided in the next
chapter.
4 EXPERIMENTAL RESULTS
We evaluated the proposed method on a big publicly
available dataset (Achanta et al., 2009).
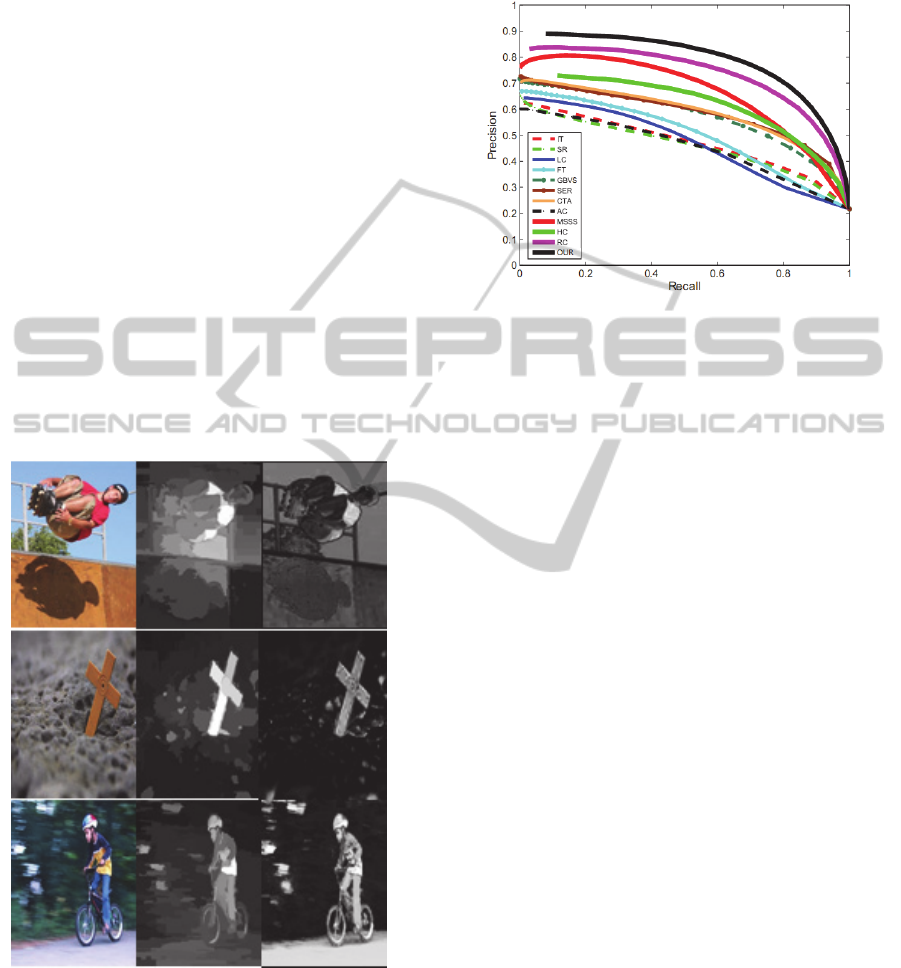
Fig. 1 represents the saliency detection result of
the proposed method.
Figure 1: Result of saliency detection.
The left images are original images, the middle
ones are the results in RC, and the left ones are in
our method. According to the result, compared with
RC, the modified model is more effective and has a
higher accuracy on saliency detection.
Fig. 2 represents the precision-recall cues of
some methods of the state of the art and the
proposed method:
Figure 2: Precision-recall cues.
From the cues, we can see that compared with
state-of-the-art saliency detection methods, our
method has higher precision ratio and recall ratio, so
our method is more effective.
5 CONCLUSIONS
In this paper, three modifications are brought into
the region-based saliency detection model. First, two
kinds of visual features, sparse coding and depth
information, are introduced in SM computation to
make the detection results more similar to that of
human vision perception. Second, the center shift is
utilized to revise the center of visual. Third, the
human visual acuity is utilized to weight differences
of these regions. Compared with the existing related
algorithms, experimental results on a large public
database show that the modified method works
better and can obtain a more accurate result.
REFERENCES
Cheng M. M., Zhang G. X., Mitra N. J., et al. Global
contrast based salient region detection[C]//Computer
Vision and Pattern Recognition (CVPR), 2011 IEEE
Conference on. IEEE, 2011: 409-416.
Fang Y., Lin W., Chen Z., et al. A saliency detection
model based on sparse features and visual
acuity[C]//Circuits and Systems (ISCAS), 2013 IEEE
International Symposium on. IEEE, 2013: 2888-2891.
Xiaoyi F. Regions of interest detection with edge and
depth information[C]//Industrial Electronics and
Applications, 2009. ICIEA 2009. 4th IEEE Conference
on. IEEE, 2009: 3028-3031.
SaliencyDetectionbasedonDepthandSparseFeatures
445

Yang W., Tang Y. Y., Fang B., et al. Visual saliency
detection with center shift [J]. Neurocomputing, 2013,
103: 63-74.
R. Achanta, S. Hemami, F. Estrada, and S. Susstrunk.
Frequency-tuned salient region detection. In CVPR,
page1597-1604, 2009.
Walther D., Koch C. Modeling attention to salient proto-
objects[J]. Neural Networks, 2006, 19(9): 1395-1407.
Goferman S., Zelnik-Manor L., Tal A. Context-aware
saliency detection [J]. Pattern Analysis and Machine
Intelligence, IEEE Transactions on, 2012, 34(10):
1915-1926.
Bruce N. D. B., Tsotsos J K. Saliency, attention, and
visual search: An information theoretic approach [J].
Journal of vision, 2009, 9(3): 5.
Xue Y., Liu Z., Shi R. Saliency detection using multiple
region-based features [J]. Optical Engineering, 2011,
50(5): 057008-057008-9.
Liu T., Yuan Z, Sun J., et al. Learning to detect a salient
object [J]. Pattern Analysis and Machine Intelligence,
IEEE Transactions on, 2011, 33(2): 353-367.
Rahtu E., Kannala J., Salo M., et al. Segmenting salient
objects from images and videos [M]//Computer
Vision–ECCV 2010. Springer Berlin Heidelberg, 2010:
366-379.
Li H, Xu L, Liu G. Two-layer average-to-peak ratio based
saliency detection[J]. Signal Processing: Image
Communication, 2013, 28(1): 55-68.
Ge S. S, He H, Zhang Z. Bottom-up saliency detection for
attention determination[J]. Machine vision and
applications, 2013, 24(1): 103-116.
Chen Z, Yuan J, Tan Y P. Hybrid saliency detection for
images[J]. Signal Processing Letters, IEEE, 2013,
20(1): 95-98.
Ren Z., Gao S., Chia L., et al. Regularized Feature
Reconstruction for Spatio-temporal Saliency
Detection[J]. 2013.
Ke Y., Sukthankar R., Hebert M. Efficient temporal mean
shift for activity recognition in video[C]//19th Annual
Conference on Neural Information Processing Systems
Workshop on Activity Recognition and Discovery,
Whistler, Canada. 2005.
Zhang H., Lei J., Fan X., et al. Depth combined saliency
detection based on region contrast
model[C]//Computer Science & Education (ICCSE),
2012 7th International Conference on. IEEE, 2012:
763-766.
Cong L., Tong R. F., Bao D. Y. Detect saliency to
understand a photo[C]//Multimedia Technology
(ICMT), 2011 International Conference on. IEEE,
2011: 286-289.
Han J., He S., Qian X., et al. An object-oriented visual
saliency detection framework based on sparse coding
representations [J]. 2013.
Han B., Zhu H., Ding Y. Bottom-up saliency based on
weighted sparse coding residual[C]//Proceedings of
the 19th ACM international conference on
Multimedia. ACM, 2011: 1117-1120.
Yangs J., Lin T., Jin X. An Image Sparse Representation
for Saliency Detection [J]. TELKOMNIKA Indonesian
Journal of Electrical Engineering, 2013, 11(10):
6143-6150.
Han S., Vasconcelos N. Biologically plausible saliency
mechanisms improve feedforward object recognition
[J]. Vision research, 2010, 50(22): 2295-2307.
Liu H., Heynderickx I. Visual attention in objective image
quality assessment: based on eye-tracking data [J].
Circuits and Systems for Video Technology, IEEE
Transactions on, 2011, 21(7): 971-982.
Culibrk D., Mirkovic M., Zlokolica V., et al. Salient
motion features for video quality assessment [J].
Image Processing, IEEE Transactions on, 2011, 20(4):
948-958.
Wang Q., Chen F., Xu W. Saliency selection for robust
visual tracking[C]//Image Processing (ICIP), 2010
17th IEEE International Conference on. IEEE, 2010:
2785-2788.
Harel J., Koch C, Perona P. Graph-based visual saliency
[J]. Advances in neural information processing
systems, 2007, 19: 545.
Gao D., Vasconcelos N. Bottom-up saliency is a
discriminant process[C]//Computer Vision, 2007.
ICCV 2007. IEEE 11th International Conference on.
IEEE, 2007: 1-6.
Hou X., Zhang L. Saliency detection: A spectral residual
approach[C]//Computer Vision and Pattern
Recognition, 2007. CVPR'07. IEEE Conference on.
IEEE, 2007: 1-8.
Hyvarinen A. Fast and robust fixed-point algorithms for
independent component analysis [J]. Neural Networks,
IEEE Transactions on, 1999, 10(3): 626-634.
Achanta R., Estrada F, Wils P, et al. Salient region
detection and segmentation[M]//Computer Vision
Systems. Springer Berlin Heidelberg, 2008: 66-75.
Achanta R., Susstrunk S. Saliency detection for content-
aware image resizing[C]//Image Processing (ICIP),
2009 16th IEEE International Conference on. IEEE,
2009: 1005-1008.
L. Itti, C. Koch and E. mNiebur. A model of saliency-
based visual attention for rapid scene analysis. IEEE
T-PAMI, 20(11): 1254-1259, 1998.
J. Harel, C. Koch and P. Perona. Garph-based visual
saliency. NIPS, 2006.
D. Gao and N. Vasconcelos. Bottom-up saliency is a
discriminant process. IEEE ICCV, 2007.
C. Guo, Q. Ma and L. Zhang. Spatio-temporal saliency
detection using phase spectrum of quaternion fourier
transform. IEEE CVPR, 2008.
N. Murray, M. Vanrell, X. Otazu, and C.A.Parraga.
Saliency estimation using a non-parametric low-level
vision model. IEEE CVPR, 2011.
W. Wang, Y. Wang, Q. Huang, and W. Gao. Measuring
visual saliency by site entropy rate. IEEE CVPR, 2010.
VISAPP2015-InternationalConferenceonComputerVisionTheoryandApplications
446
