
Detection and Characterization of the Sclera
Evaluation of Eye Gestural Reactions to Auditory Stimuli
Alba Fern
´
andez, Joaquim de Moura, Marcos Ortega and Manuel G. Penedo
Departamento de Computaci
´
on, Universidade da Coru
˜
na, A Coru
˜
na, Spain
Keywords:
Hearing Assessment, Audiometry, Eye Gestural Reactions, Gaze Movement.
Abstract:
Hearing assessment becomes a challenge for the audiologists when there are severe difficulties in the commu-
nication with the patient. This methodology is aimed at facilitating the audiological evaluation of the patient
when cognitive decline, or other communication disorders, complicate the necessary interaction between pa-
tient and audiologist for the proper development of the test. In these cases, the audiologist must focus his
attention on the detection of spontaneous and unconscious reactions that tend to occur in the eye region of
the patient, expressed in most cases as changes in the gaze direction. In this paper, the tracking of the gaze
direction is addressed by the study of the sclera, the white area of the eye. The movement is identified and
characterized in order to determine whether or not a positive reaction to the auditory stimuli has occurred, so
the hearing of the patients can be correctly assessed.
1 INTRODUCTION
Hearing loss is the third most prevalent chronic health
condition facing older adults (Collins, 1997). The
standard test for the clinical evaluation of hearing
loss is the audiometry (Davis, 1989), a behavioral test
where the hearing thresholds of the patient are eval-
uated in order to diagnose his or her hearing capac-
ity. Since this evaluation is a behavioral test, it re-
quires a high interaction and understanding between
patient and audiologist. This need of communication
is what causes serious difficulties when the patients
suffer from cognitive decline or other communication
difficulties. A typical interaction is not possible with
this particular group of patients, instead, audiologists
argue that there are some unconscious and sponta-
neous reactions that may correspond with involuntary
signs of perception. These spontaneous reactions are
gestural reactions that, in most cases, are expressed
in the eye region. Changes in the gaze direction or an
exaggerated eye opening might be interpreted as signs
of perception of the auditory stimulus.
The detection and interpretation of these gestural
reactions requires broad experience from the audiolo-
gist. Besides, since the audiologist may pay attention
to the handling of the audiometer while he is trying to
detect these gestural reactions to the stimuli, the eval-
uation requires a high degree of concentration by the
expert and it is very prone to errors.
All these circumstances highlight the need for an
automatic tool which support the audiologist in the
evaluation of patients with cognitive decline. This
method must be focused on the eye region in order
to detect eye gestural reactions to the sound. To that
end, in this proposal we are going to analyze the eye
movements using color information from the sclera,
the white area in the eye. The relation between the
location of the iris and the white distribution of the
sclera allows to determinate the gaze direction. This
relation must be identified and characterized in order
to determine if a movement has occurred as a reaction
to the auditory stimulus. This is why, the method-
ology will enable the proper assessment of patients
when no interaction is possible.
An alternative solution was proposed in (Fernan-
dez et al., 2013), where the analysis of the eye move-
ments is addressed by the use of the optical flow in
order to detect the movement occurred between two
consecutive images. In this case, we propose the
analysis of the eye movements by the analysis of the
sclera, since the information provided by this area
could be as good as the previous alternative.
In the literature, we can find different approaches
that use information about eye movements with dif-
ferent aims. For example, in (Coetzer and Hancke,
2011) a system for monitoring drivers fatigue was
proposed. In (Buscher et al., 2009) the tracking of eye
movements is used in order to study the visual behav-
313
Fernández A., de Moura J., Ortega M. and Penedo M..
Detection and Characterization of the Sclera - Evaluation of Eye Gestural Reactions to Auditory Stimuli.
DOI: 10.5220/0005295603130320
In Proceedings of the 10th International Conference on Computer Vision Theory and Applications (VISAPP-2015), pages 313-320
ISBN: 978-989-758-090-1
Copyright
c
2015 SCITEPRESS (Science and Technology Publications, Lda.)
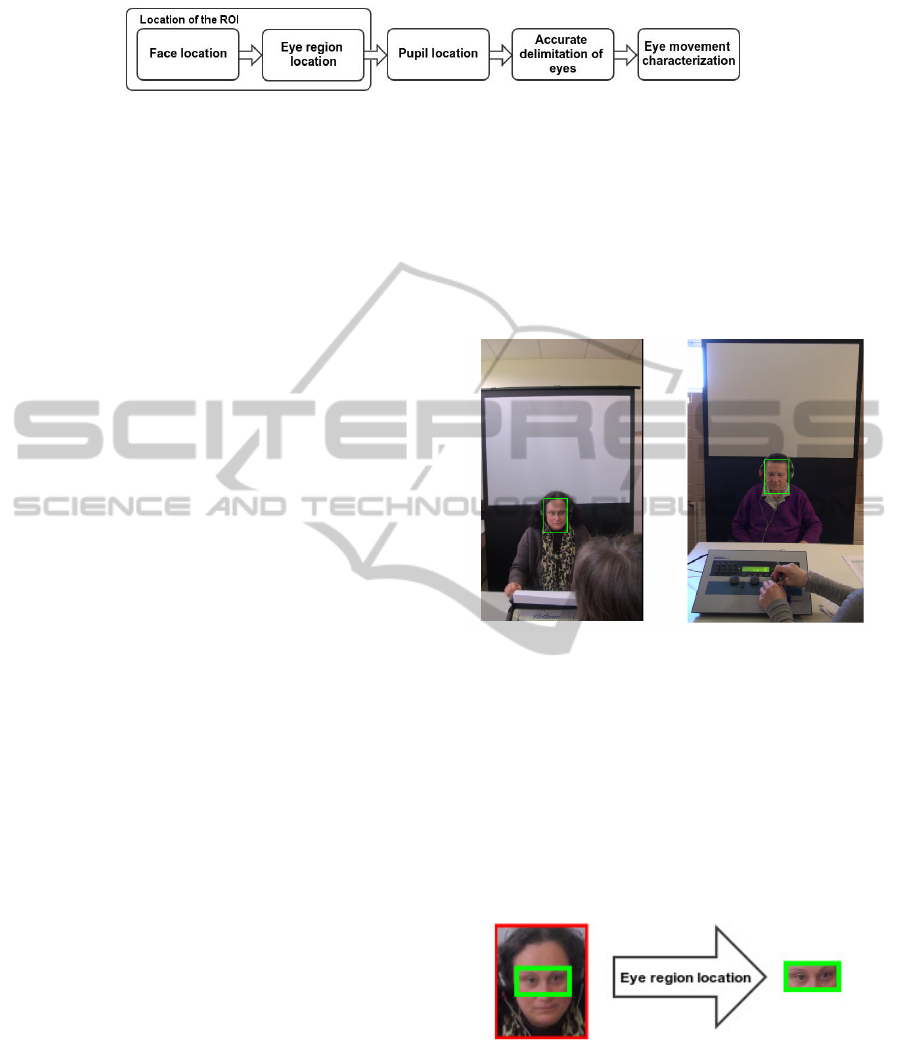
Figure 1: Steps of the methodology.
ior of the user while he is browsing the Internet. A
similar aim was proposed in (Yu et al., 2013) where
the eye tracking was analyzed while reading poetry,
this survey allows the researchers to infer information
about how the cognitive and lexical processing affect
reading and learning.
Since we are trying to detect eye movements as-
sociated to unconscious reactions, it is important to
note that each patient may react differently, and even
the same patient may show different reactions dur-
ing the same evaluation. For this reason, we decided
to propose a novel methodology for the eye tracking
which allow the best possible adaptation to the partic-
ular characteristics of our domain.
This paper is organized as follows: Section 2 is
devoted to the description of the methodology. Ex-
perimental results are included in Section 3. Finally,
Section 4 provides some discussion and conclusions.
2 METHODOLOGY
As depicted in the Introduction, the development of
an automatic solution capable of analyzing the eye
movements and detecting gestural reactions to the
stimuli would be very helpful for the hearing assess-
ment of patients with cognitive decline. This auto-
matic solution will receive as input a video sequence
recorded during the development of the hearing as-
sessment, and it is going to be analyzed frame by
frame.
The proposed methodology is divided into the five
main stages represented in Fig. 1. In the first one, we
locate the face within the complete image received as
input, after that, within the face region we locate the
eye region. In the third step, we obtain the location
of the pupils’ centers. Then, we locate the corners
of each one of the eyes, and finally, we characterize
and classify the eye position using color information
about the sclera. Each one of these steps is going to
be discussed next.
2.1 Location of the ROI
Proper face location reduces the computational cost
of the next step of the methodology and make it less
error prone.
At this point, a frame of the video sequence is re-
ceived as input. To locate the face, due to the stabil-
ity of the domain and the certainty that the face will
always be in frontal position, the Viola-Jones object
detector (Viola and Jones, 2001) is applied, using an
optimized cascade for the detection of faces in frontal
position. A couple of samples of face detection can
be seen in Fig. 2.
Figure 2: Face detection samples.
Once the search area has been limited to the face
region, we need to locate now the eye region within
this area. At this step, the Viola-Jones object detec-
tor is applied again, but in this case, using a cascade
specifically trained for this domain. More than 1000
images of the eye area were manually selected for the
training, obtaining an accuracy of the 98% for the eye
region detection even when the eyes are closed. Fig.
3 shows the results of this step of the methodology.
Figure 3: Eye region detection sample.
2.2 Pupil Location
After the location of the eye region, this step is aimed
at the location of the pupil. The aim is to obtain the
location of the pupil’s center so we can use this loca-
tion as a reference point in the subsequent steps of the
VISAPP2015-InternationalConferenceonComputerVisionTheoryandApplications
314
methodology. To achieve this step a method based in
gradients (Timm and Barth, 2011) was applied. Yel-
low points in Fig. 4 show the results obtained with the
proposed method.
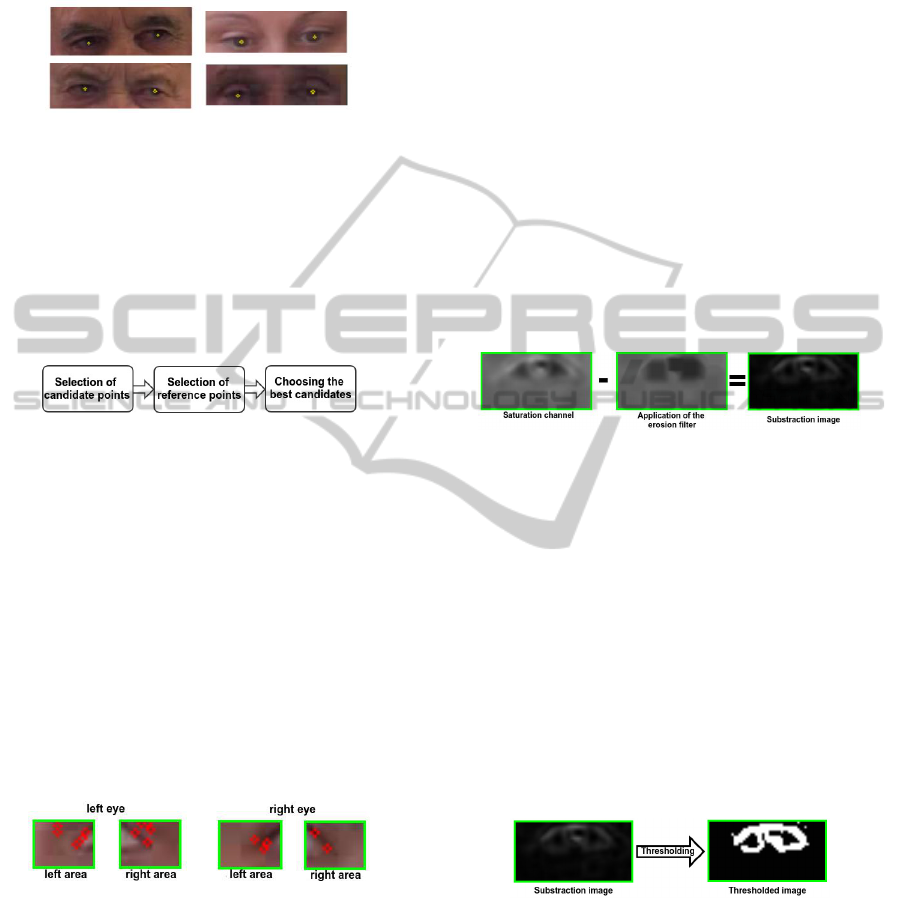
Figure 4: Yellow points represent the center of the pupil
obtained at this step.
2.3 Accurate Delimitation of Eyes
The fourth step of the methodology aims to locate the
eyes’ corners. Using as information the eye region
and the pupil location obtained in previous steps, we
designed a method consisting of three phases (see Fig.
5).
Figure 5: Phases of the delimitation of the eyes stage.
2.3.1 Phase 1: Selection of Candidate Points
First, we are going to detect points that can be con-
sidered as candidates to be the eyes’ corners. In or-
der to facilitate this detection, four areas of interest
are established using as reference the pupils’ centers.
For each eye, two search areas are defined: one on the
right side and the other one on the left side. These two
areas correspond with those regions where the eyes’
corners are expected to be. So, within these four re-
gions, we are going to apply an interest operator. Par-
ticularly, we have applied the Shi-Tomasi method (Shi
and Tomasi, 1994). A sample of the results obtained
at this point can be observed in Fig. 6.
Figure 6: Interest operator applied over the four search ar-
eas.
As a result of this step, we obtain a set of points
that are candidates to be the eyes’ corners. Between
them, we need to choose those that better represent
the eyes’ corners.
2.3.2 Phase 2: Selection of Reference Points
Edge information is used at this step in order to obtain
the edges associated with the limits of the eyelids, so
they can be used as a reference of the eyes’ limits.
We use as input two areas of interest (one for each
eye) containing the eye. In order to facilitate edge de-
tection, we increase the enhancement of the eyelid by
increasing the contrast of the image. First, we convert
the images from the RGB color space to HSV color
space, in order to use the saturation channel S. It must
be considered that, regardless of the skin color, pix-
els from the sclera have always low intensity on the
saturation space due to their white color. Next, a ero-
sion filter considering the radius of the iris is applied.
The image obtained as a result from the application of
the erosion filter S
f
(x, y) is subtracted from the satura-
tion image S(x, y), obtaining this way the subtraction
image R(x, y) (as indicated in (1)). This process is
showed in Fig. 7, where it can be observed how the
low eyelid has now more contrast.
R(x, y) = S(x, y) −S
f
(x, y) (1)
Figure 7: Process of the enhancement of the eyelids’ con-
trast.
Next, a threshold for the binarization of the image
is computed using as reference some features of the
image according to (2), where µ is the average value
of the pixels from the difference image I
di f f
and σ is
the standard deviation.
th
s
= µ(I
di f f
) + 0.75 ∗ σ(I
di f f
) (2)
The binarization is computed according to (3),
where I
ths
is the thresholded image (see Fig. 8).
I
ths
(x, y) =
1 si I
di f f
(x, y) > th
s
0 otherwise
(3)
Figure 8: Thresholding the subtraction image R(x, y).
Although the eyelids are now easily segmentable,
there also exist other tiny elements that need to be
removed. These elements are small clusters of pixels
obtained from the thresholding. In order to remove
them, we are going to group the connected pixels as
blobs. Once all the pixels are grouped as blobs, we
take the biggest one and remove the remaining blobs.
This step is represented in Fig. 9, where the bigger
blob stays and the three tiny blobs are removed.
DetectionandCharacterizationoftheSclera-EvaluationofEyeGesturalReactionstoAuditoryStimuli
315
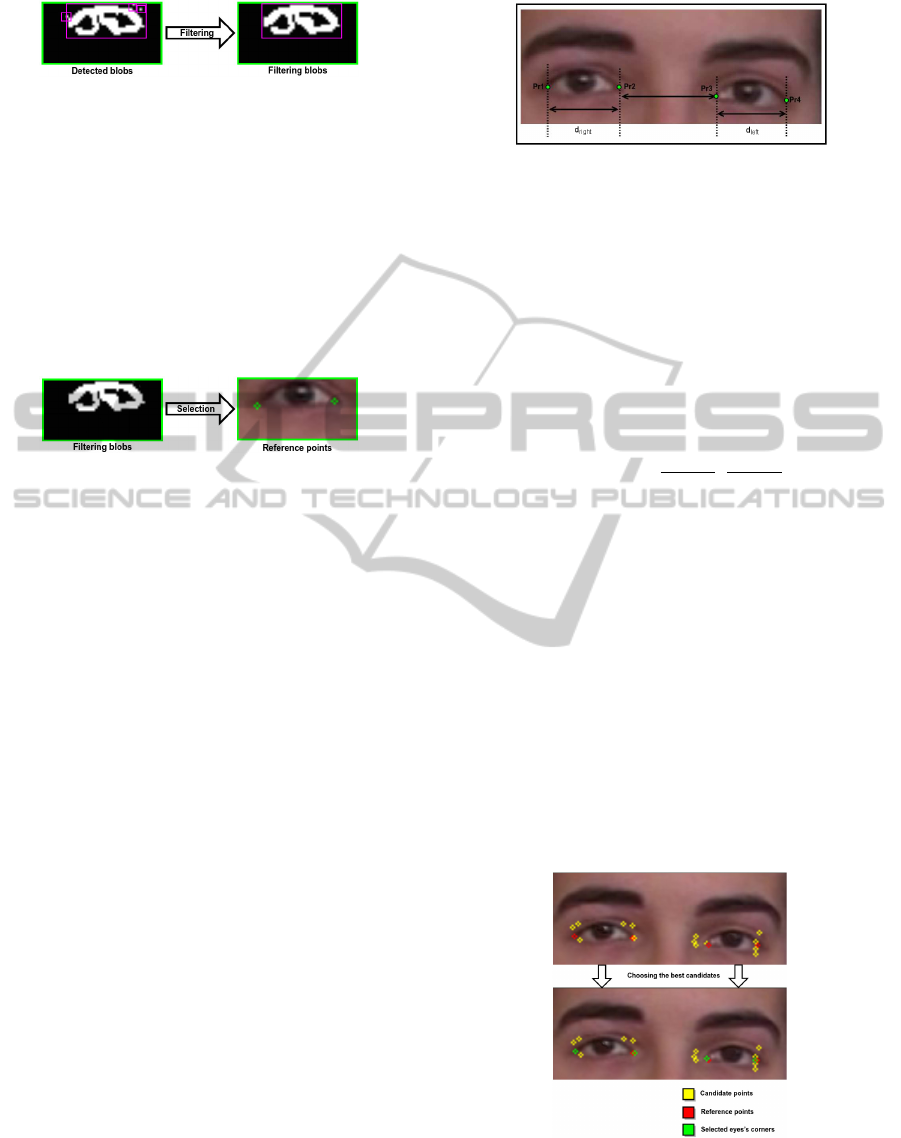
Figure 9: Blob filtering for removing noise.
Next, considering the anthropometric constraints
that involve the human eye, we can define the eyes’
corners as the intersections between the ellipses that
represent the eyelid, which correspond with the lower
and upper limits over the x coordinate of the blob pre-
viously obtained. In the case of obtaining two points
with the same value for the x coordinate, we choose
the one that has a lower value for the y coordinate.
This way, the reference points obtained at the end of
this phase can be observed in Fig. 10.
Figure 10: Reference points for a sample image.
2.3.3 Phase 3: Choosing the Best Candidates
At this point, we are going to consider the candidate
points and the reference points obtained in the previ-
ous phases with the aim of choosing the best candi-
dates to correspond with the eyes’ corners.
The reference points obtained from the previous
phase are labeled as Pr
1
, Pr
2
, Pr
3
and Pr
4
, where Pr
2
and Pr
3
represent the internal reference points (see
Fig. 11). We also consider the average size of the
eye tc
eye
and the inner distance dc
int
(where dc
int
is
the distance between Pr
2
and Pr
3
) computed for the
complete video sequence. According to (4) we accept
the reference point whenever the distance between the
ends of the eye is similar to the average size of the
eye tc
eye
computed for the complete video sequence.
d
right
represents the euclidean distance between Pr
1
and Pr
2
, d
le f t
is the euclidean distance between Pr
3
and Pr
4
and α is the allowed deviation. Otherwise,
we reject those reference points. The same occurs for
the inner reference points, where d
int
is the euclidean
distance between Pr
2
and Pr
3
, dc
int
the inner distance
computed for the video sequence and α is the allowed
deviation (see (5)).
f (d
le f t
, d
right
,tc
eye
, α) =
|d
le f t
−tc
eye
| ≤ α
|d
right
−tc
eye
| ≤ α
(4)
f (d
int
, dc
int
, α) =
|d
int
− dc
int
| ≤ α , Accept
|d
int
− dc
int
| > α , Reject
(5)
Figure 11: Location of the reference points.
Once the validity of the reference points has been
checked, with this information we compute the dis-
tances between the candidate points and the reference
points associated, finally choosing the candidate point
nearest to the reference point P
e
. In the case of two or
more candidate points with the same euclidean dis-
tance to the reference point, we compute the average
of those point according to (6), where P
c
represents
each one of the n candidate points with the same eu-
clidean distance to the reference point.
P
e
(x, y) = P
c
∑
n
i=1
x
i
n
,
∑
n
i=1
y
i
n
(6)
Finally, the quality of the selected points Pe
i
is an-
alyzed. If Pe
i
is far from the nearest reference point
Pr
i
, considering β as the maximum distance allowed,
that Pe
i
is going to be discarded and replaced by the
reference point Pr
i
, as indicated in 7.
Pe
i
=
Pe
i
si |Pe
i
− Pr
i
| < β
∀i ∈ {1 . . . 4}
Pr
i
otherwise
(7)
The results of this step of the methodology can be
observed in Fig. 12, where yellow points represent
the candidate points, red points correspond with the
reference points and green points represent the final
points selected as eyes’ corners.
Figure 12: Choosing the best candidates: yellow for can-
didate points, red for reference points and green for the se-
lected eyes’ corners.
VISAPP2015-InternationalConferenceonComputerVisionTheoryandApplications
316
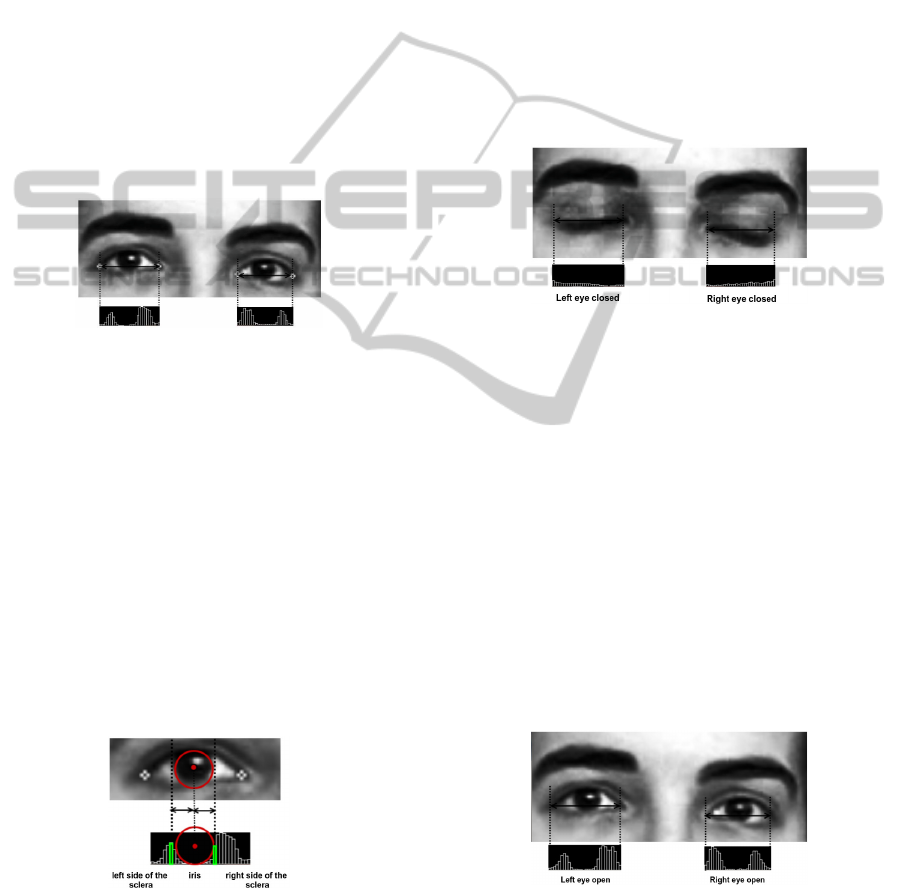
2.4 Eye Movement Characterization
The last step is the characterization and classification
of the eye movement. This is going to be accom-
plished using information from the sclera, the white
area of the eyes. To that end, we need to estimate
the amount of white in the eye, using as reference the
characteristic points previously obtained. According
to the audiologist’s criteria, four eye movements are
considered as relevant in this domain: eye open, eye
closed, gaze shift to the left and gaze shift to the right.
First, the input image is converted to grayscale
and a histogram equalization is applied over it. For
the characterization of the movement, we are going
to compute a gray level distribution representing the
gray level for each one of the pixels located in the line
connecting both eyes’ corners. The result of this step
can be observed in Fig. 13.
Figure 13: Sample of the gray level distribution.
Once we have computed the gray level distribution
we divide it into our three areas of interest, i.e.: iris,
left side of the sclera and right side of the sclera. To
that end, we make use of the information provided by
the pupil’s center and the estimation of the radius of
the iris. This way, starting from the pupil’s center we
go through the gray level distribution, both to the right
and to the left, until we detect the first white pixel that
indicates the boundary between the iris and the sclera.
This value is accepted whenever it does not exceed
the estimation of the radius of the iris. As a result of
this step, we obtain the delimitation of the three areas
of interest: iris, left side of the sclera and right side
of the sclera. The distribution of the delimitation of
these three areas can be observed in Fig. 14.
Figure 14: Delimitation of the three areas of interest over
the gray level distribution.
Next we discuss the rules for classifying the eye
status into the four categories established by the audi-
ologists.
• Eye Closed. Due to the absence of the sclera
when the eye is closed it is expected to have low
intensity of white values over the gray level distri-
bution. Considering this, we compute the summa-
tion of all the gray values G
i
for all the points in
the distribution. If the summation has a low value
we can consider that the eye is closed. Mathemat-
ically, this rule can be expressed as (8).
n
∑
i=1
G
i
< θ (8)
A sample of this category is represented in Fig. 15
where it can be observed that there is no white in-
formation along the distribution, which represents
that the eye is closed.
Figure 15: Gray level distribution for closed eye.
• Eye Open. It is the opposite case of the previ-
ous state eye closed, so, in this case, we are going
to have white information associated to the sclera.
This classification allows a subsequent classifica-
tion between gaze to the left and gaze to the right.
The mathematical representation is the opposite
of the previous status (9), where G
i
represents the
gray value of each one of the n points, and θ is the
same threshold. Fig. 16 shows an image sample
where it can be observed from the gray level dis-
tribution that there is white information from the
sclera.
n
∑
i=1
G
i
≥ θ (9)
Figure 16: Gray level distribution for open eye.
• Gaze Shift to the Right. This status is only pos-
sible when the eye is open. In order to distin-
guish it we are going to use the information previ-
ously obtained about the delimitation of the areas
DetectionandCharacterizationoftheSclera-EvaluationofEyeGesturalReactionstoAuditoryStimuli
317
of interest, in this case: left side of the sclera and
right side of the sclera. When the eye is classified
as open, we compute the summation of the gray
level values for each one of the sides of the sclera.
Next, it is checked whether the summation of the
right side of the sclera represents a small part of
the total summation of both sides. This can be ex-
pressed mathematically as in (10) where Ed rep-
resents the n
r
points located in the right side of the
sclera, T
j
represents the n points of both sides of
the sclera and β is a threshold empirically estab-
lished with value 0.20. A sample of this status is
showed in Fig. 17.
n
r
∑
i=1
Ed
i
≤ β ∗
n
∑
j=1
T
j
(10)
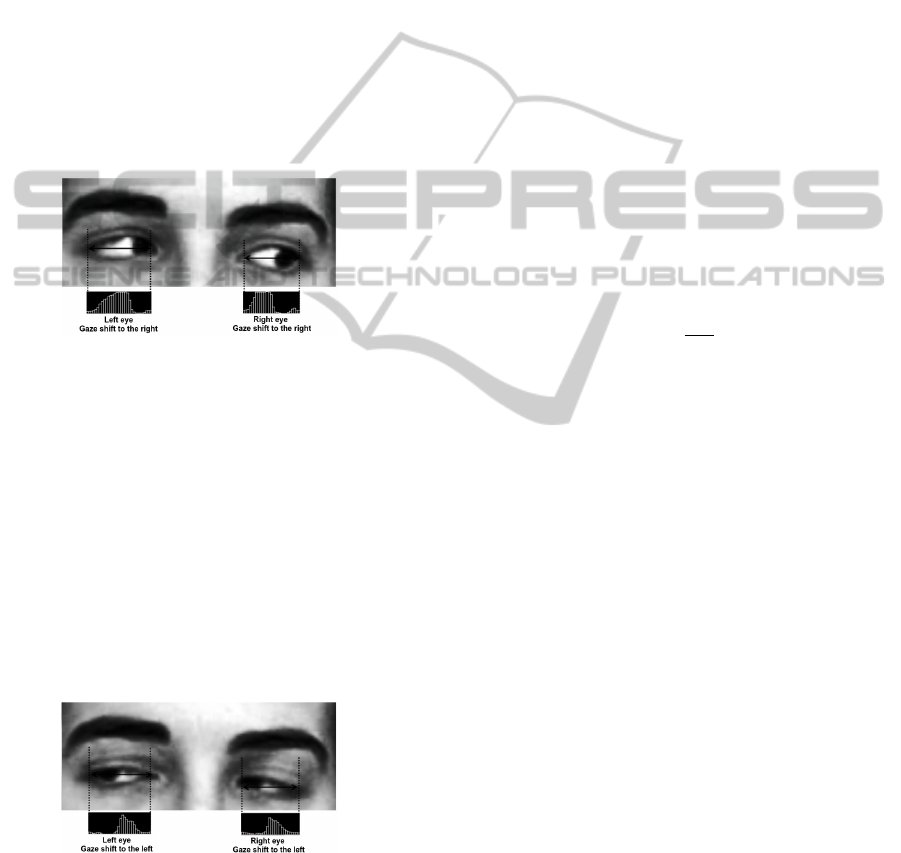
Figure 17: Gray level distribution for gaze shift to the right.
• Gaze Ghift to the Left. This status is defined
analogously to the previous status. Is this case, it
is checked whether the summation of the left side
of the sclera represents a small part of the total
summation of both sides. In (11), Ei represents
the n
l
points located in the left side of the sclera,
T
j
the n points of both sides of the sclera and β
is the threshold. Fig. 18 shows a sample of this
status.
n
l
∑
i=1
Ei
i
≤ β ∗
n
∑
j=1
T
j
(11)
Figure 18: Gray level distribution for gaze shift to the left.
3 EXPERIMENTAL RESULTS
Given the preliminary nature of this study, the aim
was to test the viability of the methodology over a
small dataset. Besides, due to the difficulties associ-
ated with the obtaining of permits for recording peo-
ple with severe cognitive decline (permits signed by
them may not have legal validity in severe cases, so
family permits would be needed), in this initial ap-
proach three different volunteers were instructed in
order to reproduce the typical movements of our tar-
get patients.
The proposed methodology is applied frame by
frame over three video sequences recorded during the
performance of the audiometry. The image acquisi-
tion is quite simple, the video camera must be located
behind the audiologist (the audiologist is seated in
front of the patient) and the recorded scene must show
the patient’s face and the audiometer (a sample of this
scenario can be observed in Fig. 2) Video sequences
were recorded in high resolution (1080x1920 pixels)
with a frame rate of 25 FPS (frames per second). Each
video sequence corresponds with a different patient
and they have an average duration of 6 minutes. So,
with a frame rate of 25 FPS and an average duration
of 6 minutes, we analyze an average of 9000 frames
for each video sequence.
The θ threshold presented in Section 2.5 was em-
pirically established as θ =
1700
n
where n is the aver-
age size of the eye.
This experiment is divided into two studies: the
analysis of accuracy in the classification of eye move-
ments and the analysis about the detection of eye ges-
tural reactions to the sound.
3.1 Movement Classification Accuracy
The aim here is to study the suitability of the method
in the classification of the eye movements. Three
video sequences from three different hearing assess-
ments were analyzed and classified frame by frame.
Table 1 shows the accuracy for each one of the four
eye movement categories considered in this domain
(it must be noted that the category Eyes open not only
correspond to the situation in which the eyes are open
with the gaze fixed to a central point, but it also con-
tains the categories Gaze shift to left and Gaze shift to
right). The results are quite acceptable since they are
above 82.84%. The high accuracy obtained for the
category Eyes open is justified because the empirical
threshold used here is optimized for this class since
it contains the gaze movements, that are the relevant
categories in this domain. It is important to emphasize
that the main goal of this work is not the correct clas-
sification of the eye movements, but to detect the eye
gestural reactions to the stimuli, which is the analysis
that we are going to conduct next.
VISAPP2015-InternationalConferenceonComputerVisionTheoryandApplications
318

Table 1: Accuracy for each one of the eye movement cate-
gories.
Eyes Eyes Gaze shift Gaze shift
closed open to left to right
Accuracy 84.31% 98.2% 85.89% 82.84%
3.2 Detection of Reactions to the Sound
As commented before, the great contribution that we
can provide to the audiologist is a proper detection of
the eye movements associated with reactions to the
auditory stimuli. Since the video sequences have a
frame rate of 25 FPS we know for certain that a re-
action will last more than one frame, this is why we
are not concerned about obtaining a high success rate
in classification, because if a typical reaction lasts be-
tween 10 and 15 frames, the misclassification of one
frame will not affect the proper detection of the reac-
tion.
For this experiment, we consider that a status can
be established when three or more consecutive frames
receive the same category in classification. Results
are detailed in Table 2, where we evaluate the agree-
ment between the methodology and the audiologists
based on the number of reactions to the stimuli de-
tected by each one of them. The agreement between
the methodology and the audiologists is complete
(100% of agreement) for the video sequences eval-
uated in this test.
Table 2: Evaluation in the detection of reactions to the
sound. Results are expressed in number of reactions.
Gaze shift Gaze shift
to left to right
Expected Detected Expected Detected
Video 1 17 17 15 15
Video 2 17 17 21 21
Video 3 20 20 18 18
Agreement 100% 100%
4 CONCLUSIONS
This work proposes a novel methodology for the de-
tection and identification of eye gestural reactions to
the auditory stimuli in order to facilitate the hearing
assessment of patients when no cooperation exists.
This task is accomplished using information about
the color distribution of the sclera. The results ob-
tained in this first approach point out the suitability
of the method for the detection of these specific kind
of reactions. Besides, we want to highlight the fact
that is methodology is an initial proposal where we
have classified the eye movements into the four cate-
gories established by the audiologists, but it is impor-
tant to note that the methodology is generic proposal
that would allow us to model or to characterize other
eye movements.
Several experiments were conducted in order to
obtain the final methodology. Four of them were ori-
ented to choose the best method for different steps of
the methodology: study of three different techniques
for pupil detection (Section 2.3), survey about differ-
ent interest operators for the selection of candidate
points (Section 2.4.1), analysis about the suitability
of the reference points (Section 2.4.2) and analysis of
the suitability of the candidate points chosen as eyes’
corners (Section 2.4.3). However, in order to sum-
marize, we only detail here a final experiment which
analyzes the behavior of the final methodology.
It must be highlighted that the proposed methodol-
ogy is a noninvasive method. In contrast to other eye
tracking methods, this solution that not require special
devices, or that the patients wear special glasses or
other contact elements neither a change in the typical
procedure of the audiologists. This is highly impor-
tant, since the need of an scenario as natural as possi-
ble has been highlighted by the audiologist in order to
not alter as much as we can the environment in order
to not to influence the natural responses of the patient.
Despite of the promising results, there still exist
some points that will be attempt as future works. First
of all, we need to obtain more video sequences in or-
der to increase our dataset and, thus, extend the ex-
perimental results with a more complete survey. This
is a complicated step, since it is not easy to obtain the
necessary permissions to record this special patients.
We can also consider the integration of this methodol-
ogy with the information provided by the audiometer.
The methodology could also be considered in other
domains such as the diagnosis of nystagmus, a condi-
tion of involuntary eye movement that may result in
reduced or limited vision.
The final contribution of this work might be very
interesting for the audiologist community since it is
a novel method for the detection of eye based ges-
tural reactions. This methodology will facilitate the
hearing assessment of patients with sever cognitive
decline or other communication difficulties, patients
that can not be evaluated following a standard proce-
dure. A proper hearing assessment of these patients
is more difficult to conduct, but it is very important to
solve this issue since a proper evaluation may help to
treat the hearing loss and improve the quality of life
of these patients.
DetectionandCharacterizationoftheSclera-EvaluationofEyeGesturalReactionstoAuditoryStimuli
319

ACKNOWLEDGEMENTS
This research has been economically supported in part
by the Consellera de Cultura, Educacin e Ordenacin
Universitaria of the Xunta de Galicia through the
agreement for the Singular Research Center CITIC
also by the Secretara de Estado de Investigacin of
the Spanish Government through the research project
TIN2011-25476.
REFERENCES
Buscher, G., Cutrell, E., and Morris, M. R. (2009). What
do you see when you’re surfing? using eye tracking
to predict salient regions of web pages. 27th inter-
national conference on Human factors in computing
systems Journal, pages 21–30.
Coetzer, R. and Hancke, G. (2011). Eye detection for a real-
time vehicle driver fatigue monitoring system. In In-
telligent Vehicles Symposium (IV), 2011 IEEE, pages
66–71.
Collins, J. (1997). Prevalence of Selected Chronic Con-
ditions: United States 1990-1992, volume 10 (194).
Hyattsville, MD: National Center for Health Statis-
tics, Public Health Service, National Center for Health
Stadistics.
Davis, A. (1989). The prevalence of hearing impairment
and reported hearing disability among adults in Great
Britain. Int J Epidemiol., 18:911–17.
Fernandez, A., Ortega, M., Penedo, M., Cancela, B., and
Gigirey, L. (2013). Automatic eye gesture recognition
in audiometries for patients with cognitive decline. In
Kamel, M. and Campilho, A., editors, Image Analy-
sis and Recognition, volume 7950 of Lecture Notes in
Computer Science, pages 27–34. Springer Berlin Hei-
delberg.
Shi, J. and Tomasi, C. (1994). Good features to track. In
1994 IEEE Conference on Computer Vision and Pat-
tern Recognition (CVPR’94), pages 593 – 600.
Timm, F. and Barth, E. (2011). Accurate eye centre local-
isation by means of gradients. In Mestetskiy, L. and
Braz, J., editors, VISAPP, pages 125–130. SciTePress.
Viola, P. and Jones, M. (2001). Robust real-time object de-
tection. In International Journal of Computer Vision.
Yu, H., Chen, G., and Liu, S. (2013). A study on the features
of eye movement based on different types of poetry
reading. In Intelligent System Design and Engineer-
ing Applications (ISDEA), 2013 Third International
Conference on, pages 195–199.
VISAPP2015-InternationalConferenceonComputerVisionTheoryandApplications
320
