
A Posterization Strategy for the Registration
of [123I]FP-CIT SPECT Brain Images
Diego Salas-Gonzalez
1
, Elmar W. Lang
1
, Juan M. G´orriz
2
and Javier Ram´ırez
2
1
CIML Group, Institute of Biophysics, University of Regensburg, Regensburg, Germany
2
Dpt. Signal Theory, Networking and Communications, University of Granada, Granada, Spain
Keywords:
[123I]FP-CIT SPECT Brain Images, Spatial Registration.
Abstract:
A fully automatic procedure to build a [123I]FP-CIT SPECT template in the MNI-space using only informa-
tion from the source images is presented. This approach does not require the acquisition of patient-specific
brain magnetic resonance image. This fully automatic procedure uses, firstly, the Otsu’s method to outline the
source images; secondly, a threshold strategy to posterize the source images and the template and, lastly, an
affine registration algorithm by the optimization of a square root of sum of squares cost function.
1 INTRODUCTION
The low resolution and the intersubject variability be-
tween [123I]FP-CIT SPECT images renders very dif-
ficult to perform the registration of these images. For
this reason, some published works performed the spa-
tial normalization assisted by the existence of a high
resolution MRI for each subject under study (van de
Giessen et al., 2013; Aarts et al., 2012). Sometimes,
there is not a T1-MRI available to assist the spatial
registration. For that cases, we present a fully auto-
matic method to perform the registration of [123I]FP-
CIT SPECT accurately. This method surmount the
difficulties of working with [123I]FP-CIT SPECT.
Namely, these images exhibit a lack of anatomical in-
formation outside the striatum. Specifically, in our
database, the brain image is cut and some slices in top
of the brain are missing.
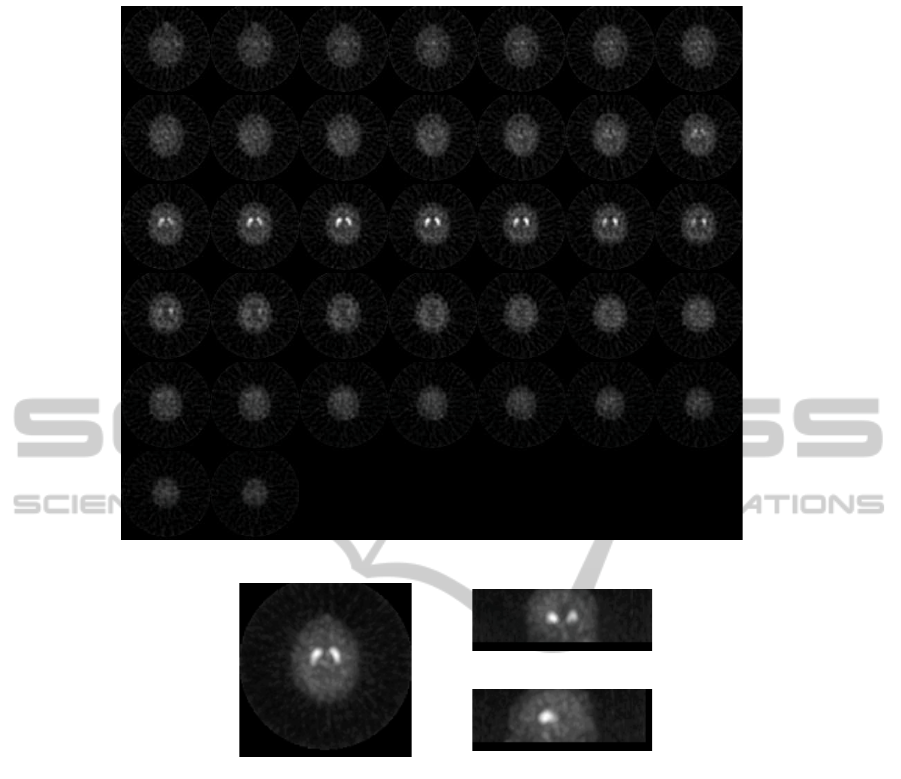
Figure 1(a) depicts a montage showing all the
slices of a sample source image (transaxial view).
Figure 1(b) displays the transaxial, coronal and sagit-
tal view showing the maximum intensity value calcu-
lated for each in this 3 orthogonal projections of the
brain 3D volume for a sample source image.
2 [123I]FP-CIT SPECT BRAIN
IMAGES
40 FP-CIT SPECT brain images with bilateral, sym-
metrical uptake appeared in caudate and putamen nu-
clei. These patients were chosen to perform an FP-
CIT tomographic study because of a movement disor-
der, but they are all labeled as non Parkinsonian’s.
The images were obtained between 3 and 4 hours
after the intravenous injection of 185 MBq (5 mCi)
of Ioflupane-I-123, with prior thyroid blocking with
Lugol’s solution. The tomographic study (SPECT)
with Ioflupane/FP-CIT-I-123 was performed using a
General Electric gamma camera, Millennium model,
equipped with a dual head and general purpose colli-
mator. A 360
◦
circular orbit was made around the cra-
nium, at 3
◦
intervals, acquiring 60 images per detector
with a duration of 35 seconds per interval, each con-
sisting of a 128× 128 matrix. Transaxial image slices
were reconstructed using the filtered back-projection
algorithm without attenuation correction, and apply-
ing a Hanning filter (cutoff frequency equal to 0.7).Fi-
nally, the dimension of the images in this dataset is
128× 128× Z, where Z ranges from 34 to 54 for dif-
ferent images.
3 POSTERIZED MNI TEMPLATE
IMAGE
Some functional imaging studies match their data to
a brain template from the Montreal Neurological In-
stitute (MNI) (Holmes et al., 1998; Aubert-Broche
et al., 2006). They are also used in the Statistical Para-
metric Mapping software (Friston et al., 2007). This
MNI template is based on an average of many scans
88
Salas-Gonzalez D., W. Lang E., Gorriz J. and Ramírez J..
A Posterization Strategy for the Registration of [123I]FP-CIT SPECT Brain Images.
DOI: 10.5220/0005296000880092
In Proceedings of the 10th International Conference on Computer Vision Theory and Applications (VISAPP-2015), pages 88-92
ISBN: 978-989-758-091-8
Copyright
c
2015 SCITEPRESS (Science and Technology Publications, Lda.)
(a)
(b)
Figure 1: (a) Montage with the transaxial slices of a selected source brain image. (b) Transaxial, coronal and sagittal view
showing the maximum intensity value projected in these 3 orthogonal planes for a sample source image.
of healthy young adults. We create a posterized ver-
sion of the brain in the standard space MNI (Montreal
Neurological Institute) of brain images using three in-
tensity values: 0 for voxels outside the head, 1 for the
head and a value in the striatum v
s
> 1. The position
of the striatum in the MNI space is taken by the infor-
mation in the labeled structural brain template image
provided by the MNI.
4 POSTERIZATION OF SOURCE
IMAGES
Firstly, we select those voxels corresponding to the
head in source images. We apply a low-pass band
filter to the image by smoothing it using a Gaussian
filter with the size of the convolution kernel [7 7 7]
and standard deviation equal to 5. This smoothness
of the image will allows us to distinguish more accu-
rately between the intensity values inside and outside
the brain. Once the source images are smoothed and
the high frequency noise reduced, we use the Otsu’s
method to automatically perform clustering-based im-
age thresholding, reducing the graylevel image to a
binary image (Otsu, 1979). This method assumes
that the source image contains two classes of vox-
els (head and background), then, calculates the op-
timum threshold separating those two classes so that
their combined intra-class variance is minimal. We
initially assign intensity value equal to 1 to the voxels
in the head and 0 to background voxels.
APosterizationStrategyfortheRegistrationof[123I]FP-CITSPECTBrainImages
89
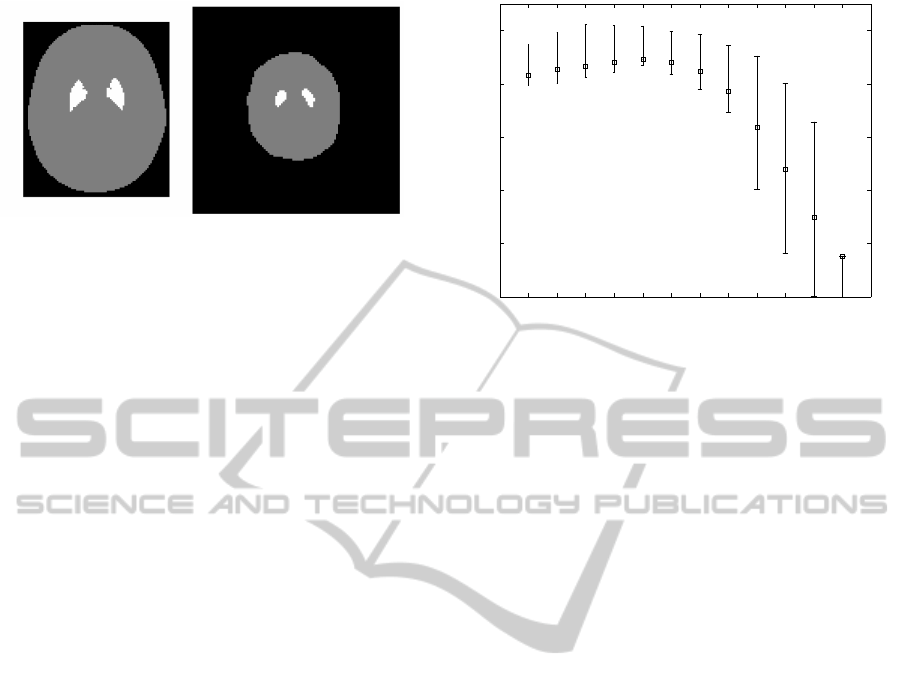
Figure 2: Transaxial slice of the posterized brain image.
Left: Template in the MNI space. Right: Source image.
Then, we select the Ns voxels in the striatum with
highest intensity values. We set an intensity value
v
s
to these selected voxels. Therefore, after posteri-
zation, the source image has three different intensity
values: 0 outside the head (the background), 1 in the
head (outside the striatum) and v
s
> 1 in the stria-
tum. Figure 2 presents a transaxial slice of the pos-
terized brain template image and one sample source
image. The striatum is the most important volume in
the source image for this SPECT modality, but it is
very small. The parameter v
s
controls the weight of
the striatum in the calculation of the cost function to
perform the spatial transformation of the source im-
ages to the MNI space.
5 AFFINE REGISTRATION
After posterization of the MNI template and the
source images, we perform the affine registration of
the posterized source images to the posterized brain
template in the MNI space. The 12 affine parame-
ters are calculated using the Gauss-Newton optimiza-
tion method. The cost function to minimize is the
mean squared difference between the intensity val-
ues in source and template images (Salas-Gonzalez
et al., 2008). Once the 12 affine parameters are calcu-
lated, we apply the affine transformation to the origi-
nal source image.
6 RESULTS
We apply the proposed methodology to 40 [123I]FP-
CIT SPECT brain images. Initially, we select Ns =
400 voxels of the striatum in each source image.
We posterize them using three different levels for
background (voxel intensity = 0), head (voxel in-
tensity = 1) and striatum (voxel intensity, v
s
=
2, 3, 4, 5, 6, 7, 8, 9, 10, 11, 13, 15). This value (v
s
) con-
trols the weight of the striatum in the calculation of
2 3 4 5 6 7 8 9 10 11 13 15
0
0.1
0.2
0.3
0.4
0.5
Weight Striatum
Jaccard Index
Figure 3: Mean Jaccard Index and error for varying v
s
(Ns =
400 voxels).
the cost function used to perform the affine registra-
tion. Then, we perform the affine registration of the
source images to the MNI template and measure the
overlap between the striatum in the source images and
the template using the Jaccard Index (JI).
We do not expect to get a Jaccard Index near 1 be-
cause the striatum of the posterized source and tem-
plate images are three-dimensional regions with dif-
ferent shapes and volumes, and therefore, using only
affine transfomations, they are not expected to fully
overlap.
Figure 3 shows the mean Jaccard Index and the er-
ror measured as the 75th and 25th percentile for each
value of the weight v
s
. The measured value of JI in-
creases concomitantly with v
s
up to v
s
= 6, where the
best accuracy and lower error are obtained. For higher
values of v
s
, the measured JI decreases and the error
bar increases.
Once the posterized source images have been reg-
istered to the posterized MNI template, the estimated
12 affine parameters are applied to the original im-
ages. Then, the mean image is calculated to build the
template.
Figure 4 shows all transaxial slices of the FP-CIT
SPECT template built using the proposed methodol-
ogy and the MRI T1 template in the MNI space. It
can be visually checked that the FP-CIT template has
been successfully transformed to the MNI space.
Figure 5 shows a transaxial slice of the FP-CIT
SPECT Template superimposed to the T1 MRI tem-
plate in the MNI space. This figure shows that the
high intensity values corresponding to the striatum is
accurately placed in its true anatomical position.
VISAPP2015-InternationalConferenceonComputerVisionTheoryandApplications
90
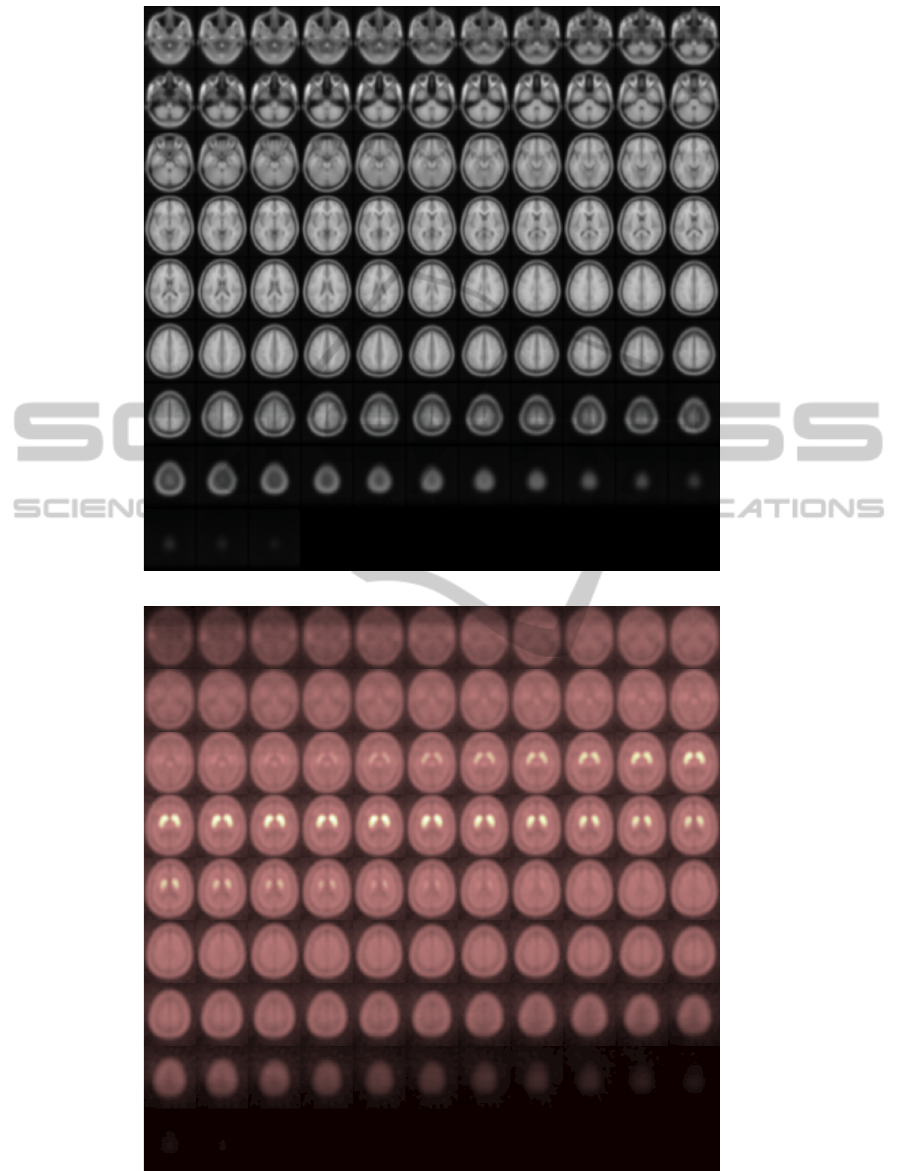
(a)
(b)
Figure 4: (a) T1 template in the MNI space. (b) [123I]FP-CIT SPECT template.
APosterizationStrategyfortheRegistrationof[123I]FP-CITSPECTBrainImages
91
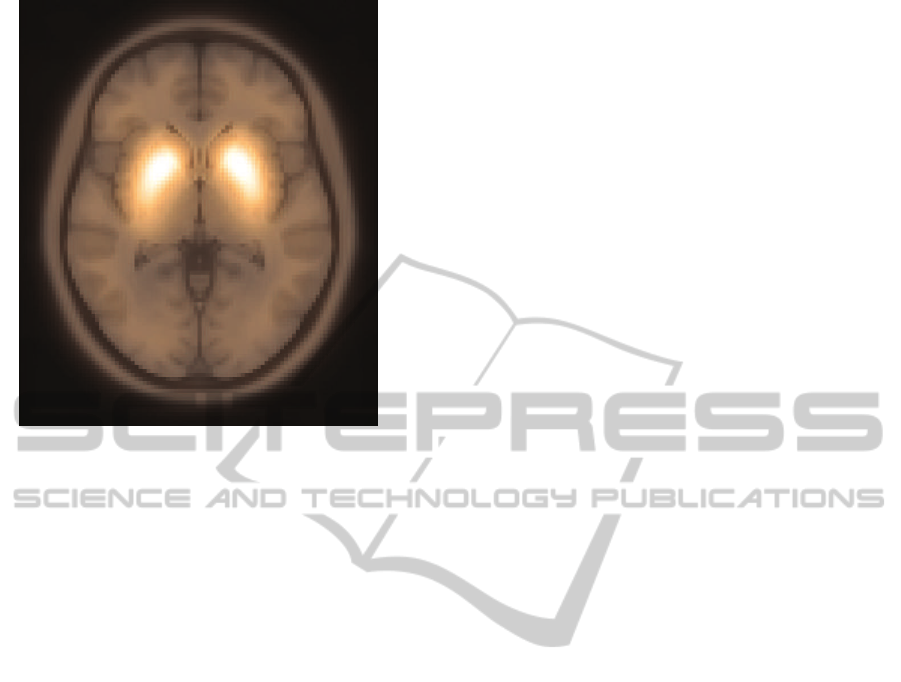
Figure 5: Brain fusion image in the MNI space: MRI and
[123I]FP-CIT SPECT.
7 CONCLUSION
In this work, a procedure to build a [123I]FP-CIT
SPECT template is presented. The brain images
are posterized to three different intensity level (back-
ground, brain and striatum). Then, these image are
registered to a previously posterized template im-
age using a 12 parameters affine model. The pro-
posed methodology is shown to accurately works for
[123I]FP-CIT SPECT images, even when high reso-
lution magnetic resonance image for each subject is
not available.
ACKNOWLEDGEMENTS
This work has been supported by a Marie Curie Intra-
European Fellowship from the 7th Framework Pro-
gramme FP7-PEOPLE-2013-IEF (Project: 624453
ALPHA-BRAIN-IMAGING).
REFERENCES
Aarts, E., Helmich, R. C., Janssen, M. J., Oyen, W. J.,
Bloem, B. R., and Cools, R. (2012). Aberrant reward
processing in parkinson’s disease is associated with
dopamine cell loss. NeuroImage, 59(4):3339 – 3346.
Aubert-Broche, B., Evans, A., and Collins, L. (2006). A
new improved version of the realistic digital brain
phantom. NeuroImage, 32(1):138–145. cited By
(since 1996)68.
Friston, K., Ashburner, J., Kiebel, S., Nichols, T., and
Penny, W., editors (2007). Statistical Parametric
Mapping: The Analysis of Functional Brain Images.
Academic Press.
Holmes, C., Hoge, R., Collins, L., Woods, R., Toga, A., and
Evans, A. (1998). Enhancement of mr images using
registration for signal averaging. Journal of Computer
Assisted Tomography, 22(2):324–333. cited By (since
1996)411.
Otsu, N. (1979). A threshold selection method from gray-
level histograms. Systems, Man and Cybernetics,
IEEE Transactions on, 9(1):62–66.
Salas-Gonzalez, D., G´orriz, J. M., Ram´ırez, J., Lassl, A.,
and Puntonet, C. G. (2008). Improved gauss-newton
optimization methods in affine registration of spect
brain images. IET Electronics Letters, 44(22):1291–
1292.
van de Giessen, E., Hesse, S., Caan, M., Zientek, F., Dick-
son, J., Tossici-Bolt, L., Sera, T., Asenbaum, S., Guig-
nard, R., Akdemir, U., Knudsen, G., Nobili, F., Pa-
gani, M., Vander Borght, T., Van Laere, K., Varrone,
A., Tatsch, K., Booij, J., and Sabri, O. (2013). No as-
sociation between striatal dopamine transporter bind-
ing and body mass index: A multi-center european
study in healthy volunteers. NeuroImage, 64(1):61–
67. cited By (since 1996)3.
VISAPP2015-InternationalConferenceonComputerVisionTheoryandApplications
92
