Multimodal Interaction Techniques in Scientific Data Visualization
An Analytical Survey
Jannik Fiedler
1,2
, Stefan Rilling
1
, Manfred Bogen
1
and Jens Herder
2
1
Fraunhofer IAIS, Sankt Augustin, Germany
2
FH D¨usseldorf, University of Applied Sciences, D¨usseldorf, Germany
Keywords:
Interaction, Multimodal, Interaction Techniques, 3-D Interaction, Immersive Environments.
Abstract:
The interpretation process of complex data sets makes the integration of effective interaction techniques cru-
cial. Recent work in the field of human–computer interaction has shown that there is strong evidence that
multimodal user interaction, i.e. the integration of various input modalities and interaction techniques into
one comprehensive user interface, can improve human performance when interacting with complex data sets.
However, it is still unclear which factors make these user interfaces superior to unimodal user interfaces. The
contribution of this work is an analytical comparison of a multimodal and a unimodal user interface for a
scientific visualization application. We show that multimodal user interaction with simultaneously integrated
speech and gesture input improves user performance regarding efficiency and ease of use.
1 INTRODUCTION
It is the dream of a single user interface which ad-
dresses and understands all human senses for commu-
nication that drives the research field of multimodal
user interfaces (Turk, 2013). The utilization of a sin-
gle human sense for communication in an interface is
referred to as modality (i.e. speech, gesture). Mul-
timodal interfaces are a subset of natural user inter-
faces, which are in turn meant to replace the well–
known WIMP paradigm used in many graphical user
interfaces by making the interaction between a user
and a computer more natural and intuitive (van Dam,
1997).
The recording and recognition of tracking data for
a single modality is nowadays nothing special any-
more, i.e. devices such as the Microsoft Kinect track a
user’s movements, and interaction via speech is pos-
sible by the use of one of the various speech recog-
nition software systems. Using these or similar de-
vices and technologies, developers of natural user in-
terfaces aim to implement interaction techniques that
are modeled similar to human–to–human interaction.
The combination of in- and output devices, modal-
ities and techniques into a single interface proofsto be
a challenging task, however (Turk, 2013). The way
the various modalities are combined and to what de-
gree a user is forced to use more than one modality is
still an open research question. This combination of
modalities is commonly referred to as Multimodal In-
tegration or Fusion Engine (Nigay and Coutaz, 1993).
If multiple modalities are combined simultaneously
and users are forced to use more than one for a sin-
gle task, the combination is called a synergistic fusion
engine method. For a comprehensive overview of the
various multimodal integration patterns refer to (Ni-
gay and Coutaz, 1993).
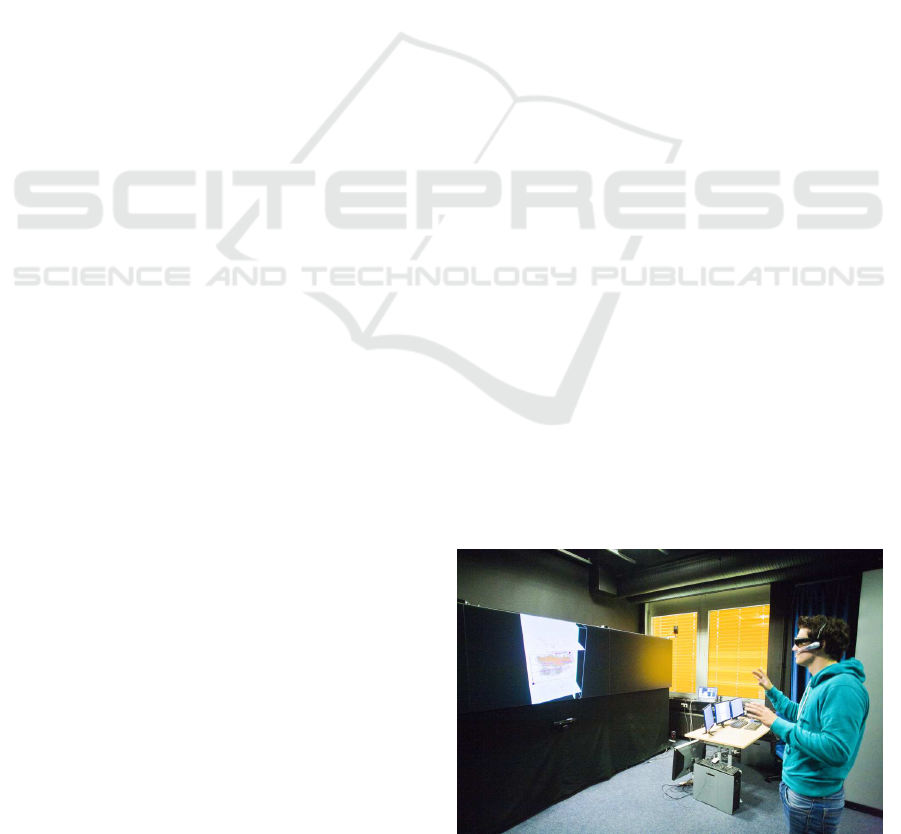
Figure 1: The scientific data visualization exploiting multi-
modal interaction techniques. The user is interacting with
seismic datasets using a Microsoft Kinect (left, below the
display) and a headset. No additional input devices attached
are necessary except stereo glasses.
Interactive, scientific visualization applications
comprise datasets which are very often massive in
size and complexity. The interpretation of these data
431
Fiedler J., Rilling S., Bogen M. and Herder J..
Multimodal Interaction Techniques in Scientific Data Visualization - An Analytical Survey.
DOI: 10.5220/0005296404310437
In Proceedings of the 10th International Conference on Computer Graphics Theory and Applications (GRAPP-2015), pages 431-437
ISBN: 978-989-758-087-1
Copyright
c
2015 SCITEPRESS (Science and Technology Publications, Lda.)

sets through a human expert is therefore a difficult
task, and reducing the cognitive load that weighs on a
user during the interaction can make the interpretation
process of such datasets more intuitive and efficient
(Bryson, 1996). As the aim of multimodal interfaces
is to reduce cognitive load as well as to make the inter-
action more intuitive and natural, using this type of in-
terface as means of interaction for complex scientific
data visualization has the potential to improve the ef-
ficiency of the user interaction compared to unimodal
user interfaces. In addition, it is argued that differ-
ent modalities are processed in distinct areas of the
brain (Arabzadeh et al., 2008), enabling users to learn
multiple modalities in parallel without increasing the
cognitive load. That the interaction techniques are
as important as the visualization techniques in scien-
tific data visualization has been established long ago
(Bryson, 1996).
A successful adaption of multimodal user inter-
faces in interactive visualization applications requires
a profound understanding of the factors that make
such a user interface superior to unimodal user inter-
faces (Oviatt, 1999). It is important to know which
interaction tasks can benefit from multimodal inter-
action techniques and which cannot. This knowl-
edge can be gained by an analytical comparison of
unimodal and multimodal interaction techniques. To
achieve this, a user interface within an interactive vi-
sualization application is described in this work (see
figure 1). The user interface provides tools for the
interpretation process of scientific data and supports
both unimodal and multimodal interaction techniques
for the various interaction tasks. These unimodal
and multimodal interaction techniques are evaluated
within a comparative user study.
The remainder of this paper is structured as fol-
lows: After an overview of current and previous re-
lated work, the setup used for the evaluation in this
work is described. Afterwards, the objectives, imple-
mentation and results of the user study are presented
and discussed. At last, this work is concluded with a
short perspective of future directions.
2 RELATED WORK
Probably one of the most often referenced and dis-
cussed multimodal user interface was introduced by
Richard Bolt in 1980 (Bolt, 1980). His interface en-
abled users to interact with objects on a large screen
using simultaneous speech and hand gestures as input.
The combination of speech and a primary input
modality (i.e. hand gestures, pen) is often used in
multimodal user interfaces (Bowman et al., 2001).
This can be traced to the fact that speech is well suited
for system control tasks and users are used to input
modes such as hand gestures or pen. Another also
well-known example that uses speech and pen input
is called QuickSet (Cohen et al., 1997). The mul-
timodal user interface presented in this work makes
use of speech and hand gestures as modalities as well.
Similar to the put–that–there interface, users are able
to perform system control tasks (i.e. creation of ob-
jects) through speech commands whereas object spe-
cific tasks (i.e. defining an object’s position) is be-
ing done with hand gestures. However, since the
content in our system consists of 3D data objects, a
pointing gesture would not suffice for defining an ob-
ject’s position in 3D space – thus, the interaction tech-
niques used in our interface are similar to a grabbing
metaphor rather than a pointing metaphor.
The perspective of the present work includes that
multimodal interaction eases cognitive load. But why
is that important? A recent study on gesture mem-
orization showed that users were only able to effec-
tively recall two abstract gestures (J´ego et al., 2013).
This result indicates that the cognitive load could al-
ready reach critical levels when users have to memo-
rize more than two commands of a single modality –
an issue that could be resolved by the use of multiple
modalities since research shows that different modal-
ities can be processed simultaneously in distinct areas
of the brain (Arabzadeh et al., 2008).
Additionally, there have been several user stud-
ies regarding the user performance in different mul-
timodal integration patterns or fusion engine meth-
ods. For instance, (Oviatt et al., 2005) sought to de-
termine if different participants have different domi-
nant integration patterns. The study was performed
over a six week period and the results indicated that
a majority of all participants had one single dominant
integration pattern, which remained consistent. Simi-
lar to the approach in the present work, performance
speed and number of errors was measured for the final
evaluation, which was further distinguished by how
new or complex tasks were for users. Furthermore,
the user interface featured speech commands for sys-
tem control tasks. Two additional user studies, which
were aimed at finding out at which multimodal inte-
gration patterns users achieve more efficiency, were
performed for adults (Xiao et al., 2003) and for chil-
dren separately (Xiao et al., 2002). Specifically, se-
quential and simultaneous use of multiple modalities
was evaluated. Here, the modality for system control
tasks is, again, speech. However, the primary inter-
action took place with a pen in 2D, whereas the in-
teraction in the present work requires a 3D technique
due to 3D content – which is why the choice fell on
GRAPP2015-InternationalConferenceonComputerGraphicsTheoryandApplications
432
gestures in the present work.
All of the user studies mentioned compare dif-
ferent integration patterns or fusion engine meth-
ods. However, a systematic comparison between uni-
modal interaction techniques (non–integrated modal-
ities) and multimodal interaction techniques (inte-
grated modalities) is still lacking. This work present
such comparative user survey and thus, a step into the
right direction.
3 THE USER STUDY SETUP
The user study presented in this work was conducted
using an in-house developed immersive interactive
data visualization system used for the interpretation of
three-dimensional volumetric seismic data sets. This
modular data visualization system serves as a flexi-
ble research platform for the investigation of novel
human-computer interaction techniques. The data is
visualized on a large LED display wall using active
stereo projection. A user can interact with the soft-
ware using gestures and speech as the primary input
modalities. The user’s body movements are being
tracked using a Microsoft Kinect and interpreted by
the gesture detection subsystem. Speech recognition
is implemented using a headset to minimize the ef-
fects of ambient noise. To enable geoscientists to fo-
cus entirely on the interpretation process, the use of
window-based menus or icons is completely avoided.
Figure 1 shows an overview of the setup.
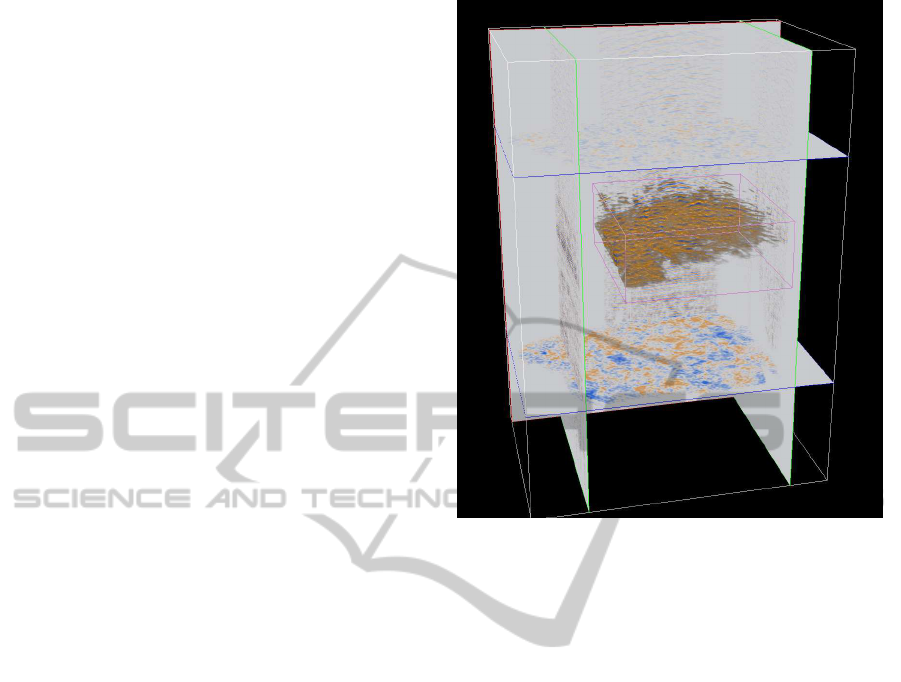
The data can be viewed by users either by the use
of direct volume rendering techniques or by the use
of slice-based visualization (see figure 2). The di-
rect volume rendering is further limited to a freely
scale– and translatable cuboid area (the so-called vol-
ume lens), making all data inside of it visible. Mul-
tiple slices can be placed inside the volume data set,
the orientation of the slices is always perpendicular to
one of the principal axis of the data set, and the slice
can be moved along this axis by the user.
The user can perform several interaction tasks us-
ing gesture- and speech based interaction techniques:
The creation of multiple slices and the volume lens,
the translation and scaling of the volume lens and in-
dividual slices, as well as the deletion of these objects.
Furthermore, users are able to navigate around and to
zoom into the 3D scene using a orbit-navigation tech-
nique.
To evaluate unimodal and multimodal user inter-
action techniques, the system was extended to en-
able users to interact with either unimodal interac-
tion techniques by using either speech or gesture com-
mands for each single task, or multimodal interaction
Figure 2: Direct volume rendering– and slice–based visual-
ization of a reflection seismic data set from the field of geo
sciences. The user can create various sections and move
them around along the principal axis of the volumetric data
set.
techniques by using a simultaneous combination of
speech and gesture for each single task. The design of
the user study (c.f. 4) requires that the two interaction
paradigms cannot be mixed. This means that only one
category of user interaction techniques is available to
users.
4 USER STUDY
The interactive visualization application with its uni-
modal and multimodal user interface described in sec-
tion 3 was evaluated with a comparative user study.
The main objective was to find out if multimodal in-
teraction techniques improvethe efficiency of the user
interaction essentially and result in a more intuitive
user interface.
As with unimodal interaction techniques only one
single modality is used, the structure of the user study
has to be carefully designed in order to keep both
types of interaction techniques comparable: With, for
example, the single use of gestures, it would be im-
possible to perform system control tasks such as cre-
ating objects from the visualization without the use of
a dedicated menu system or a large dictionary of ges-
tures. With the single use of speech based commands,
MultimodalInteractionTechniquesinScientificDataVisualization-AnAnalyticalSurvey
433

system control tasks could be modeled without addi-
tional user interface elements, but this would intro-
duce a lack of precision in object positioning tasks.
Using multimodal interaction techniques, both posi-
tioning and system control tasks can be realized at the
same time using gestures and speech in a single in-
terface. Thus, in order to ensure comparability, the
unimodal user interface must feature these capabili-
ties as well. It therefore also features both gesture and
speech with the exact same interaction techniques (i.e.
hand movement translates to object mvoement), al-
though the modalities are not combined or integrated
– for every task, a user is only using a single modality,
either speech commands for system control tasks like
object creation, or gestures for object specific tasks
like positioning.
The participants of the study had to fulfill a set
of tasks, which could be performed using either uni-
modal or multimodal interaction techniques. If users
would have had the choice of interacting with the sys-
tem either with multimodal or with unimodal interac-
tion techniques at the same time, the test would not
be conclusive. Users might choose to interact uni-
modally if there is the possibility to do so even though
they were asked to interact multimodally (or the re-
verse) (Oviatt, 1999). Therefore, the two interaction
paradigms were evaluated in two separate groups of
users – one group had only access to the unimodal
interaction techniques, whereas the other group was
only able to interact multimodally.
The intuitiveness of the system was evaluated us-
ing objective measurements. For this purpose, the
amount of time a user requires to finish a task and the
number times a user makes an error (i.e. saying the
wrong phrase, accidently causing some other action
than the intended one) while interacting with the sys-
tem to solve the given task was measured during the
study. The more intuitive a interaction technique, the
less time is needed by the user to solve a given task at
the first attempt, and the less errors are made by the
user. Errors could include saying the wrong phrase or
accidentally triggering a command. In addition to the
objective measurements, the subjective impression of
the user was also considered as an important factor to
judge the effects of multimodal user interaction. This
subjective data was obtained by a questionnaire the
users had to answer after the interaction session.
The interaction with the interface was explained
to each user by an introductory video before starting
the session. That way, it was assured that each user
got the same amount of previous knowledge about the
interface, and the possibility of the investigator influ-
encing the participant could be eliminated.
To test for indications for significant differences
within the results of the both groups, the signifi-
cance was statistically evaluated using a student’s t–
test (Haynes, 2013).
4.1 Implementation
The study was performed with 10 participants. The
participants had to fulfill three tasks: Manipulation of
objects, creation of objects, and deletion of objects.
All participants were daily computer users. Two of
them were females and eight of them males. The aver-
age age of all participants was 26. Furthermore, about
half of the participants were experienced with gestu-
ral user interfaces. The participants were equally di-
vided into two groups – ”Unimodal” (U) and ”Mul-
timodal” (M). For both groups there was a separate
application started which featured the respectively in-
teraction techniques – not letting the participant use
any technique from the other group. Participants in
both groups knew neither what was the purpose of this
test nor that there were two groups. To which group
a participant would belong or which paradigm they
would use in the system was picked randomly. Af-
ter completing the tests, participants were handed a
questionnaire to evaluate their subjective feeling and
opinion on the interaction paradigm.
The introductory video was presented to the par-
ticipants for each of the three tasks explaining how
the interaction techniques for the particular task work.
During playback of the video, participants were told
not to immediately try the explained interaction tech-
niques but instead wait until the explanation has fin-
ished – the video was then paused after finishing the
explanation for a particular task. Immediately after
pausing the video, participants were shown a screen-
shot of the system which showed a situation specifi-
cally designed for the current task (i.e. a volume lens
with specific position and scaling). Participants were
then asked to reach the same situation using the just
explained techniques – measuring two variables in the
process: Time taken for the task and errors made by
the participant.
By explaining the interaction techniques first and
then immediately giving a task where they are needed,
the measurement of the time taken directly correlates
to the time participants need to master the techniques.
If, for instance, a participant requires a major amount
of time for completing a task due to many falsely
recognized commands or gestures, it could indicate
that the interaction technique is not intuitive since the
user needs much time to adapt to it. Overall, the
techniques used in both interaction paradigms were
modeled as similar as possible (i.e. scaling with two
hands) – just the combination of modalities differed
GRAPP2015-InternationalConferenceonComputerGraphicsTheoryandApplications
434
for both paradigms.
4.2 Results and Discussion
The results of the user study can be divided into two
subparts: subjective results, which were evaluated us-
ing a questionnaire, and objective results, which were
gained by measurements.
4.2.1 Subjective Results
The questionnaire consisted of a total of seven ques-
tions with space for additional feedback at the end.
All questions within the questionnaire could be an-
swered with a score between 1 and 5. The first two
questions aimed at determining the scope of partici-
pants (How often do you use a computer? (1 = never,
5 = daily) and How familiar are you with gestural in-
terfaces such as the Microsoft Kinect? (1 = very unfa-
miliar, 5 = very familiar)). The third and fourth ques-
tion aimed at determining the user acceptance for the
interface (Rate how much fun to use the system was (1
= very frustrating, 5 = very much fun) and Rate how
easy it felt to use the interface using the shown inter-
action techniques (1 = very difficult, 5 = very easy)) –
these two questions resulted in almost the same mean
score for both groups, showing that neither of the two
paradigms felt awkward and that the overall user ac-
ceptance of all participants was high.
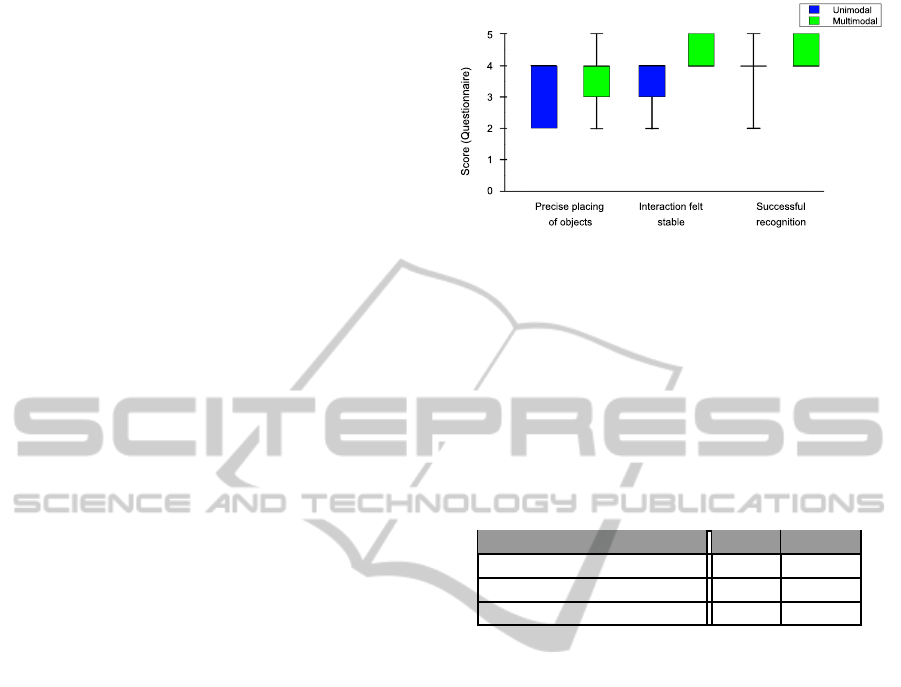
The remaining three questions aimed at determin-
ing how precise, stable and responsive the interaction
felt for the participants (Rate how precise you were
able to place objects in 3D space (1 = very imprecise,
5 = very precise), Rate how often the system would
recognize a command falsely (1 = very often, 5 =
never) and Rate how many of your commands were
successfully recognized (1 = none, 5 = all)). These
three questions are shown in figure 3.
The results in figure 3 show that the precision and
stability of multimodal interaction techniques was fa-
vored by the participants. The significance of the dif-
ferences was evaluated using a student’s t–test.
The results shown in table 1 show that there is a
significant difference in the robustness category (ρ <
0.05). This result could be caused by the use of a syn-
ergistic fusion engine method: Since the system only
reacts to a user’s commands if multiple modalities are
used at once, there is less chance that the system will
misinterpret any movement or spoken phrase as an in-
tended command.
Using the unimodal interaction, a single hand
movement or spoken phrase could already be falsely
interpreted as some command. Thus, multimodal in-
teraction could proof to create more error-prone inter-
action experiences.
Figure 3: The results of the questions Rate how precise you
were able to place objects (Precise placing of objects), Rate
how often the system would recognize a command falsely
(Interaction felt stable) and Rate how many of your com-
mands were successfully recognized (Successful recogni-
tion).
Regarding the precise placing of objects and the
successful recognition questions, no significant differ-
ence could be found (ρ > 0.05).
Table 1: T–test results for the three questions shown in fig-
ure 3.
Question t ρ
Precise placing of objects 0.566 0.294
Interaction felt stable 2.132 0.0328
Successful recognition 1.095 0.153
4.2.2 Objective Results
For the evaluation of the time it took a participant to
fulfill an particular task, the time values were con-
verted into decimal values for the t–test analysis (i.e.
00:01:30 = 1.5). Figure 4 shows distinct differences
between the particular tasks. Here, the more easy
tasks (manipulation and deletion) only resulted in mi-
nor differences between the two paradigms, whereas
the more complex task (object creation – involving
system control) resulted in a large difference. Specif-
ically, it took participants in the unimodal group aver-
agely twice as much time for the object creation task
as participants in the multimodal group (see figure 4).
Here, a clear difference is visible and thus, the
need to perform a t–test for further evaluation of the
results was present. The results of the t–test for all
three tasks are shown in table 2.
For the creation task, which was the most complex
task, the difference between the time taken by partic-
ipants in the unimodal and the multimodal group is
highly significant (ρ < 0.01). This result shows that
participants of the multimodal group became much
more efficient in performing complex tasks than par-
ticipants in the unimodal group. Since the time was
measured immediately after the task was given to the
MultimodalInteractionTechniquesinScientificDataVisualization-AnAnalyticalSurvey
435
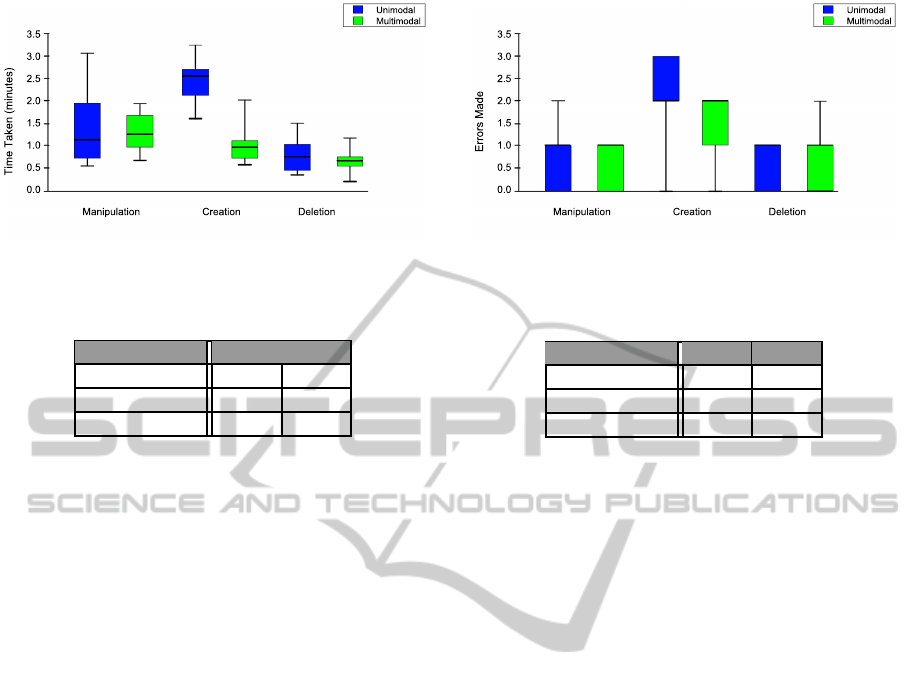
Figure 4: The results of the measurement of how long a
participant required for finishing the three tasks.
Table 2: T–test results for the time measurement shown in
figure 4.
Task t ρ
Manipulation 0.273 0.396
Creation 3.582 0.004
Deletion 0.687 0.256
participants (without having the chance to adapt to the
new interaction techniques), the highly significant dif-
ference further indicates that the interaction technique
was much more easier to master when used multi-
modally.
As for the remaining two tasks, manipulation and
deletion, the difference between the time taken by par-
ticipants in the unimodal and the multimodal group is
not significant (ρ > 0.05).
Besides measuring the time it took a participant to
fulfill a particular task, the amount of errors a par-
ticipant made while performing the techniques for
each task was measured additionally. These errors in-
cluded, for example, saying the wrong phrase or ac-
cidentally deleting or creating an object. The number
of errors made by the participants shows how fast they
were able to adapt to the interaction paradigm.
The results are shown in figure 5: The unimodal
paradigm is slightly ahead in the deletion task and
the multimodal interaction paradigm is again largely
ahead when looking at the most complex task – cre-
ation. Yet a t–test is required to determine if the dif-
ference is significant.
The results of the t–test for the errors made criteria
are shown in table 3.
None of the tasks show a significant difference in
how many errors a participant made (ρ > 0.05). How-
ever, the overall difference comparing the three tasks
shows that the creation task was the most complex
task of the three (since participants of both groups
made more errors for this task).
Although the unimodal group was ahead in how
many errors were made while performing the deletion
task (figure 5), the insignificant difference (ρ < 0.05)
shows that this could be a coincidence.
Figure 5: The results of the measurement of how many er-
rors a participant would make distinguished by task.
Table 3: T–test results for the criteria of how many errors
made as shown in figure 5.
Task t ρ
Manipulation 0.447 0.333
Creation 0.885 0.201
Deletion 0.316 0.380
Overall, we have shown that there is a highly sig-
nificant difference between unimodal and multimodal
interaction regarding the criteria how long it would
take participants to adapt to a newly learned interac-
tion technique – which could indicate that multimodal
interaction is more intuitive or causes less cognitive
load. Although the t–test minds the number of partic-
ipants and 5 participants suffice for an evaluation in
most cases (Nielsen, 2000), user tests with more par-
ticipants are required to further evaluate the results of
the present work.
5 CONCLUSION AND FUTURE
WORK
We showed an analytical comparison between uni-
modal and multimodal interaction techniques within
an interactive data visualization application which
aimed at answering the question if interaction with
complex data sets becomes more efficient and intu-
itive when using multimodal interaction. Here, the
intuitiveness was evaluated by measuring how long
it took users to adapt to an interaction technique that
they had never used before.
The results of our evaluation show that using
the multimodal interaction implemented in the pre-
sented demonstrator application (c.f. section 3) , users
became highly significantly more efficient at com-
plex interaction tasks, whereas the efficiency in less
complex tasks did not result in a significant differ-
ence. It took participants using the unimodal in-
teraction paradigm with the same techniques twice
as much time for mastering a complex interaction
GRAPP2015-InternationalConferenceonComputerGraphicsTheoryandApplications
436

task than participants using the multimodal interac-
tion paradigm. This can be interpreted as an effect
of a reduction of the cognitive load that weighs on the
user when using commands integrated across multiple
modalities. Another significant difference was found
in terms of robustness: Participants were asked to rate
how stable the interaction paradigm worked for them.
This indicates that due to the multimodal paradigm
only reacting to an interaction if multiple modalities
are used at once, the error rate can be reduced – cre-
ating a more robust solution than with a unimodal in-
teraction paradigm. With the unimodal paradigm, a
single movement could already be falsely recognized
as intended gesture.
Although the user study was performed with a
fairly limited number of participants (10 in total), it is
argued that a user study with 5 participants fully suf-
fices in most cases (Nielsen, 2000). In addition, the
statistical analysis used in the present work (student’s
t–test) takes the number of participants into account
(Haynes, 2013).
Since even the most complex task in the present
work, the creation of objects with the use of sys-
tem control, is relatively simplistic, studies with more
complex tasks are required to further approve the re-
sults of the present work. Yet the results already show
that there is a highly significant difference between
the two paradigms and that multimodal interaction
techniquescan improvethe efficiencyof a natural user
interface.
The results gained in this work are related to an in-
teractive scientific data visualization application. Al-
though the interaction tasks the user had to fulfill in
the user study are basically applicable to other appli-
cations different from scientific data visualization or
from different scientific fields, it is still an open ques-
tion if these results also apply to other applications
of human computer interaction with different input-
and output modalities. Hence, it would be interesting
to use different modalities, or to add more modalities
such as eye gaze or haptic. Repeating the user study
with a larger number of participants or with the use of
different interaction techniques and different or more
complex interaction tasks is necessary to get a deeper
understanding of the general benefits of multimodal
interaction techniques and to verify the outcome of
this work.
REFERENCES
Arabzadeh, E., Clifford, C. W., and Harris, J. A. (2008). Vi-
sion Merges With Touch in a Purely Tactile Discrimi-
nation. Psychological Science, 19(7).
Bolt, R. (1980). Put–That–There. In Proceedings of the 7th
annual conference on Computer graphics and inter-
active techniques, pages 262–270.
Bowman, D., Kruijff, E., Laviola, J., and Poupyrev, I.
(2001). An Introduction to 3–D User Interface De-
sign. Presence, 10(1).
Bryson, S. (1996). Virtual Reality in Scientific Visualiza-
tion. Commununications of ACM, 39(5):62–71.
Cohen, P., Johnston, M., McGee, D., Oviatt, S., Pittman, J.,
Smith, I., Chen, L., and Clow, J. (1997). QuickSet:
Multimodal Interaction for Distributed Applications.
In Proceedings of the fifth ACM international confer-
ence on Multimedia, pages 31–40.
Haynes, W. (2013). Student’s t-Test. In Encyclopedia
of Systems Biology, pages 2023–2025. Springer New
York.
J´ego, J., Paljic, A., and Fuchs, P. (2013). User-Defined Ges-
tural Interaction: a Study on Gesture Memorization.
In IEEE Symposium on 3D User Interfaces (3DUI),
pages 7–10.
Nielsen, J. (2000). Why You Only Need to Test with
5 Users. http://www.nngroup.com/articles/why-you-
only-need-to-test-with-5-users/. [Online; accessed
last on 16-12-2014].
Nigay, L. and Coutaz, J. (1993). A Design Space For Multi-
modal Systems: Concurrent Processing and Data Fu-
sion. In Conference on Human Factors in Computing
Systems, pages 172–178.
Oviatt, S. (1999). Ten Myths of Multimodal Interaction.
Commun. ACM, 42(11):74–81.
Oviatt, S., Lunsford, R., and Coulston, R. (2005). Indi-
vidual differences in multimodal integration patterns:
What are they and why do they exist? In Proceed-
ings of the SIGCHI conference on Human factors in
computing systems, pages 241–249. ACM.
Turk, M. (2013). Multimodal Interaction: A review. Pattern
Recognition, 36:189–195.
van Dam, A. (1997). Post–WIMP User Interfaces. Commu-
nications of the ACM, 40(2).
Xiao, B., Girand, C., and Oviatt, S. L. (2002). Multimodal
integration patterns in children. In 8th International
Conference on Spoken Language Processing, Korea.
Xiao, B., Lunsford, R., Coulston, R., Wesson, M., and Ovi-
att, S. (2003). Modeling multimodal integration pat-
terns and performance in seniors: Toward adaptive
processing of individual differences. In Proceedings
of the 5th international conference on Multimodal in-
terfaces, pages 265–272. ACM.
MultimodalInteractionTechniquesinScientificDataVisualization-AnAnalyticalSurvey
437
