
Learning Visual Odometry with a Convolutional Network
Kishore Konda
1
and Roland Memisevic
2
1
Goethe University Frankfurt, Frankfurt, Germany
2
University of Montreal, Montreal, Canada
Keywords:
Visual Odometry, Convolutional Networks, Motion, Stereo.
Abstract:
We present an approach to predicting velocity and direction changes from visual information (”visual odom-
etry”) using an end-to-end, deep learning-based architecture. The architecture uses a single type of compu-
tational module and learning rule to extract visual motion, depth, and finally odometry information from the
raw data. Representations of depth and motion are extracted by detecting synchrony across time and stereo
channels using network layers with multiplicative interactions. The extracted representations are turned into
information about changes in velocity and direction using a convolutional neural network. Preliminary results
show that the architecture is capable of learning the resulting mapping from video to egomotion.
1 INTRODUCTION
Visual odometry is a fascinating area of research with
a wide range of applications in robotics, navigation
and many other applications. The visual odometry ba-
sically involves estimation of egomotion from visual
information, such as a sequence of frames from one
or more cameras. In the past few years many interest-
ing and efficient approaches like (Badino et al., 2013;
Nist
´
er et al., 2004; Chandraker et al., 2013; Kitt et al.,
2010) were introduced to deal with the visual odom-
etry problem. Some of the approaches, like (Chan-
draker et al., 2013), only rely on monocular video,
whereas others, like (Badino et al., 2013; Nist
´
er et al.,
2004), use stereo information. A common property
across most of these works is that they rely on key-
point detection and tracking, combined with camera
geometry, for estimating visual odometry.
In recent years learning based approaches have
shown promising results in many areas of computer
vision. Models like convolutional networks were
proven to be very effective across a range of vision
tasks, like classification and localization (Krizhevsky
et al., 2012), depth estimation (Eigen et al., 2014) and
many more. Unsupervised feature learning models
like (Memisevic, 2011; Konda et al., 2014) demon-
strated the ability to learn representations of local
transformations from the data via multiplicative in-
teractions. In this work we show how an end-to-end
learning based approach based on motion and depth
representations can be used to perform visual odom-
etry. We present a preliminary approach for relat-
ing learned motion and depth representation to vi-
sual odometry information like ’change in direction’
and ’velocity’ using a convolutional network. To our
knowledge this work is the first to propose a deep
learning based architecture for visual odometry.
Section 2 briefly explains the synchrony condition
which is the basis for the unsupervised learning model
explained in section 3. In the section that follows
details on the learning model parameters and convo-
lutional architecture are presented. Finally, Section
5 demonstrates the inference procedure and results
from path prediction task.
2 MOTION AND DEPTH
ESTIMATION BY SYNCHRONY
DETECTION
A simple approach to learning motion representations
by relating frames in a video is presented in (Konda
et al., 2014). It shows that detection of a spatial
transformation can be viewed as the detection of syn-
chrony between the image sequence and a sequence
of features undergoing that transformation called syn-
chrony detection. The paper also presents a simple
way to detect synchrony by allowing for multiplica-
tive (gating) interactions between filter responses as
shown in Figure 1. An extension to learning depth by
detection of spatial transformation across stereo pairs
486
Konda K. and Memisevic R..
Learning Visual Odometry with a Convolutional Network.
DOI: 10.5220/0005299304860490
In Proceedings of the 10th International Conference on Computer Vision Theory and Applications (VISAPP-2015), pages 486-490
ISBN: 978-989-758-089-5
Copyright
c
2015 SCITEPRESS (Science and Technology Publications, Lda.)
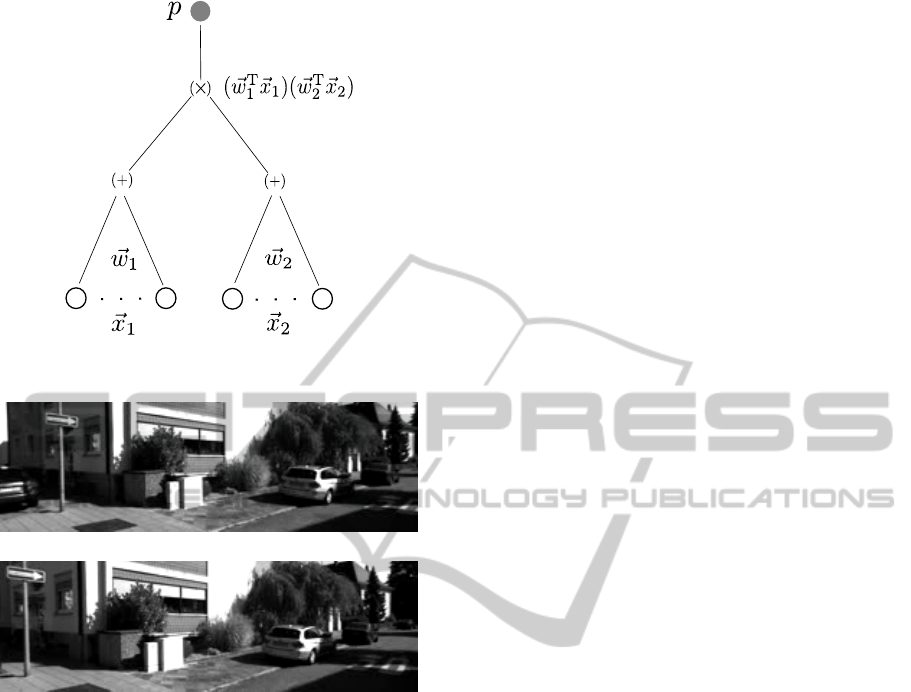
Figure 1: Synchrony detection using multiplicative interac-
tion.
Figure 2: Two subsequent frames from a sequence involv-
ing turning action.
using synchrony detection was presented in (Konda
and Memisevic, 2013). That paper also showed how
a combined representation for depth and motion can
be learned using a similar architecture. In this work,
we show how the joint representation of depth and
motion learned using the models presented in (Konda
and Memisevic, 2013) can be used to estimate visual
odometry using stereo videos sequences as input.
2.1 Why Depth?
One can argue that using only local motion informa-
tion might be sufficient for estimation of visual odom-
etry. In this section we explain how depth information
can be used to resolve some of the issues from only
using motion information. Figure 2 shows two frames
involving change in direction of motion. It shows
that the objects that are close the camera undergo a
larger shift across the frame as compared to the ob-
jects which are far. Motion information alone can-
not determine the change in direction since two dif-
ferent motion patterns can represent the same amount
of change in direction in the two different cases. In
other words, depending on the distance of an object
from the camera, the same actual motion can yield a
small or a large displacement of the pixels represent-
ing that object. Using depth information allows us to
disambiguate these cases.
3 UNSUPERVISED LEARNING
MODEL
For pre-training a representation of depth and motion
we employ the synchrony/depth autoencoder (SAE-
D) presented in (Konda and Memisevic, 2013). In
contrast to the classic motion energy model, the
synchrony-based SAE-D approach is a single-layer
module that allows for local, Hebbian-type learning
to extract features from video data. Let
~
X,
~
Y ∈ R
N
be the concatenation of T vectorized frames ~x
t
,~y
t
∈
R
M
,t = 1, .. ., T , and be defined such that (~x
t
,~y
t
) are
stereo image pairs. Let W
x
,W
y
∈ R
Q×N
denote ma-
trices containing Q feature vector pairs
~
W
x
q
,
~
W
y
q
∈ R
N
stacked row-wise.
Encoding: The filter responses are defined as
~
F
X
= W
x
~
X and
~
F
Y
= W
y
~
Y corresponding to the se-
quences
~
X and
~
Y . A simple representation of motion
and depth is given by:
H
q
= σ(F
x
q
F
y
q
) (1)
We use the ’truncated Relu’ non-linearity from
(Memisevic et al., 2014) as σ, which does not require
any regularization during training.
Decoding: Reconstructions of the inputs are given
by:
ˆ
X = (W
x
)
T
(
~
H
~
F
Y
) (2)
ˆ
Y = (W
y
)
T
(
~
H
~
F
X
) (3)
Learning: Training data for the model is a set of
stereo sequence pairs
~
X,
~
Y ∈ R
N
. Just as in a standard
autoencoder, the SAE-D model is trained to minimize
the reconstruction error given by
L((
~
X,
~
Y ),(
ˆ
~
X,
ˆ
~
Y )) = k(
~
X −
ˆ
~
X)k
2
+ k(
~
Y −
ˆ
~
Y )k
2
(4)
The model is trained with stochastic gradient descent.
4 SUPERVISED LEARNING
USING CONVOLUTIONAL
NEURAL NETWORK
Convolutional Neural Networks (CNNs) have been
established as a powerful class of models for a va-
riety of tasks including classification and regression.
LearningVisualOdometrywithaConvolutionalNetwork
487

Figure 3: Filters learned from stereo sequences. Row 1: Frames 1-5 of the learned filters. Row 2: Corresponding stereo pairs
of filters in Row 1.
In this work a CNN is trained to relate local depth
and motion representations to local changes in veloc-
ity and direction, thereby learning to perform visual
odometry. Features learned using the SAE-D model
(see previous section) are used to initialize the deep
convolutional network. We observed that training the
CNN without using features from unsupervised pre-
training resulted in noisy filters and over-fitting on the
training data.
5 EXPERIMENTS
To evaluate our approach for learning visual odom-
etry we choose the task of path prediction by esti-
mating local velocity and change in direction. As ex-
plained in earlier sections this is done by learning to
relate local motion and depth representations with the
desired information. For this we chose the odome-
try dataset from the KITTI Vision benchmark (Geiger
et al., 2012).
5.1 Dataset
The odometry dataset from the KITTI Vision bench-
mark (Geiger et al., 2012) consists of stereo se-
quences collected while driving a vehicle outdoors. A
total of 21 sequences are provided out of which 11 se-
quences are with ground truth trajectories for training
and 11 sequences for evaluation without any ground
truth. The ground truth information is provided in
terms of a 3× 4 transformation matrix which projects
the i-th coordinate system into 0-th coordinate sys-
tem. We define the local change in direction as the
change in orientation of the vehicle around the axis
perpendicular to the direction of motion over a set of
subsequent frames. The velocity is defined as the dis-
tance traversed by the vehicle in a frame interval. The
original resolution of the videos is 1241 × 376. The
videos are down-sampled to 300 × 100 so as to ac-
commodate the local horizontal shift across the stereo
pairs with in a local patch. In our experiments a frame
interval or sub-sequence of 5 frames is used to esti-
mate the discretised velocity and change in direction
labels. We leave out 3 of the given training sequences
(8,9 and 10) so as to compare our approach to ground
truth.
5.2 Learning
The SAE-D model is trained on local stereo block
pairs each of size 16 ×16 × 5 (space × space × time)
cropped randomly from the training sequences. The
total number of training samples is 500, 000 which are
dimensionally reduced using PCA. The filters learned
by the model are visualized in figure 3. It can be ob-
served that learning results in phase shifting gabor
features which are well-suited to representing local
translations. In the same figure a small phase shift
can be observed in corresponding features both across
time (column) and also across stereo pair (row).
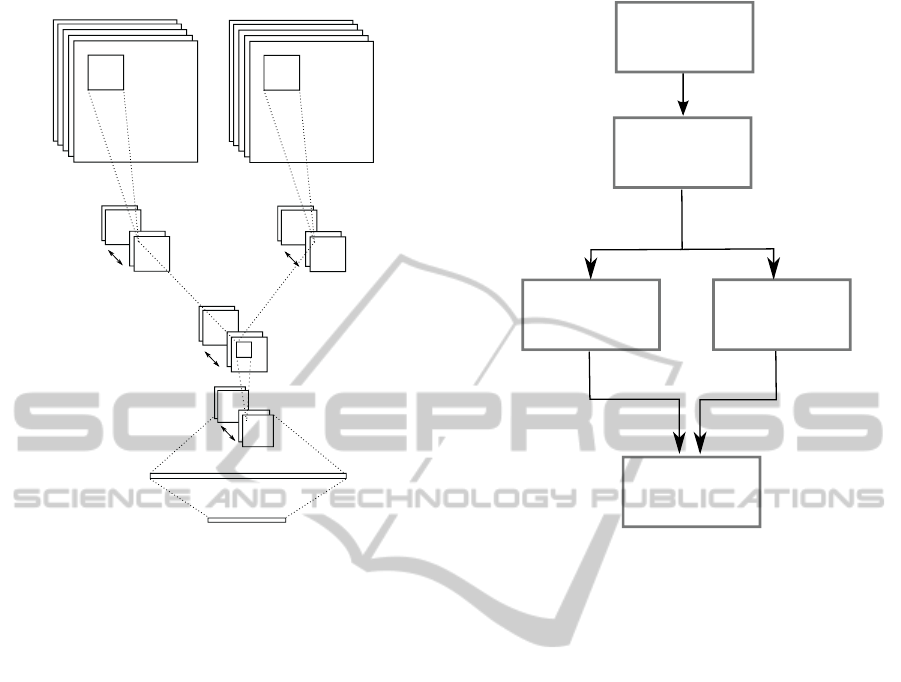
The features learned using the SAE-D model are
used to initialize the first layer of a CNN with the
architecture shown in Figure 4. Before the learned
features are used to initialize the CNN they are de-
whitened to get back to image space. The output of
the first layer of the CNN can be interpreted as a com-
bined representation of local motion and depth. The
later part of the CNN relates the local representations
to the desired label (change in direction/velocity).
Two different networks with the same architecture
VISAPP2015-InternationalConferenceonComputerVisionTheoryandApplications
488
5 frames
Left video sequence
Right video sequence
90
90
90
90
16
16
16
16
256
15
15
256
15
15
5
5
15
15
512
Softmax (Velocity/Direction)
256
5
5
128
Elementwise product
Fully connected layer
convolution, stride=1
+ pooling [2,2]
convolution, stride=5
Figure 4: Architecture of the CNN used in this work.
as in Figure 4 are trained, one for prediction of veloc-
ity and one for prediction of local change in direction.
As mentioned above the filters of the first convolu-
tional layer of both networks are initialized with fea-
tures obtained from unsupervised learning. The input
to each network is a 5 frame sub-sequence and the
target is a vector representation of discretised veloc-
ities and direction changes. We also tried replacing
the softmax layer of the CNN with a linear regression
layer so as to predict real valued velocities and change
in directions. Due to lack of large amounts of data, es-
pecially for the change in directions, linear regression
was unable to learn a good prediction model.
6 PATH PREDICTION
Using the CNN networks described in the previous
section, the velocity and change in direction for each
5-frame sub-sequence of the entire sequence is pre-
dicted. A flow diagram of the path prediction pro-
cess is visualized in figure 5. Using predicted veloc-
ity and change in direction information the path of the
complete sequence can be recovered. Figure 6 shows
two of the predicted paths along with corresponding
original path and the path computed from discretised
ground truth. From the predicted paths it can be ob-
served that our approach is able to predict most of the
Stereo camera
5 frame
sub-sequence
CNN
(Velocity)
CNN
(Direction)
Local velocity
Local change
in direction
Path
Figure 5: Inference line for path prediction.
change in directions and velocities accurately. As a
result of error accumulation one can also observe in-
creasing error in displacement from starting point to
the end of a path.
6.1 Computational Efficiency
We used a GPU based implementation of both the un-
supervised learning model and the convolutional net-
work for better computational efficiency. For the GPU
implementations, we used the theano library (Bergstra
et al., 2010). We calculated the inference times for the
path prediction task by computing total time taken for
path prediction of each sequence divided by the total
number of frames in that sequence. Average inference
times (in seconds/frame) is 0.026. All experiments
were performed on a system with a 3.20 GHz CPU,
24 GB RAM and a GTX 680 GPU.
7 CONCLUSION
Based on the preliminary results we can conclude that
the architecture is capable of learning the resulting
mapping from video to egomotion. In this work we
currently do not use any post processing or automatic
loop closure techniques for better path prediction. In
future work we intend to add a convolutional network
LearningVisualOdometrywithaConvolutionalNetwork
489
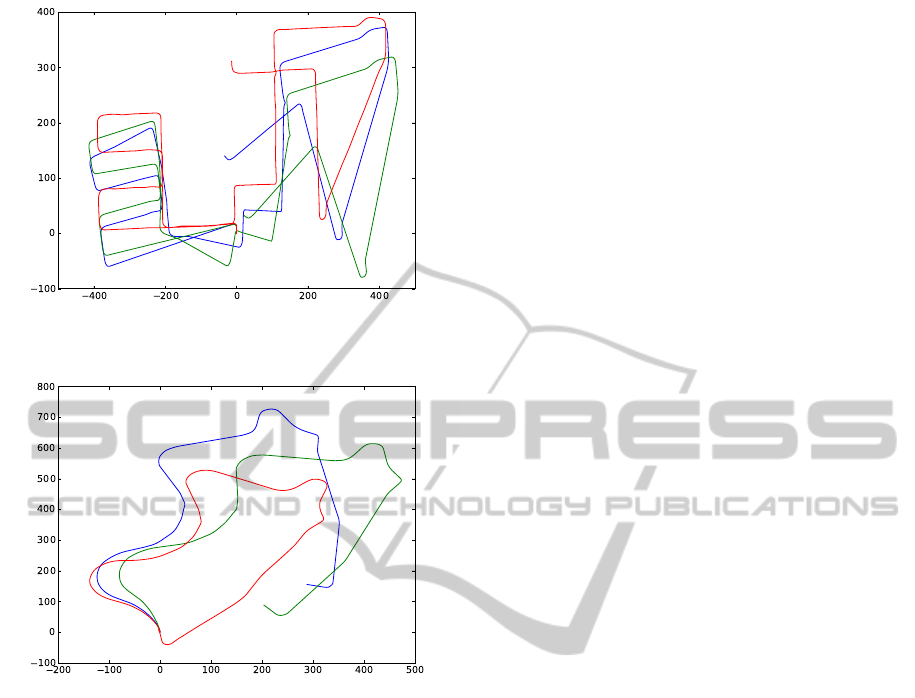
(a) Train sequence (Seq.8)
(b) Test sequence (Seq.9)
Figure 6: Original ground truth path is displayed in Red,
discretised ground truth in Green and the estimated one in
Blue.
based landmark detection scheme which will help in
automatic loop closure. In the current form the ap-
proach cannot be compared to the state-of-the-art ap-
proaches for visual odometry in terms of precision.
We believe our work is a step towards building a com-
mon architecture for many vision tasks like object
classification, depth estimation, activity analysis and
visual odometry.
ACKNOWLEDGEMENTS
This work was supported in part by the German Fed-
eral Ministry of Education and Research (BMBF) in
projects 01GQ0841 (BFNT Frankfurt), by an NSERC
Discovery grant and by a Google faculty research
award.
REFERENCES
Badino, H., Yamamoto, A., and Kanade, T. (2013). Visual
odometry by multi-frame feature integration. In Com-
puter Vision Workshops (ICCVW), 2013 IEEE Inter-
national Conference on, pages 222–229. IEEE.
Bergstra, J., Breuleux, O., Bastien, F., Lamblin, P., Pascanu,
R., Desjardins, G., Turian, J., Warde-Farley, D., and
Bengio, Y. (2010). Theano: a CPU and GPU math
expression compiler. In SciPy.
Chandraker, M., Reddy, D., Wang, Y., and Ramamoorthi, R.
(2013). What object motion reveals about shape with
unknown brdf and lighting. In Computer Vision and
Pattern Recognition (CVPR), 2013 IEEE Conference
on, pages 2523–2530. IEEE.
Eigen, D., Puhrsch, C., and Fergus, R. (2014). Depth map
prediction from a single image using a multi-scale
deep network. In Advances in neural information pro-
cessing systems.
Geiger, A., Lenz, P., and Urtasun, R. (2012). Are we ready
for autonomous driving? the kitti vision benchmark
suite. In Conference on Computer Vision and Pattern
Recognition (CVPR).
Kitt, B., Geiger, A., and Lategahn, H. (2010). Visual odom-
etry based on stereo image sequences with ransac-
based outlier rejection scheme. In Intelligent Vehicles
Symposium (IV), 2010 IEEE, pages 486–492. IEEE.
Konda, K. R. and Memisevic, R. (2013). Unsupervised
learning of depth and motion. CoRR, abs/1312.3429.
Konda, K. R., Memisevic, R., and Michalski, V. (2014).
Learning to encode motion using spatio-temporal syn-
chrony. In Proceedings of ICLR.
Krizhevsky, A., Sutskever, I., and Hinton, G. E. (2012). Im-
agenet classification with deep convolutional neural
networks. In Advances in neural information process-
ing systems, pages 1097–1105.
Memisevic, R. (2011). Gradient-based learning of higher-
order image features. In Computer Vision (ICCV),
2011 IEEE International Conference on, pages 1591–
1598. IEEE.
Memisevic, R., Konda, K. R., and Krueger, D. (2014). Zero-
bias autoencoders and the benefits of co-adapting fea-
tures. CoRR, abs/1402.3337.
Nist
´
er, D., Naroditsky, O., and Bergen, J. (2004). Visual
odometry. In Computer Vision and Pattern Recogni-
tion, 2004. CVPR 2004. Proceedings of the 2004 IEEE
Computer Society Conference on, volume 1, pages I–
652. IEEE.
VISAPP2015-InternationalConferenceonComputerVisionTheoryandApplications
490
