
Visualization of Large Scientific Datasets
Analysis of Numerical Simulation Data and Astronomical Surveys Catalogues
Bruno Thooris and Daniel Pomarède
Institut de recherche sur les lois fondamentales de l’Univers, CEA Saclay, Gif/Yvette, France
Keywords: Astrophysics, Simulation, Cosmography, Visualization.
Abstract: In the context of our project COAST (for Computational Astrophysics), a program of massively parallel
numerical simulations in astrophysics involving astrophysicists and software engineers, we have developed
visualization tools to analyse the massive amount of data produced in these simulations. We present in this
paper the SDvision code capabilities with examples of visualization of cosmology and astrophysical
simulations realized with hydrodynamics codes, and more results in other domains of physics, like plasma
or particles physics. Recently, the SDvision 3D visualization software has been improved to cope with the
analysis of astronomical surveys catalogues, databases of multiple data products including redshifts,
peculiar velocities, reconstructed density and velocity fields. On the basis of the various visualization
techniques offered by the SDvision software, that rely on multicore computing and OpenGL hardware
acceleration, we have created maps displaying the structure of the Local Universe where the most prominent
features such as voids, clusters of galaxies, filaments and walls, are identified and named.
1 INTRODUCTION
Initially developed for the visualization of the huge
amount of data coming from numerical simulation
results in astrophysics, we improved our
visualization tools for processing other types of huge
datasets.
The interface was realized in the framework of
the COAST (for COmputational ASTrophysics)
project in our institute; COAST (COAST n.d.)
(Thooris & al. 2009) (Audit & al. 2006) is a program
of massively parallel numerical simulations in
astrophysics involving astrophysicists and software
engineers. Magneto-Hydrodynamics simulation
codes are developed and optimized for the latest
generation of mainframes. The goal is the
understanding of the structuring of the Universe
from large-scale cosmological structures down to the
formation of galaxies and stars.
Visualizing the massive amount of data produced
in these simulations is a big issue: visualization tools
have been developed to analyze these results; we
present in this paper the interface capabilities with
examples of visualization of simulations results for
cosmology and galaxy formation, interstellar
medium and magneto-hydrodynamics of stars
realized with local simulation codes.
We also present visualizations in other domains of
physics like fusion plasma or accelerators.
Finally, we recently developed our interface to
establish a cosmography of the Local Universe,
based on multiple data products including catalogues
of redshifts, peculiar velocities, reconstructed
density and velocity fields. On the basis of the
various visualization techniques offered by our
software, that rely on multicore computing and
OpenGL hardware acceleration, we have created
maps displaying the structure of the Local Universe
where the most prominent features such as voids,
clusters of galaxies, filaments and walls, are
identified and named.
2 THE SDVISION INTERFACE
The interactive, immersive, three-dimensional
visualization of complex large scientific datasets is a
real challenge.
Due to the complexity, the geometry or the size
of the calculations, the simulations codes are using
different numerical techniques, regular Cartesian
meshes or structures such as Adaptive Mesh
Refinement, spherical coordinates or multi-meshes
embedded in the geometry. The post-treatment
117
Thooris B. and Pomarède D..
Visualization of Large Scientific Datasets - Analysis of Numerical Simulation Data and Astronomical Surveys Catalogues.
DOI: 10.5220/0005300901170122
In Proceedings of the 6th International Conference on Information Visualization Theory and Applications (IVAPP-2015), pages 117-122
ISBN: 978-989-758-088-8
Copyright
c
2015 SCITEPRESS (Science and Technology Publications, Lda.)
software, and in particular the visualizing software
tool, must fulfil all these requirements, so a
visualization code has been developed inside the
COAST team: the SDvision code (Pomarède & al.
2008a) (Pomarède et al. 2009), which will be
described below.
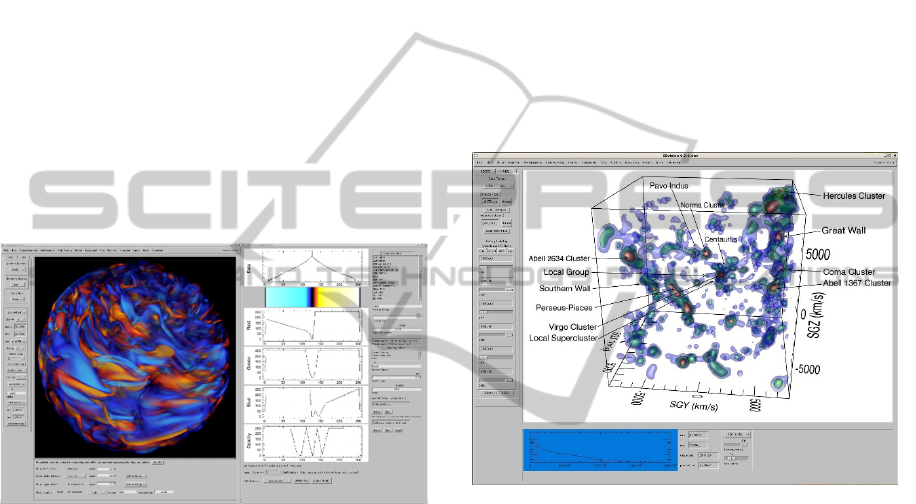
The SDvision graphical interface is implemented
as an interactive widget as displayed in (fig. 1&2) in
its running state. It benefits from hardware
acceleration through its interface to the OpenGL
libraries, including GLSL shaders. SDvision has
been developed in the framework of IDL Object
Graphics (IDL n.d.). IDL, the Interactive Data
Language, is a firmly-established software for data
analysis, visualization and cross platform application
development. IDL provides a set of tools for
developing object-oriented applications. A class
library of graphics objects allows to create
applications that provide equivalent graphics
functionality regardless of the computer platforms.
Figure 1: the SDvision interface used to visualize a MHD
simulation of turbulences in the convection zone of the
Sun.
Other powerful visualization codes exist and are
widely used in the astrophysics community, for
instance VISIT (VISIT n.d.) or PARAVIEW
(PARAVIEW n.d.). We developed our own tool
from scratch using IDL framework, for historical
reasons (IDL is the dominant platform for analysis
and visualization in the astrophysics community)
and as a consequence many home format reading
and data handling modules were readily available;
also, IDL provides mathematical and scientific
libraries which help both simulations visualization
and analysis. And even if using IDL needs licenses,
it exits also a virtual machine mechanism for non-
licensees users. About data formats, a migration to a
unique HDF5 format is in progress, but specific
readers for binary data are still needed.
Three-dimensional scalar and vector fields
distributed over regular mesh grids or more complex
structures such as adaptive mesh refinement data or
multiple embedded grids, as well as N-body
systems, can be visualized in a number of different,
complementary ways. Various implementations of
the visualization of the data are simultaneously
proposed, such as 3D isosurfaces, volume
projections, hedgehog and streamline displays,
surface and image of 2D subsets, profile plots,
particle clouds. The difficulty inherent to the hybrid
nature of the data and the complexity of the mesh
structures used to describe both scalar and vector
fields is enhanced by the fact that simulations are
parallelized. Large-scale simulations are conducted
on high-performance mainframes with potentially
thousands of processors associated with a non-trivial
domain decomposition.
Figure 2: The SDvision interface used to visualize the
reconstructed density field of redshift catalogues.
Parallelism is needed for the processing and the
visualization of large data sets; some elements of
parallelism are provided in IDL, for example we
benefit from a multiple-CPU implementation of the
IDLgrVolume class to render volume by ray-casting.
The development of SDvision was particularly
focused on the visualization of grid data produced
by finite volumes hydrodynamics codes; the
particles clouds are treated as mere 3D scatter plots,
typically in astrophysics for dark matter, or for
visualization of macro-particles in an accelerator (as
shown in section 4).
The SDvision software package, intended
primarily for the visualization of massive
cosmological simulations, has been extended to
provide an interactive visual representation of
different classes of redshift surveys. The various
possibilities offered by the tool in terms of filtering
of the data, reconstruction of density fields,
interactivity and visual rendering, are opening a new
IVAPP2015-InternationalConferenceonInformationVisualizationTheoryandApplications
118
domain of collaborations with astrophysics involved
in experiments collecting actual data.
The SDvision code is suitable for interactive and
immersive navigation for the analysis of 3D results
and also for videos and stereoscopic movies
productions for people at large.
3 SIMULATIONS IN
ASTROPHYSICS
The RAMSES code (RAMSES n.d.) (Teyssier & al.
2002) is designed as a N-body and hydrodynamical
code based on the Adaptive Mesh Refinement
(AMR) technique (Pomarède & al. 2008b)
(Labadens & al. 2011) (Labadens & al. 2012).
Hybrid simulations are performed using the
RAMSES code to study cosmological large scale
structures and galaxy formations (fig. 3). RAMSES
code simulations in cosmology need thousands of
processors running in parallel during several weeks
and producing tens of Terabytes of data.
The RAMSES code, relying on the Adaptive
Mesh Refinement technique, is used to perform
massively parallel simulations at multiple scales.
The interactive, immersive, three-dimensional
visualization of such complex simulations is a real
challenge.
The analysis of results from complex MHD and
N-body AMR-Octree code for cosmological
simulations implies two steps of processing as we
need Cartesian grids as input for multithreading
processing. The highest levels of the AMR
resolution are reached by successive and
synchronous spatial and resolution zooms, using an
interactive definition of the sub-volume in which the
AMR extraction is performed. New algorithms are
studied for direct reconstruction of images from the
AMR-Octree structures, to avoid using intermediate
Cartesian grids.
The SDvision tool provides a visualization of the
scenes though either an OpenGL, hardware-based
rendering or through a pure software computation.
Several rendering techniques are available, including
ray-casting and isosurface reconstruction, to explore
the simulated volumes at various resolution levels
and construct temporal sequences. These techniques
are illustrated in the context of different classes of
simulations.
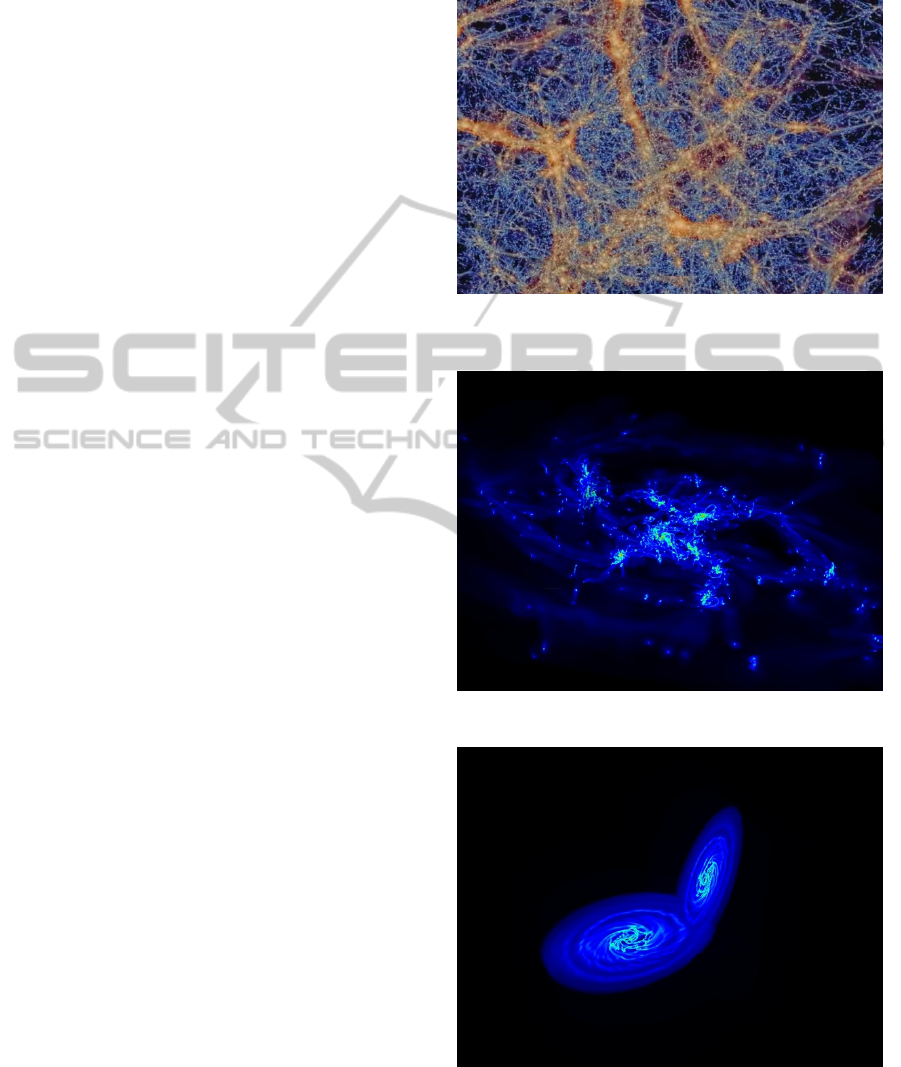
RAMSES was used most recently in the studies
of galaxies formations (Bournaud 2010) (Chapon &
al. 2010). A first example of high-resolution
simulation of a galaxy disk is shown in fig. 4. The
image represents the density of the baryon gas in a
galaxy disk. Fig. 5 shows a simulation of galaxies
collision.
Figure 3: Simulation in cosmology: large structures of the
universe.
Figure 4: High-resolution simulation of a galaxy disk.
Figure 5: Simulation of galaxies collision.
As another example of astrophysical numerical
analysis code, the HERACLES (Gonzalez & al.
VisualizationofLargeScientificDatasets-AnalysisofNumericalSimulationDataandAstronomicalSurveysCatalogues
119
2007) (Audit & al. 2005) 3D code is mixing
hydrodynamics and radiative transfer studies on
Cartesian grids, using the finite volumes method.
The HERACLES biggest simulation has been
performed in the framework of the Grands Défis
CINES 2010 on 2500 processors of the Jade
machine in CINES Computing Center in
Montpellier, France. The run simulated the
Interstellar Medium turbulences in a
2000x2000x2000 cube, using 8 billion cells. The
simulations generated 15TB of data, and allowed
high resolution images and videos for stereoscopic
visualization systems, thanks to SDvision. (fig. 6)
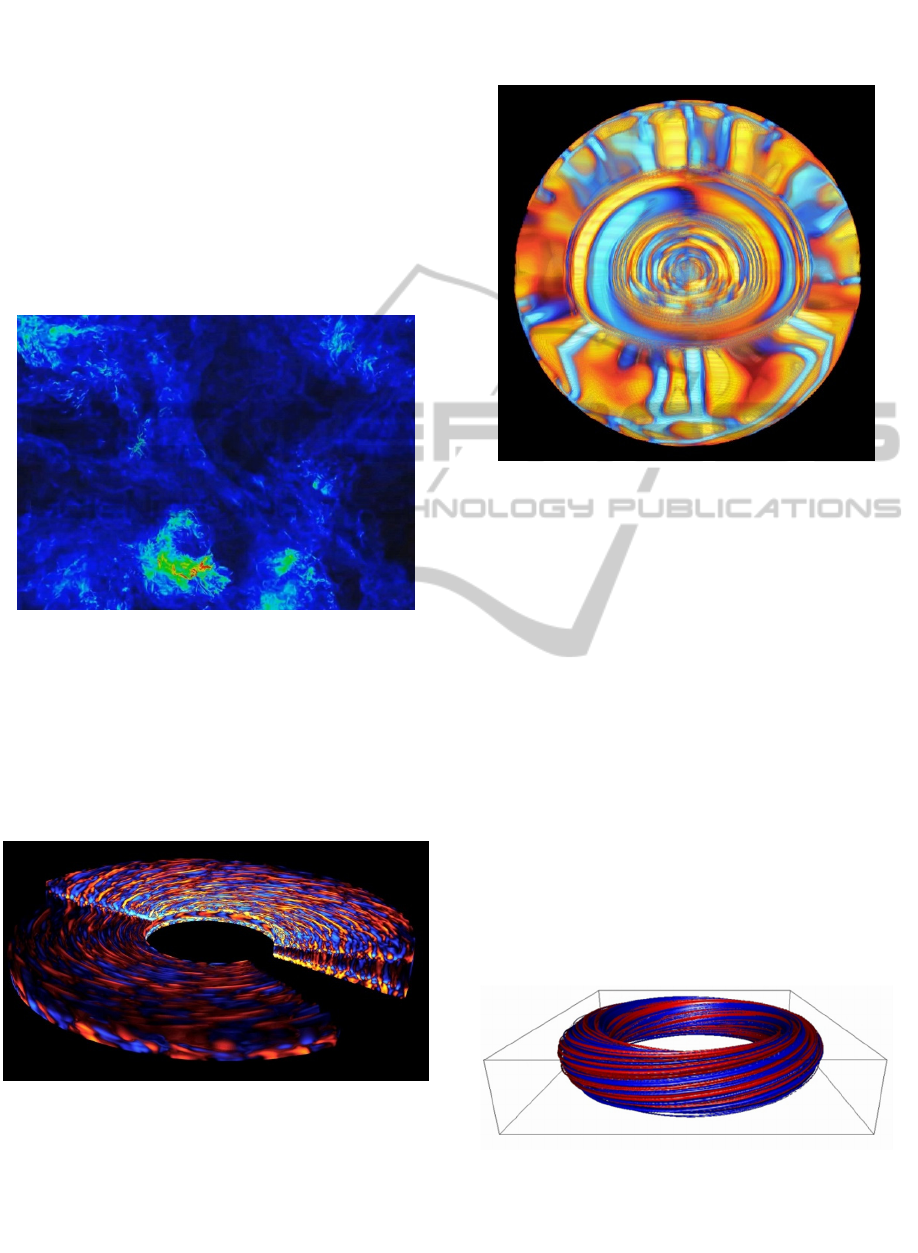
Figure 6: Simulation of turbulence in the interstellar
medium.
Using the PLUTO code (PLUTO n.d.), a freely-
distributed software for the numerical solution of
partial differential equations, astrophysicists can
simulate turbulences inside a protoplanetary disk;
after interfacing the code with SDvision, we obtain
nice views of the simulation (fig. 7).
Figure 7: Simulation of MHD inside a protoplanetary disk.
The anelastic spherical harmonic code ASH (Brun &
al. 2004) (STARS2 n.d.) solves the three-
dimensional anelastic equations of motion in a
rotating spherical geometry using a pseudospectral
semi-implicit approach. The code is used in our
institute to study the Magneto-Hydrodynamics of the
Sun. SDvision provides also nice images and videos,
after some work on the coordinates (fig. 8).
Figure 8: Simulation of magnetism in the Sun.
4 PLASMA AND
ACCELERATORS PHYSICS
To understand the behavior of the plasmas in the
next generation of tokomaks, like ITER, simulations
are performed with the GYSELA code (Grangirard
& al. 2007), developed at CEA/IRFM Cadarache,
with the goal to reduce the turbulences for
improving performances in these machines. The
GYSELA simulation performed in the framework of
the Grands Défis CINES 2010 was the largest
simulation ever realized on the ITER model. The
simulation used 272 billion cells in the 5-
dimentional mesh and had run one month on 8192
processors of the Jade machine in CINES. The code
used 27GB by node and generated more than 6TB of
data. Fig. 9 represents in 3D the electrostatic
potential fluctuations inside the torus.
Figure 9: Simulation of the turbulences inside the ITER
plasma.
The EVEDA (Engineering Validation and
IVAPP2015-InternationalConferenceonInformationVisualizationTheoryandApplications
120
Engineering Design Activity) linear accelerator is
being studied and constructed in Europe, to be
installed in Japan. It accelerates Deuteron particles
to the energy of 9 MeV. It is the full scale prototype
of the first phase of the IFMIF (International Fusion
Materials Irradiation Facility) project. IFMIF
(Thooris & al. 2014) is a Europe-Japan joint project
aiming at constructing an accelerator-based neutron
source, the world's most intense one, dedicated to
study materials that must withstand the intense
neutron flux coming from the fusion plasma of
future tokamaks.
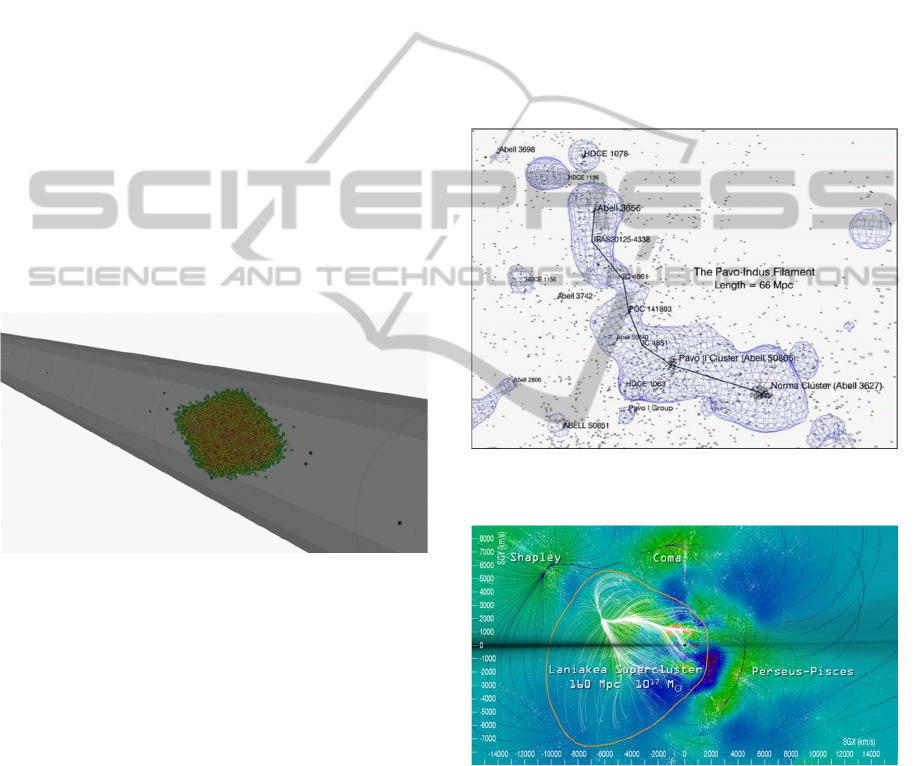
Simulations were made with a million particles,
which need some tens of hours computing, using
TraceWin, a beam transport code developed at
IRFU. The visualization itself takes some hours
computing with the SDvision code. Visualization is
needed to analyze in details the results in each part
of the accelerator (fig. 10). The resulting video was
shown at IFMIF international workshops. It is also a
good support for outreach and a 15-minute movie is
permanently shown on a 3D TV in a special
showroom of our institute.
Figure 10: Visualization of the particle beam in the IFMIF
accelerator.
5 ASTRONOMICAL SURVEYS
CATALOGS
Cosmography is the creation of maps of the
Universe. Using the SDvision code, we have
established a cosmography of the Local Universe,
based on multiple data products from the Cosmic
Flows Project (COSMICFLOWS n.d.). These data
include catalogues of redshifts, catalogues of
peculiar velocities, and reconstructed density and
velocity fields (fig. 11).
Maps also display the dynamical information of
the cosmic flows, which are the bulk motions of
galaxies, of gravitational origin. These maps
highlight peculiar conformations in the cosmic flows
such as the streaming along filaments, or the
existence of local attractors (Courtois & al. 2013)
(COSMOGRAPHY n.d.).
In a very recent study made with SDvision (Tully
& al. 2015) (LANIAKEA n.d.) , locations were
found where peculiar velocity flows diverge, as
water does at watershed divides, and we could trace
the surface of divergent points that surround us.
Within the volume enclosed by this surface, the
motions of galaxies are inward after removal of the
mean cosmic expansion and long range flows. This
defines a supercluster to be the volume within such a
surface, and so this is defining the extent of our
home supercluster, which name is Laniakea (fig.
12).
Figure 11: A three-dimensional immersive visualization
showing one surface level of a reconstructed density field.
Figure 12: Definition of our home supercluster Laniakea.
6 CONCLUSIONS
If the development of the SDvision visualization
code was basically motivated by the need of
analyzing the results (and sometimes detecting
computing bugs) from huge amounts of data with
complex structures, the production, thanks to the
VisualizationofLargeScientificDatasets-AnalysisofNumericalSimulationDataandAstronomicalSurveysCatalogues
121

interface, of images, videos and stereoscopic movies
in the domain of astrophysics simulation have
caused a lot of requests for communication with the
general public.
Several movies generated by SDvision have been
screened in exhibitions, museums and in our 3D
room for visitors at Saclay. A new dedicated room
has been equipped in our laboratory for the
projection of astrophysical stereoscopic movies
generated.
Due to the increasing production of data
simulations and demand on analysis of bigger and
bigger surveys catalogues, an effort is now in
progress to speed up the code for images generation,
especially with the use of OpenGL shaders.
ACKNOWLEDGEMENTS
Authors are grateful to the astrophysicists of the
COAST team and other physicists or astronomers
for providing simulations or surveys data
REFERENCES
Audit, E., Pomarède, D., Teyssier, R., Thooris, B.,
Numerical Simulations of Astrophysical Plasmas:
status and perspectives of the Saclay/DAPNIA
software project, Proceedings of the First CalSpace-
IGPP International Conference on Numerical
Modeling of Space Plasma Flows, ASTRONUM2006,
Palm Springs CA, USA, March 27-30,2006, ed. N.V.
Pogorelov and G.P. Zank, the Astronomical Society of
the Pacific Conference Series, vol.359 (2006), 9-14,
ISBN:978-1-583812-27-3.
Audit, E., Hennebelle, P., Thermal Condensation in a
Turbulent Atomic Hydrogen Flow, Astronomy and
Astrophysics, 433, 2005, 1-13.
Bournaud, F., et al. ,Hydrodynamics of high-redshift
galaxy collisions: From gas-rich disks to dispersion-
dominated mergers and compact spheroids, eprint
arXiv:1006.4782, June 2010.
Brun, A.S., Miesch, M.S., Toomre, J., , Global-scale
turbulent convection and magnetic dynamo action in
the solar envelope, The Astrophysical Journal,
614:1073, 2004 October 20.
Chapon, D., Teyssier, R., Bournaud, F., The Driving
Mechanism of Starbusts in Galaxy Mergers. The
Astrophysical Journal Letters, Vol. 720, Issue 2, pp.
L149-L154(2010).
COAST http://irfu.cea.fr/projets/COAST.
Cosmicflows
http://www.ipnl.in2p3.fr/projet/cosmicflows/
Cosmography http://irfu.cea.fr/cosmography.
Courtois, H., Pomarède, D., Tully, R.B., Hoffman, Y.,
Courtois, D., Cosmography of the Local Universe, The
Astronomical Journal, 146 (2013) 69.
González M., Audit E., Huynh P., HERACLES: a three-
dimensional radiation hydrodynamics code, 2007,
A&A, 464, 429.
Grandgirard, V., et al., Global full-f gyrokinetic
simulations of plasma turbulence. Plasma Physics and
Controlled Fusion, 49(12B) :B173, 2007.
IDL http://www.ittvis.com/idl.
Labadens, M.; Chapon, D.; Pomarède, D.; Teyssier, R.,
Visualization of Octree Adaptive Mesh Refinement
(AMR) in Astrophysical Simulations, Proceedings of
ADASS XXI, ( Paris, France, 6-11 October 2011).
Labadens, M., Pomarède, D., Chapon, D., Teyssier, R.,
Bournaud, F., Renaud, F., Grandjouan, N, Volume
Rendering of AMR Simulations , Proceedings of
ASTRONUM 2012 (Big Island, Hawaï, USA, June 25-
29 2012).
Laniakea http://irfu.cea.fr/laniakea.
PARAVIEW http://www.paraview.org/
PLUTO http://plutocode.ph.unito.it.
Pomarède, D., Fidaali, Y., Teyssier, R., Visualization of
Hybrid, N-body and Octree-based Adaptive Mesh
Resolution Parallelized Simulations, Proceedings of
5th International Conference 'Computer Graphics,
Imaging and Visualization' (august 25-28 2008,
Penang, Malaysia) ISBN: 978-0-7695-3359-9, p. 295.
Pomarède, D., Fidaali, Y., Audit, E., Brun, A.S.,
Masset, F., Teyssier, R., Interactive visualization of
astrophysical plasma simulations with SDvision,
Proceedings of the IGPP/DAPNIA International
Conference on Numerical Modeling of Space Plasma
Flows, ASTRONUM2007, Paris, France, June 11-15,
2008, ASPCS 386 (2008) 327.
Pomarède, D., Fidaali, Y., Teyssier, R., A Visual Insight
into the Horizon Simulation at MareNostrum,
Proceedings of the IGPP/DAPNIA International
Conference on Numerical Modeling of Space Plasma
Flows, ASTRONUM2008, Saint John, US Virgin
Islands, June 8-13, 2008, ASPCS 406 (2009) 317.
RAMSES
http://www.ics.uzh.ch/~teyssier/ramses/RAMSES.html.
STARS2 http://www.stars2.eu/computing.htm.
Teyssier, R., Cosmological hydrodynamics with adaptive
mesh refinement - A new high resolution code called
RAMSES , Astron. Astrophys., 385 (2002) 337-364.
Thooris, B., Audit, E., Brun, A.S., Fidaali, Y., Masset, F.,
Pomarède, D., Teyssier, R., 2009 The COAST Project:
a Program of Massively Parallel Numerical
Astrophysics Simulations, Proceedings of the HPC-
Asia 2009 conference (march 2-5, Kaohsiung,
Taiwan) ISBN:978-986-85228-0-0, p. 642.
Thooris, B., Nghiem, P.A.P., Pomarède, D., Visualization
of Particle Beam Simulations in the IFMIF-EVEDA
accelerator, SC14 supercomputing conference, New-
Orleans, 17-20 November 2014.
Tully, R.B., Courtois, H., Hoffman, Y., Pomarède, D.,
Laniakea: Our Supercluster of Galaxies, Nature, 513,
71-73 (4
th
September 2014).
VISIT https://wci.llnl.gov/codes/visit.
IVAPP2015-InternationalConferenceonInformationVisualizationTheoryandApplications
122
