
Semi-automatic Analysis of Huge Digital Nautical Charts
of Coastal Aerial Images
Matthias Vahl
1
, Uwe von Lukas
1
, Bodo Urban
1
and Arjan Kuijper
2
1
Fraunhofer IGD, Joachim-Jungius-Str. 11, Rostock, Germany
2
Fraunhofer IGD, Fraunhoferstr. 5, Darmstadt, Germany
Keywords:
Semi-automatic Analysis, Electronic Nautical Charts, Coastal Aerial Images.
Abstract:
Geo-referenced aerial images are available in very high resolution. The automated production and updating
of electronic nautical charts (ENC), as well as other products (e.g. thematic maps), from aerial images is a
current challenge for hydrographic organizations. Often standard vision algorithms are not reliable enough
for robust object detection in natural images. We thus propose a procedure that combines processing steps
on three levels, from pixel (low-level) via segments (mid-level) to semantic information (high level). We
combine simple linear iterative clustering (SLIC) as an efficient low-level algorithm with a classification based
on texture features by supported vector machine (SVM) and a generalized Hough transformation (GHT) for
detecting shapes on mid-level. Finally, we show how semantic information can be used to improve results from
the earlier processing steps in the high-level step. As standard vision methods are typically much too slow
for such huge-sized images and additionally geographical references must be maintained over the complete
procedure, we present a solution to overcome these problems.
1 INTRODUCTION
Nowadays, the production of digital nautical charts
and paper charts is partially carried out from a com-
mon data base. By this, redundancies are avoided and
the production of thematic charts is accelerated. How-
ever, the first acquisition as well as the update of this
data base from geo-referenced aerial images are both
still time- and cost-consuming manual processes. In
this paper we show how one can use computer vision
tools for a semi-automatic analysis of aerial images.
The basic idea is to develop a processing procedure
consisting of five processing steps. Simple image pro-
cessing techniques which detect single object are un-
suitable for this complex input data. It is necessary to
use domain-specific knowledge by model-based ap-
proaches. Especially combining low-level vision for
detection and high-level approaches for interpretation
seems to be promising. In this paper we present the
following contributions to tackle these problems:
1. We propose an efficient and effective segmenta-
tion and recognition method for areas and areal
objects (areas like land and water) and particularly
shaped objects (parametric objects like groins or
piers).
2. We use information from inter-object relation-
ships to improve the recognition rate
3. We deal with process-specific problems, namely
data import and preparation (import and prepara-
tion of huge data amounts so that computer vision
algorithms can access them efficiently) and data
export and geo-referencing (we are able to store
detected objects and can keep the geo-references
– or make a reverse transformation).
After a discussion of related work we present our
approach containing the aforementioned three levels.
It is followed by an evaluation and the conclusions.
2 RELATED WORK
Bicego et al. present a color separation method within
the HSI (Hue, Saturation, Intensity) color space com-
bined with a following region growing with hystere-
sis threshold mechanism (Bicego et al., 2003). By
using the HSI color space a good separation between
chominance (hue and saturation) and intensity can be
reached. These channels are more concise. After-
wards, they use a very conservative threshold to seg-
ment the hue channel. This initial segmentation is the
100
Vahl M., von Lukas U., Urban B. and Kuijper A..
Semi-automatic Analysis of Huge Digital Nautical Charts of Coastal Aerial Images.
DOI: 10.5220/0005301501000107
In Proceedings of the 10th International Conference on Computer Vision Theory and Applications (VISAPP-2015), pages 100-107
ISBN: 978-989-758-091-8
Copyright
c
2015 SCITEPRESS (Science and Technology Publications, Lda.)
input for a region growing algorithm. They achieve
acceptable results with a probabilistic contour track-
ing approach to detect roads in housing developments
areas. To detect roads and other contours (Isard and
Blake, 1998) propose a probabilistic tracking based
on a modified jet stream resp. condensation approach.
Furthermore, (Xiao et al., 2008) present an approach
for extracting and applying a semantic layer from
low-height aerial images. The extraction of roads
without a-priori-knowledge is a big challenge. Thus
they use additionally correlated GIS information. The
registration step is done by a histogram correlation.
Whereas Xiao et al. try a model-based approach for
object extraction, (Straub et al., 2000) and (Ogawa
et al., 2000) use access to given maps and GIS in-
formation. (Letitia and Monie, 2008) show the seg-
mentation of satellite images by using adaptive neigh-
borhood mathematical morphology, which works on
multi-scale images. Moreover, (Galindo and Moreno,
2009) apply the algorithm of Otsu on a single color
channel to detect swimming pools from aerial images.
Afterward a refinement of the result is done by using
active contours models (Kass et al., 1988). (Sirmacek
and Unsalan, 2008) describe how to use Otsu’s algo-
rithm to automatically detect red roofs. Furthermore,
they describe how shadows cause conspicuous pat-
terns in the blue channel. Before they use the thresh-
old, an amplification is applied. (Vahl and von Lukas,
2013) adapt the blackboard metaphor introduced in
(Velthuijsen, 1992), for an semi-automated recogni-
tion of fac¸ades from oblique aerial images. Various
detection and processing algorithms – the experts –
are semantically coupled by the domain-specific grid
graph data model – the blackboard.
The algorithms can logically be combined but
have only weak dependencies between each other. In
summery, none of these approaches is able to solve
the problems mentioned in the Introduction com-
pletely. We thus present a procedure to couple meth-
ods on low to high level computer vision tasks to
analyze these huge digital nautical charts based on
coastal aerial images.
3 OUR APPROACH
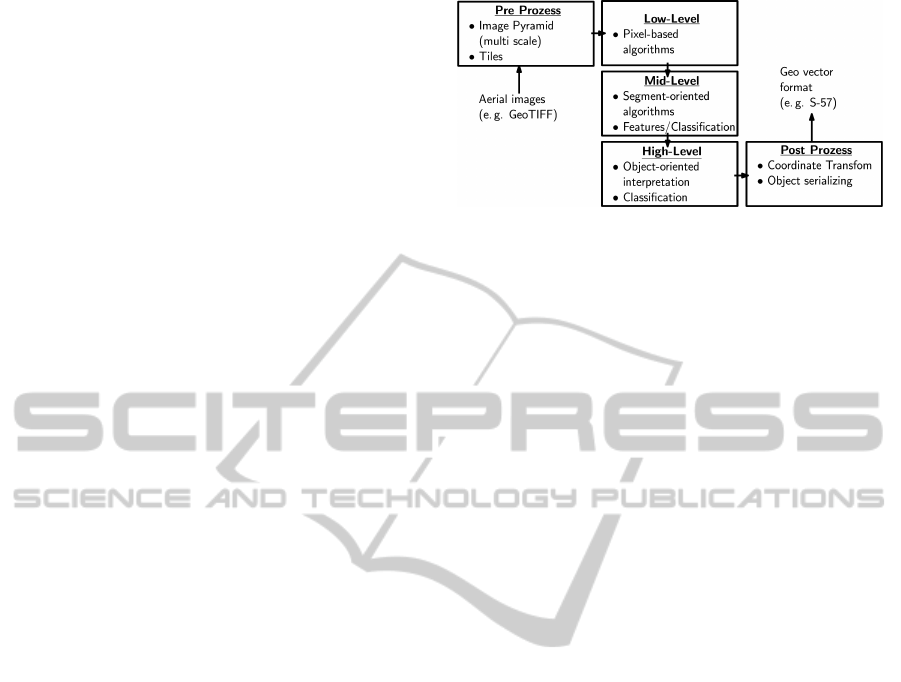
To solve the sketched problems we propose a process-
ing procedure (see Figure 1) with the following five
steps:
1. In the pre-processing step image data is prepared
to be suitable for next 3 computer vision steps.
2. The low-level step collects pixels into segments
3. The mid-level step merges segments into semantic
Figure 1: Our proposed processing procedure, consisting
of a pre-processing step, three computer vision steps, and a
post-processing step.
objects
4. The high-level step interprets inter-object rela-
tionship to improve earlier steps
5. In the post-processing step results from the vision
processing steps 2–4 are transformed back to geo-
graphical coordinates and recognized objects will
be serialized into a geographical vector format.
Starting point of the whole process are aerial
images. Throughout this paper we use those pro-
vided by Bundesamt f
¨
ur Geod
¨
asie und Karthographie
(BSH, German Federal Agency for Cartography and
Geodesy). They have a resolution of 20 cm per pixel
(px) as ECW (Enhanced Compressed Wavelet) com-
pressed GeoTIFF. The coast of Germany is divided by
the BSH into nautical charts. The sample GeoTIFF
we use in the examples is the chart ”Elbm
¨
undung”,
where the Elbe river flows into the North Sea. It has
a size of 271 977×187 340 px
2
which is equivalent
to 54×37 km
2
, or approx. 51 Gpx. Because of this
huge size, standard computer vision algorithms will
not work properly on this data. A reorganization of
the data is thus necessary.
The second step of the process chain is the low-
level step that works on pixel level. The entropy of
one pixel is very low in opposite to their quantity. So a
fast algorithm for collecting pixels with similar prop-
erties is needed. Results of this step are segments.
Important is that one segment belongs completely to
one object. Oversegmentation – one object consists
of several segments – is unproblematic.
Segments build the starting point for mid-level al-
gorithms. Their task is to combine segments to ob-
jects. An object is the smallest exportable informa-
tion unit. Objects have a big morphological variance.
There are objects that represent an area such as water
or grassland by multi-polylines, but also by more or
less simple shapes, such as rectangles, circles.
The most complex step of the process chain –the
high-level step– aims at bringing detected objects into
relation and resolving ambiguities by including con-
Semi-automaticAnalysisofHugeDigitalNauticalChartsofCoastalAerialImages
101

text information. In this step groups of objects (e. g.
groins or wind farms) can be recognized by using
characteristic properties (distance to each other, di-
rection, shape).
The last process step –the post processing step–
transforms the positions of known objects from the
image space coordinate system. This step is necessary
because of the image processing algorithms working
on the smaller, Cartesian image space. The target
systems need geographical referenced objects, e. g.
WGS 84. Finally the computer-internal representa-
tion of detected objects is transformed into a neutral
exchange format like the IHO S-57, a standard of In-
ternational Hydrographic Organization (IHO) for the
digital exchange of nautical, hydrographic and bathy-
metric information.
3.1 Pre Processing
Taking into account that aerial images are very data
intensive it is necessary to divide them into smaller
pieces. Here, we use image pyramids with different
resolution layers consisting of 1024×1024 px
2
-sized
tiles, see Figure 2.
Figure 2: Image pyramid. Resolution decreases from bot-
tom to the top.
In addition, we later on need to merge partial ob-
jects of bigger objects that lay in two or more tiles.
This size enables a (MATLAB) script to work for pro-
totyping with acceptable response times. While di-
viding large data sets into pieces it is important to
keep geo-references. This is done by using some tools
from the Geospatial Data Abstraction Library Project
(GDAL).
Table 1 shows resolution, edge length of tiles, as
well as average memory usage. At the highest pyra-
mid level the data volume is shrunken by a factor of
16, memory usage as calculated by a factor of 256 but
in real by (“only”) a factor 232. The computation time
saved depends on the complexity of the algorithms.
3.2 The Computer Vision Steps
As shown in Figure 1 and listed above, the proposed
computer vision processing steps can be divided into
three steps: collecting pixels to segments, merging
segments into semantic objects and interpreting inter-
object relationship to improve earlier steps. In the fol-
lowing sections we describe each step in detail.
3.2.1 The Low-level Step (Pixels to Segments)
As already mentioned in the related work section,
threshold-based methods work on the distribution (in-
tensity of gray level or one or more color channel)
of pixels. Methods that work more globally were ne-
glected because of the different exposure of the source
material, the low contrast, and the large number of ob-
ject classes. Hue-based methods for water detection,
proposed in the literature, e.g. (Galindo and Moreno,
2009), do not work for the North Sea conditions. For
shallow water the blue part is too low, for dried-up
mud flats it is absent. But also deep water of e.g.
the harbors has not enough intensity in the blue chan-
nel, because of the enrichment with sediments. It thus
can not be detected by classical water detection meth-
ods. Therefore, hue-based approaches using a global
threshold are not suitable. Furthermore, objects from
different object classes differ not only in the color
property but also in color and texture.
For these reasons we argue that it is more pro-
ductive to apply a region-based segmentation which
is working with local thresholds. Typical representa-
tives of this algorithm family are the watershed ap-
proach (Huguet et al., 2004) or – a little bit newer –
the simple linear iterative clustering (SLIC) approach
(Achanta et al., 2010). In literature (e.g. (Achanta
et al., 2012)) SLIC is rated better than other ap-
proaches. It is available as C++ library (Vedaldi and
Fulkerson, 2008) for different platforms and many
programming language bindings, especially MAT-
LAB. Ozden et al. (Ozden and Polat, 2007) show a
promising approach using color, texture and space in-
formation for segmentation, but unfortunately no im-
plementation is provided. With a given region size
and regularization behaviour the contours of the rel-
evant object are exactly traced. The resulting over-
segmentation is not problematic and will be treated
in the next step – the mid-level step. SLIC uses hue
information only implicitly. A results of SLIC seg-
mentation can be seen in Figure 3.
3.2.2 The Mid-level Step (Segments to Semantic
Objects)
The mid-level step depends on the kind of objects we
have to recognize. One can choose between areal ob-
jects, such as water or farmland, and shaped objects,
such as buoys, groins or other coastline constructions.
For the first one the texture in the foreground is impor-
tant, whereas for the second one the shape is relevant.
VISAPP2015-InternationalConferenceonComputerVisionTheoryandApplications
102
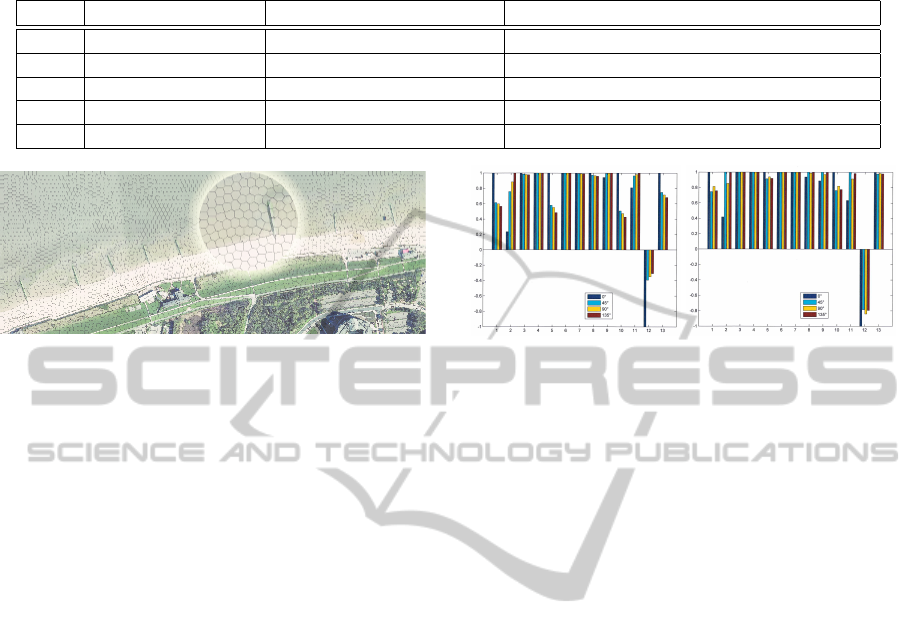
Table 1: Resolution steps of the quadratic tiles. The average memory usage per kilometer for the given test area and using the
lossless compression LZW.
Level Resolution [cm/px] Edge length of the tile [m] Average memory usage per area [MB/km
2
]
0 20 205 58,00
1 40 410 16,00
2 80 820 4,00
3 160 1640 1,00
4 320 3300 0,25
Figure 3: The SLIC (Vedaldi and Fulkerson, 2008) algo-
rithm clusters pixels on base of their color and neighbour-
hood.
Areas – Areal Objects. The starting point for the
detection of areas are groups of pixels clustered into
segments (done in the previous low-level step). On
the one hand for every segment known texture fea-
tures exist and on the other hand important properties
are integrated by the clustering, e.g. the color. The as-
signment of segments to an object class and the merg-
ing of segments from the same class is done within
the classification step. First, significant features must
be selected. Figure 4 compares normalized Haralick
features (Haralick et al., 1973) of the land class to
features of water class. One can see that there are
significant features, but also features with the same
characteristics. For a feature selection further statis-
tical properties must be taken into account, e. g. low
variance. In case of many classes an automated fea-
ture selection can be used, but in here it suffices to
choose the features manually. Based on Figure 4 a
good choice is to take feature 1, 2, 3, 4, 5 and 9. For
classification a supported vector machine (SVM) in
one-against-one mode is used. Due to the the low
number of classes the use of a decision tree is not nec-
essary.
Shaped Objects. In contrast to detecting areas, for
which texture features play an important role, for de-
tecting shape objects we additionally use contour in-
formation. We do not extract this from edge-detected
images because standard methods such as Canny get
problems with vast-structured images. We there-
fore build contours by merging neighboring segments
which belongs to the same class. Afterward we take
the contour of this objects for the further analysis.
Figure 4: Different characteristic of the normalized Hara-
lick features in four directions.
It is well-known that the Hough transformation is
limited suited because it requires a shape parametriza-
tion. Therefore, we use an own implementation of
the Generalized Hough Transformation (GHT) which
has the advance to work efficiently for parametrized
shapes. On the basis of the template similar objects
will be detected by GHT.
Tests with this approach are done for different
kinds of groins (see Figure 5). The results for standard
groins in resolution step 1 (40 cm/px, see Table 1) are
very satisfying. For buoys and other small objects we
have to use resolution step 0 (20 cm /px).
Reduction of the Search Space. Since the Hough-
Transformation is a kind of brute force approach, the
memory usage and the computing time is relatively
vast. Here speeding up by hardware (e.g. general pur-
pose graphical processing units), strategies that limits
the search space and optimization of the algorithms
can help.
The reduction of the space that has to process cal-
culation can accelerated massively, depending on the
object class. For example, buoys are only located on
water areas. It is further necessary to bring the ob-
ject classes in a hierarchical structure to enable fast
methods. Without knowledge about the coastal zone
however, this is impossible. We therefore introduce
the geometry type GT , which the S-57 object classes
classifies by geometrical criteria (see Figure 6).
Search spaces S are defined by space-defining ob-
ject, such as water-land-line or meta data like harbour
region. For every geometry type GT , a probability
of occurrence p(GT,ST ) per search space type ST is
given. In the case that p(GT, ST ) > 0, for every space
Semi-automaticAnalysisofHugeDigitalNauticalChartsofCoastalAerialImages
103
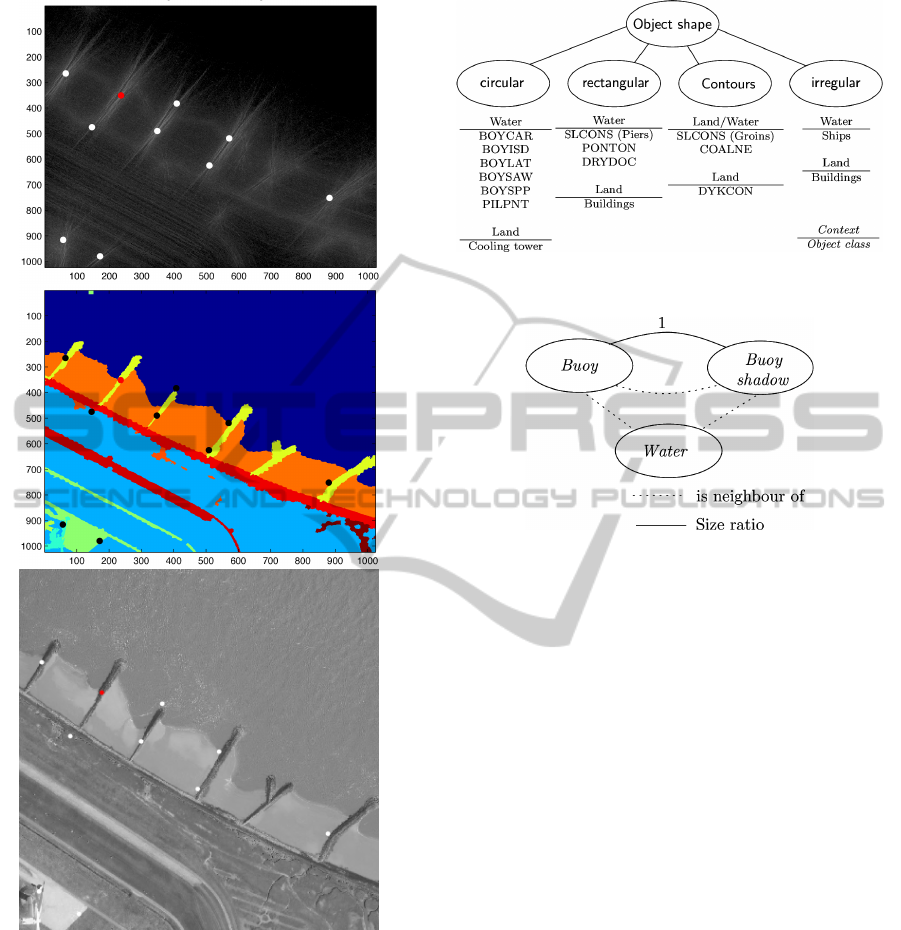
Figure 5: Generalized Hough Transformation (Search
space: Scale s: 0.5 ≤ s ≤ 2 with increment 0.5 and rotations
ϕ: 0 ≤ ϕ ≤ 2π with increment π/10). Top: Hough space and
maxima. Middle: Segmented image with projected max-
ima. Bottom: Original image with projected maxima.
of the space type ST the search algorithm for geom-
etry type OT
1
,..., OT
n
is applied. This reduces the
calculating costs damatically, but it needs formalized
knowledge about the domain. Figure 6 shows the sort-
ing of object classes by shape.
Table 2 exemplary shows when the probability of
occurrence is null and which object in which region
can expected. The probability must be determined by
Figure 6: Sorting of S-57 object classes (selection) by shape
(geometry type) and context.
Figure 7: Graphical representation of semantic information.
There are relationships between buoys and theirs environ-
ment.
test data or must be estimated.
3.2.3 High-level Step (Objects to Scene)
One object class family that needs to be recog-
nized are buoys, especially lateral buoys (S-57 object
identifier BOYLAT). These objects are very small.
Their resolution is of only a few pixels. They are
surrounded by water and usually have a significant
shadow that also is surrounded by water. The rea-
son for this is that normally, aerial images are taken
on cloudless sunny days. The buoy shape maybe dis-
torted perspectively, depending on the distance to the
optical center. The size and direction of the shadow
depend on the illumination situation, especially the
weather and the solar altitude.
Buoys and shadow of buoys induce – in contrast
to the surrounding water – conspicuousness within the
color space. Corresponding to its color (green or red)
there is a significant shift in the color channel resp.
within the saturation of the buoy’s shadow. This prop-
erty and relationship can visualized and problemati-
cally formulated (see Figure 7).
Figure 8 and Figure 9 show the results of the ex-
periments for two different S-57 object classes. The
detection works fine and regarding the context the al-
gorithm can infer the object class. As result position
VISAPP2015-InternationalConferenceonComputerVisionTheoryandApplications
104
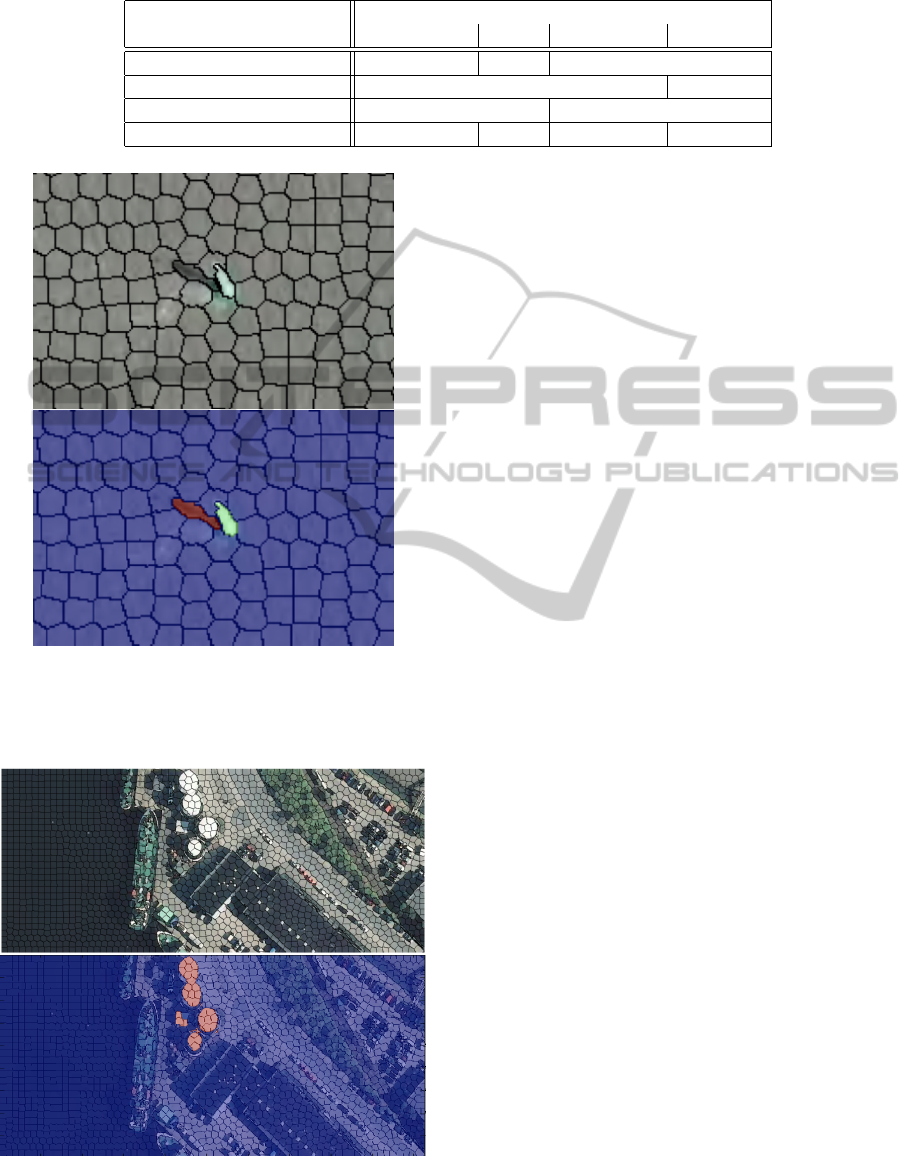
Table 2: Search space types.
1.6cmGeometry type GT Search space type ST
Coastal strip Water Harbour Land
rectangular groin p = 0 buildings, pontoons, cars
circular (small) buoy p = 0
circular (big) p = 0 silo/tank, cooling tower
irregular p = 0 ships ships, hulks p = 0
Figure 8: Detection of lateral buoys. Top: Aerial image af-
ter step 3 pixels to segments. Bottom: After step 4 segments
to objects. Conspicuousness within the color spectrum: low
saturation (shadow of the buoy), enhanced green (buoy).
Figure 9: Detection of land-side silos. Top: Aerial image
after step 3 pixels to segments. Bottom: After step 4 seg-
ments to objects.
we can use the base point of the buoy body or the mid-
dle point of the parting line between the buoy and the
buoy’s shadow. We transform this position from im-
age coordinates to geographical coordinates and take
the color as object attribute (e. g. in IMO S-57 BOY-
LAT: BOYSHP=?, COLOUR=green). Assuming that
the error in the image space is 15 px the maximum
deviation is between 1 and 3 meters. Buoys have a
specific shape respectively silhouette that allows the
sailor to identify the kind of buoy against poor light-
ning condition. The shape of the buoy cannot be re-
constructed since the perspective is nearly orthogonal
so that we only detect that the buoy is circular. Since
buoys are optimized for horizontal perspectives this is
not a problem.
3.3 Post Processing
In the post processing step we have to transform the
object position back from the image coordinate sys-
tem to a geographical coordinate system. Further-
more, we have to export the own internal data model
to a vector-oriented geo data exchange format.
4 EXPERIMENTS
First, we implemented our approach as a prove of con-
cept in MATLAB. Table 3 shows the accuracy of the
SLIC segmentation followed by an SVM classifica-
tion based on the selected Haralick features. In this
matrix the values show how well classes can be sep-
arated. For example, all water segments are distin-
guished from land segments. To divide between road
and farmland2 the algorithm reaches 87 %, but be-
tween road and farmland1 it yields 55 % only, as they
are rather identical.
The recognition rate for areal objects is generally
between 60 and 100 % and for the relevant areas be-
tween 83 and 100 %. Only the separation of roads and
land is 78 %. For the examined shaped objects the de-
tection rate is more than 80 %. The exactness is very
high. On the best resolutions (level 0) on contours al-
most pixel exactness (20 cm) is reached for the testing
region. On lower resolution the correct segmentation,
Semi-automaticAnalysisofHugeDigitalNauticalChartsofCoastalAerialImages
105

Table 3: SLIC and SVM: Selection of Haralick features 1, 2, 3, 4, 5, 7 with indirectly regarding the hue value by the SLIC
algorithm. The important textures can be distinguished well to very well.
% Land Other Road Grassland Farmland1 Farmland2
Water 100 100 99 60 89 65
Land – 96 78 83 50 85
Other – 77 99 80 97
Road – 86 55 87
Grassland – 87 74
Farmland1 – 86
especially of small objects, fails frequently, because
some segments are too small for a texture analysis by
Haralick’s method.
Table 4: Number of segments in the disjunctive training
data set M
train
and test data set M
test
.
Class Number of Segments
|M
train
| |M
test
| Σ
Water 22 133 155
Land 9 46 55
Other 14 3 17
Road 45 9 54
Grassland 299 121 420
Farmland1 72 39 111
Farmland2 477 32 509
Table 4 shows the number of segments in the dis-
junct training and test data sets.
Our classification yields good to very good re-
sults for the assignment to object classes and objects.
Using texture features in combination with an SVM
makes this approach robust. The complexity is quite
high, because for every resolution level a feature set
must be selected and an SVM must be trained. For
this scenario we concentrated on fewer classes. For an
increasing number of classes we could use concepts
like decision trees. Calculating costs for determining
the texture features is quite high but can be optimized
by better feature selection and speed-up by hardware.
Calculating of features can be easily done in parallel.
5 CONCLUSIONS
We presented a method combining processing steps
on three levels, from pixel (low-level) via segments
(mid-level) to semantic information (high level) to
analyze geo-referenced aerial images. As these im-
ages typically have very high resolution, it is a prob-
lem to automatically produce and update digital nau-
tical charts from aerial images. Currently, the first
acquisition as well as the update of data bases from
geo-referenced aerial images are both time- and cost-
consuming manual processes.
By combining SLIC as an efficient low-level al-
gorithm via an SVM classification based on texture
features and a GHT for detecting shapes on mid-level
with semantic information in the high-level step, we
obtained a reliable robust object detection that cur-
rent standard vision algorithms cannot deliver. We
propose an efficient and effective segmentation and
recognition method for areas and areal objects and
particularly shaped objects. Furthermore we use in-
formation from inter-object relationships to improve
the recognition rate. Finally, we deal with process-
specific problems, namely data import and prepara-
tion and data export and geo-referencing.
Regarding segmentation and recognition of
coastal zone objects there are two important results:
(1) Choosing the appropriated pixel-based algorithms
with classification by texture features is suitable for a
sharp separation of different areal objects and areas.
Our proposed detection of shaped objects like groins,
buoys, and piers is based on areal segmentation,
but additionally uses contours yielding good results.
Identification is done by adapted GHT. Additionally,
shape features can be used to improve segmentation.
(2) The whole coastal zone can be seen as scene.
Context information from the scene can be used to
improve the fault tolerance of the object recognition
in the overall system. Furthermore, it is the key for
identification of complex objects. For an automatic
recognition of images it is necessary to include the
context and to support the detection by a knowledge
base. Combination of image pyramids and geo-
specific tools allows for using computer vision on
huge data and for keeping geographical referencing
for an exact back projection of objects positions.
For future development it is planned to derive
domain-specific knowledge from semantic models for
the third vision step. In addition, we will try to use
probabilistic models on this high-level step to detect
composite objects and virtual objects such as water-
land-line or dykes.
MATLAB is very practical for rapid prototyping
and interactive testing, but the primary ”data base” is
the file system with images and thousands text files
of vectors and matrices. For this reason, and because
VISAPP2015-InternationalConferenceonComputerVisionTheoryandApplications
106

of the performance, we started to re-implement it in
C++ using as many as possible free 3rd party libraries.
Currently, the data model, the access to a lightweight
data base and some basic processes are already imple-
mented. Futhermore we have to speed-up expensive
operations such as the generalized Hough transforma-
tion by hierachical approaches and by using parallel
processing on GPGPUs.
ACKNOWLEDGEMENTS
The authors would like to thank Steffen Grammann,
Jana Vetter und Manuela Sch
¨
onrock from the divi-
sion Nautical Information Service at BSH for their
support, knowledge, and discussions regarding dig-
ital nautical charts of coastal aerial images and the
processing procedures.
REFERENCES
Achanta, R., Shaji, A., Smith, K., Lucchi, A., Fua, P., and
Susstrunk, S. (2012). Slic superpixels compared to
state-of-the-art superpixel methods. IEEE Trans. Pat-
tern Anal. Mach. Intell., 34(11):2274–2282.
Achanta, R., Shaji, A., Smith, K., Lucchi, A. A., Fua, P., and
S
¨
usstrunk, S. (2010). SLIC Superpixels. Technical
Report June, EPFL, EPFL.
Bicego, M., Dalfini, S., and Murino, V. (2003). Extrac-
tion of geographical entities from aerial images. 2nd
GRSS/ISPRS Joint Workshop on Data Fusion and Re-
mote Sensing over Urban Areas.
Galindo, C. and Moreno, P. (2009). Swimming pools lo-
calization in colour high-resolution satellite images.
Geoscience and Remote Sensing Symposium, 2009
IEEE International, IGARSS 2009, pages 510–513.
Haralick, R. M., Shanmugam, K., and Dinstein, I. (1973).
Textural features for image classification. IEEE
Transactions on Systems, Man and Cybernetics.
Huguet, A., de Andrade, M. C., Carceroni, R. L., and
Araujo, A. d. A. (2004). Color-based watershed seg-
mentation of low-altitude aerial images. In Proceed-
ing of the XVII Brazilian Symposium on Computer
Graphics and Image Processing SIBGRAPI’04.
Isard, M. and Blake, A. (1998). Condensation—conditional
density propagation for visual tracking. International
journal of computer vision, 29(1):5–28.
Kass, M., Witkin, A., and Terzopoulos, D. (1988). Snakes:
Active contour models. International journal of com-
puter vision, 331:321–331.
Letitia, S. and Monie, E. C. (2008). Road segmenta-
tion from satellite aerial images by means of adaptive
neighborhood mathematical morphology. 2008 Inter-
national Conference on Computer and Communica-
tion Engineering, pages 427–432.
Ogawa, Y., Iwamura, K., and Kakumoto, S. (2000). Ex-
tracting object information from aerial images: a map-
based approach. IEICE TRANSACTIONS on Informa-
tion and Systems, 83(7):1450–1457.
Ozden, M. and Polat, E. (2007). A color image segmenta-
tion approach for content-based image retrieval. Pat-
tern Recognition, 40(4):1318–1325.
Sirmacek, B. and Unsalan, C. (2008). Building detec-
tion from aerial images using invariant color features
and shadow information. International Symposium on
Computer and Information Sciences, 2008. ISCIS ’08.
Straub, B., Wiedemann, C., and Heipke, C. (2000). Towards
the automatic interpretation of images for GIS update.
International Archives of International Society for
Photogrammetry and Remote Sensing, XXXIII:525–
532.
Vahl, M. and von Lukas, U. (2013). Toward Automated
Fac¸ades Generation from Oblique Aerial Images. Eu-
rographics Workshop on Urban Data Modelling and
Visualisation, pages 5–8.
Vedaldi, A. and Fulkerson, B. (2008). VLFeat: An Open
and Portable Library of Computer Vision Algorithms.
Velthuijsen, H. (1992). The nature and applicability of the
blackboard architecture. PTT research.
Xiao, J., Cheng, H., Han, F., and Sawhney, H. (2008). Geo-
spatial aerial video processing for scene understand-
ing and object tracking. In Computer Vision and Pat-
tern Recognition, 2008. CVPR 2008. IEEE Confer-
ence on, pages 1–8. Ieee.
Semi-automaticAnalysisofHugeDigitalNauticalChartsofCoastalAerialImages
107
