
Multifractal Texture Analysis using a Dilation-based H
¨
older Exponent
Joao Batista Florindo
1
, Odemir Martinez Bruno
2
and Gabriel Landini
1
1
College of Medical and Dental Sciences, University of Birmingham, St Chad’s Queensway, Birmingham, U.K.
2
Physics Institute of Sao Carlos, University of Sao Carlos, Sao Carlos, Brazil
Keywords:
Multifractal, Texture Classification, Bouligand-Minkowski, Fractal Geometry.
Abstract:
We present an approach to extract descriptors for the analysis of grey-level textures in images. Similarly to
the classical multifractal analysis, the method subdivides the texture into regions according to a local H
¨
older
exponent and computes the fractal dimension of each subset. However, instead of estimating such exponents
(by means of the mass-radius relation, wavelet leaders, etc.) we propose using a local version of Bouligand-
Minkowski dimension. At each pixel in the image, this approach provides a scaling relation which fits better
to what is expected from a multifractal model than the direct use of the density function. The performance of
the classification power of the descriptors obtained with this method was tested on the Brodatz image database
and compared to other previously published methods used for texture classification. Our method outperforms
other approaches confirming its potential for texture analysis.
1 INTRODUCTION
Since the seminal work of Julesz (Julesz, 1981),
the analysis of texture images, and particularly tex-
ture classification, have played a fundamental role in
many applications such as remote sensing, image re-
trieval, object recognition, and others (Zhang and Tan,
2002). Methods such as textons (Varma and Zisser-
man, 2009), texels (Todorovic and Ahuja, 2009), den-
sity maps (Ardizzone et al., 2013) and several oth-
ers have been particularly successful in the solution
of highly complex problems (Farinella et al., 2014).
Among the methods of texture analysis, model-
based approaches (Materka and Strzelecki, 1998) are
especially flexible to analyse a large variety of im-
ages, since they are constructed over adaptable pa-
rameters. One of the model-based methods that pro-
vided interesting results in texture classification is
based on the use of the multifractal spectrum (Xu
et al., 2009). That approach is not only precise in
enabling discrimination between different images but
it is also robust to some changes in illumination and
viewpoint. Despite this, the method relies on local
H
¨
older exponents obtained by applying a Gaussian
convolution to the pixel neighbourhood, suggesting
that more elaborated approaches might be helpful to
describe textures.
Here we propose to use a local H
¨
older exponent
based on the measure of Bouligand-Minkowski dila-
tion volumes. That approach has shown to provide
efficient texture characterisation via the “fractal de-
scriptors” (Florindo and Bruno, 2013) and may pro-
vide a more precise representation of local textures
in terms of irregularity. In this context, the local di-
mension is estimated by mapping the pixels within a
local neighbourhood into a cloud of points in a three-
dimensional space. Therefore, each point in this cloud
is progressively dilated by spheres with growing ra-
dius and the the local H
¨
older exponent is computed
from the exponential relation between the radius of
the spheres and the volume of the dilated cloud.
We applied this approach to the classification of
40 classes from the Brodatz images database (Bro-
datz, 1966) and the task performance was compared
to other state-of-the-art and classical descriptors pre-
viously published in the literature. The potential of
this modified version of the local dimension is demon-
strated by the ratio of images correctly classified in
the database, which was higher than with the other
reported methods.
2 FRACTAL GEOMETRY
Fractal Geometry was developed from the mid seven-
ties by Mandelbrot (Mandelbrot, 1982) to provide a
means to characterise objects which could not be de-
scribed accurately by means of Euclidean Geometry.
505
Florindo J., Bruno O. and Landini G..
Multifractal Texture Analysis using a Dilation-based Hölder Exponent.
DOI: 10.5220/0005302305050511
In Proceedings of the 10th International Conference on Computer Vision Theory and Applications (VISAPP-2015), pages 505-511
ISBN: 978-989-758-089-5
Copyright
c
2015 SCITEPRESS (Science and Technology Publications, Lda.)

Many natural structures are irregular and despite that
natural objects are not strictly fractals in a mathemat-
ical sense (e.g. they are not infinitely detailed), they
have, nevertheless, characteristics that suggest that
they are better modelled by Fractal Geometry con-
cepts (such as their complexity and self-similarity) at
least within a limited interval of scales.
The most widely used measure of an object in
Fractal Geometry is the fractal dimension and one
of its mathematical definitions is called Hausdorff-
Besicovitch dimension, formally defined by:
D(E) = lim
δ→0
N(δ, E)
logδ
, (1)
where N(δ, E) is the minimum number of sets with
diameter δ necessary to cover E. For real-world ob-
jects the definition of an infinite covering is not feasi-
ble and several approximations for N(δ, E) have been
proposed in the literature (Falconer, 2003), such as
box-counting, Bouligand-Minkowski dilation, mass-
radius relation, and so on.
3 MULTIFRACTALS
Multifractal theory assumes that certain class of ob-
jects (multifractals) have different degrees of self-
similarity in different sub-parts and therefore they
should be approximated by several fractal-like mod-
ellings (with different fractal dimensions) instead of
using only one global dimensional value.
The analysis is performed in a few steps. First,
the image is divided into local subsets, then the scal-
ing of a measure in this subsets (i.e. the local H
¨
older
exponent α) is computed. Finally, the fractal dimen-
sions f (α) of the sets of locations with local H
¨
older
exponent α is computed. That relation of values is the
multifractal spectrum of the image and can be used as
descriptors of the image texture.
Whereas there are different approaches to obtain
the multifractal spectrum, here we focus on the so-
lution proposed in (Xu et al., 2009) because it is
straightforward in implementation, it achieved good
results in texture classification and showed to be
relatively invariant to certain scale and illumination
changes.
The local measure µ employed in (Xu et al., 2009)
is named “density function” and it is defined at each
point p in an intensity image I by
µ(p) =
Z Z
B(p,r)
(G
r
∗I)d p, (2)
where B(p, r) is a disk centred at p, with radius r, and
G
r
is a circular Gaussian kernel with radius r:
G
r
=
1
rσ
√
2π
e
−kpk
2
2σ
2
r
2
, (3)
for some smoothing parameter σ. The H
¨
older expo-
nent is computed by
α(p) = lim
r→0
logµ(B(p, r))
logr
. (4)
The limit is estimated from the slope of a straight line
fit to the curve of logr ×log µ(B(p, r)).
Secondly, the computation of the multifractal
spectrum (MFS), is achieved by dividing the image
into subsets E
k
according to
E
k
= {p ∈ℜ
2
: α(p) = k} (5)
and computing the respective fractal dimension D,
such that the MFS is obtained by:
MFS = {D(E
k
) : k ∈ ℜ}, (6)
where D can be computed by Equation 1.
4 PROPOSED METHOD
The dividing process makes possible to think of mul-
tifractal analysis as an elaborated histogram of the
image, where the homogeneity of the texture is as-
sessed under two perspectives: one local, given by the
H
¨
older exponent and one global, provided by the frac-
tal dimensions of each subset resulting from the divi-
sion of the image. As consequence, the local H
¨
older
exponent plays a fundamental role in the analysis and
therefore should be carefully defined.
The neighbourhood value α(p), which in (Xu
et al., 2009) is computed via the density function
µ(B(p, r)), is an example of a H
¨
older exponent (Bed-
ford, 1989). Such parameter is more generically de-
fined in the context of H
¨
older condition. A function f
satisfies this condition if, for any x and y in its domain,
the following inequality holds:
|f (x) − f (y)|≤Ckx −yk
α
, (7)
where C is a real constant and α is the H
¨
older expo-
nent. An especially interesting case occurs when α =
1, and the function is said to be Lipschitz-invariant.
This is a key property in the theory of multifractals
because it assures the local invariance often desired
in image analysis. The density function is an exam-
ple of this category but some other functions invariant
under self-affine transforms could be employed.
Based on this assumption, here, a local H
¨
older ex-
ponent based on the Bouligand-Minkowski dilations
VISAPP2015-InternationalConferenceonComputerVisionTheoryandApplications
506

is proposed. Similarly to α(p) the new exponent here-
after called β(p) is parametrized by the size r of the
neighbourhood. At each point p ∈I, with coordinate
(i, j), a window w : I([i −r, i + r], [ j −r, j + r]) is ex-
tracted and mapped onto a cloud of points C(w), sat-
isfying:
(i, j, k) ∈ C(w) ↔ w(i, j) = k. (8)
In the following, each point p ∈ C(w) is dilated by
a sphere B(p, d), centred at p with radius d and the
dilated volume is computed through
V (d) =
[
p∈C(w)
B(p, d). (9)
The local H
¨
older exponent β(p) is computed by
β(p) = lim
d→0
logV (d)
logd
, (10)
and this limit is estimated by fitting a straight line to
the curve log d ×logV (d) and computing the corre-
sponding slope for each point in the image. Finally,
the exponent is locally assigned to the pixel p. Figure
1 illustrates the steps involved in the dilation process
of the pixels within w.
In order to verify how well β(p) estimates the
H
¨
older exponent and consequently the multifractal
spectrum of a grey-level image, Figure 2 compares
the proposed f (β) with the method in (Xu et al.,
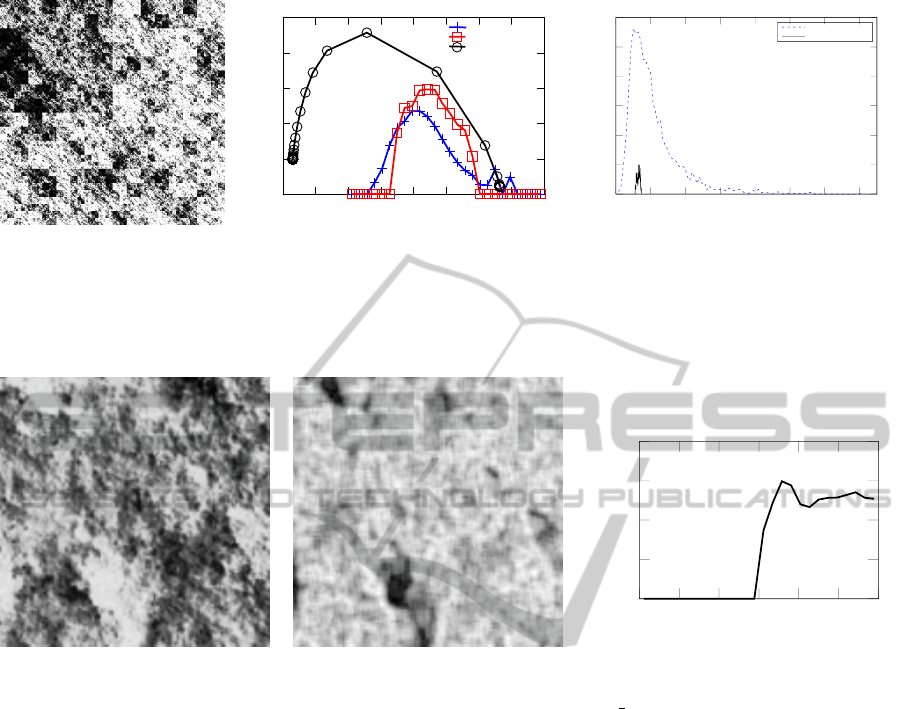
2009) over a synthetic multifractal texture. Figure
2(a) shows the image generated by the Meakin model
(Meakin, 1987). Figure 2(b) exhibits f (α) curve ob-
tained through (Xu et al., 2009) and the proposed one
compared to the theoretical spectrum, obtained by a
procedure described in (Chhabra et al., 1989). Figure
2(c) shows a histogram of the average error when fit-
ting a straight line to the log−log curve at each point
p.
The f (α) and f (β) curves have a similar shape to
that of the expected curve, although the experimen-
tal values obtained depart from the theoretical values,
due to the data being a discrete image. In the partic-
ular case of f (β) this is also caused by the sparsity
of the spheres in the space. An isolated point that is
dilated and suddenly becomes connected to other di-
lated points has its volume raised very quickly leading
to overestimated values of the exponent. However, the
logd ×logV (d) curve in the proposed method showed
the best fit to a straight line than logµ(B(p, r)) ×logr
in (Xu et al., 2009), as illustrated by the smaller er-
ror in the histogram. Such behaviour is due largely
to the smoother growing of the dilation volume when
the radius is gradually increased.
Finally, Figure 3 illustrates the obtained H
¨
older
exponents for a texture of example from the real-
world and the respective multifractal spectrum. Here,
even the shape of the spectrum curve is different from
those found in well-defined multifractals like in the
Meakin model, which again can be explained by the
limited number of scales allowed by the image do-
main. Another important remark here is that the val-
ues of α (or β) are expected to stay between 2 and
3, since they are basically the fractal dimension of an
object immersed in the three-dimensional topological
space . However, here the sparsity of spheres in more
discontinuous regions of the image causes the expo-
nent to extrapolate such interval, as previously ex-
plained. Such extrapolation is also common in other
applied works on multifractals, like (Xu et al., 2009;
Meakin, 1987; Bedford, 1989)and several others.
Following (Xu et al., 2009), this exponent is also
computed not only on the intensity image, but on the
image gradient, and on its Laplacian. Therefore, three
variants of β(p) are defined:
β
I
(p) = lim
d→0
log
S
p∈C(w)
B(p, d)
logd
, (11)
β
G
(p) = lim
d→0
log
S
p∈C(|∇w|)
B(p, d)
logd
, (12)
and
β
L
(p) = lim
d→0
log
S
p∈C(|∇
2
w|)
B(p, d)
logd
, (13)
From equations 5 and 6, three MFS vectors are
obtained (M
β
I
, M
β
G
and M
β
L
) and they are concatenated
to be used as the texture descriptors. The descriptors
based on β(p) were also interchanged and merged
with those from α(p) to obtain even more precise
classification.
5 EXPERIMENTS
Some parameters in the proposed method were empir-
ically chosen. Thus to estimate the H
¨
older exponent
by the Bouligand-Minkowski method a maximum di-
lation radius of 5 and a 5 ×5 neighbourhood were em-
ployed at each pixel. Moreover, the values of β were
limited within the interval [1, 4] and sampled into 33
bins, so that each M
β
I
, M
β
G
and M
β
L
is a vector of 33
real values.
The proposed method was used for the classifica-
tion of Brodatz textures (Brodatz, 1966). The first
40 images (D1-D40) at a resolution of 512x512 pix-
els were used. All images were divided into 16 non-
overlapping windows giving rise to a final set of 40
classes with 16 images in each class. The Brodatz
collection is made of a set of texture images contain-
ing a wide variety of levels of regularity, granularity,
MultifractalTextureAnalysisusingaDilation-basedHölderExponent
507
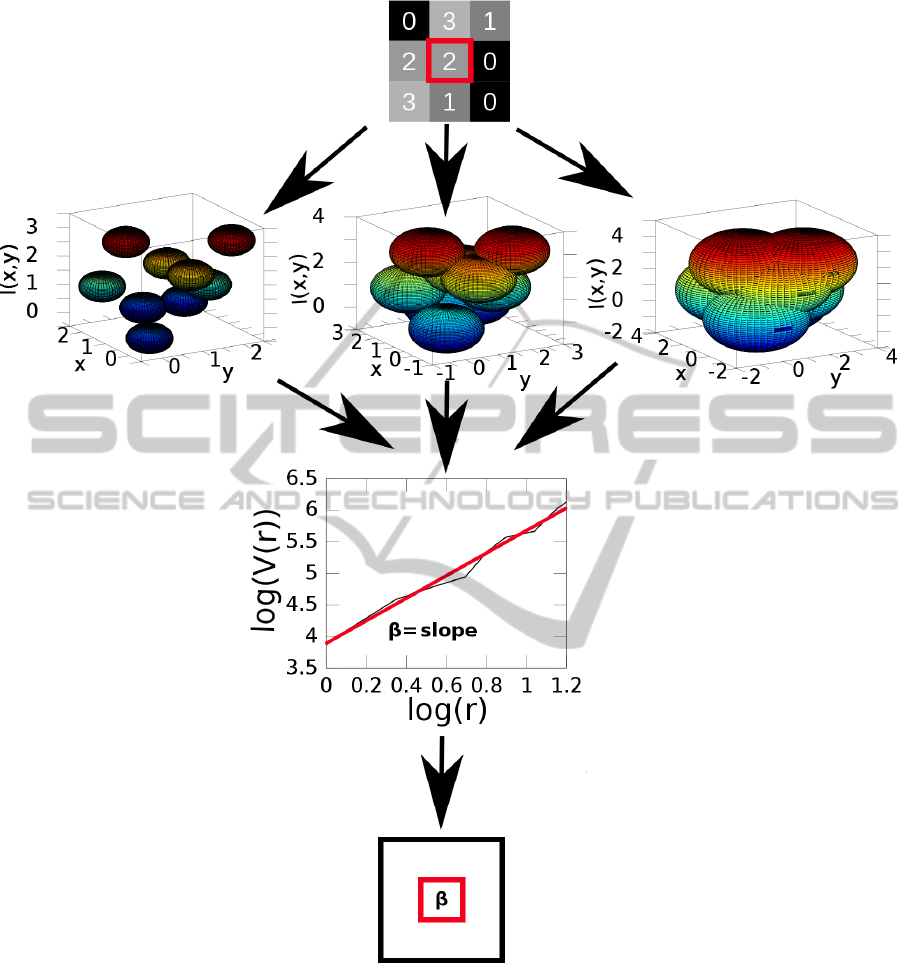
Figure 1: A simplified 3 ×3 texture image, the cloud being dilated by variable radius and the slope of the log −log curve
used to estimate the H
¨
older exponent. Such exponent is locally assigned to the central pixel. The dilation is showed as being
continuous only for illustration purposes.
periodicity and scale, making it ideal for image classi-
fication benchmarking purposes, specially with mul-
tiscale approaches such the method presented here.
The performance of the proposed descriptors as
classifiers was compared to other previous work us-
ing Local Binary Patterns (LBP) (Ojala et al., 1996),
Grey-Level Co-occurrence Matrix (GLCM) (Haral-
ick, 1979), the multifractal approach in (Xu et al.,
2009), Fourier (Gonzalez and Woods, 2002) and frac-
tal descriptors (Backes et al., 2009). To allow for fair
comparisons and to reduce the internal correlations all
the descriptors were submitted to a Principal Compo-
nent Analysis (PCA) (Duda and Hart, 1973) for di-
mensionality reduction.
Finally, the classification was carried out by Lin-
ear Discriminant Analysis (LDA) (Duda and Hart,
VISAPP2015-InternationalConferenceonComputerVisionTheoryandApplications
508
0
0.5
1
1.5
2
2.5
0 0.5 1 1.5 2 2.5 3 3.5 4
f(a )
a
Xu et al. 2009
Proposed
Theoretical
0
50
100
150
200
250
300
0 0.02 0.04 0.06 0.08 0.1 0.12 0.14
number of points
average error
Xu et al. 2009
Proposed
(a) (b) (c)
Figure 2: Multifractal analysis of a synthesized multifractal image. (a) Grey-level multifractal image generated by the proce-
dure described in (Meakin, 1987). (b) f (α) curves comparing the proposed method to that in (Xu et al., 2009) and the expected
theoretical curve provided by the method in (Chhabra et al., 1989). (c) Histogram of the average error in the log−log fitting
at each point of the image.
0
0.5
1
1.5
2
1 1.5 2 2.5 3 3.5 4
f(a)
a
(a) (b) (c)
Figure 3: Multifractal analysis of a real-world texture. (a) Original image (sample c002 002 from Brodatz database (Brodatz,
1966)). (b) Local dilation-based H
¨
older exponent. (c) Multifractal spectrum.
1973), following a 10-fold scheme, that is, the
database was split into 10 groups of equal sizes and 10
rounds of classification were executed. In each round,
9 groups were used to train and the remaining one to
test. The final correctness rate is given by the average
correctness over all the rounds.
6 RESULTS AND DISCUSSION
Table 1 shows the correctness rates achieved during
the classification process when using different combi-
nations of MFS vectors, either using the original α(p)
H
¨
older exponent or the proposed β(p) value. From
the table it can be observed that M
β
performs better on
the intensity and on the gradient of the image rather
than on the Laplacian. Besides, a higher percentage
of the images (95.78%) was correctly discriminated
when M
α
and M
β
descriptors were combined through
the PCA technique.
Table 2 compares the best combination in Table 1
with other texture descriptors widely used in the lit-
erature. The proposed approach correctly classified
a larger number of images even outperforming meth-
ods whose efficiency in this task is well established.
Such result is consequence of using a richer local de-
scription of the texture, yielding to more meaningful
multifractal spectra
Figure 4 exhibits the confusion matrices for the
method as originally proposed in (Xu et al., 2009) to-
gether with the approach here proposed. In this type
of representation a minimum of light blue points out-
side the diagonal is expected and, although the differ-
ence is not so clear, the proposed descriptors presents
fewer misclassification over the classes.
The method in its current version also presents a
drawback which is the high computational time in-
volved since the dimension is computed at each pixel
(O(N
2
) for an N ×N image), although this is atten-
uated by using optimized algorithms as those used
in (Backes et al., 2009). Anyway this computational
time should be improved in the future by means of
MultifractalTextureAnalysisusingaDilation-basedHölderExponent
509
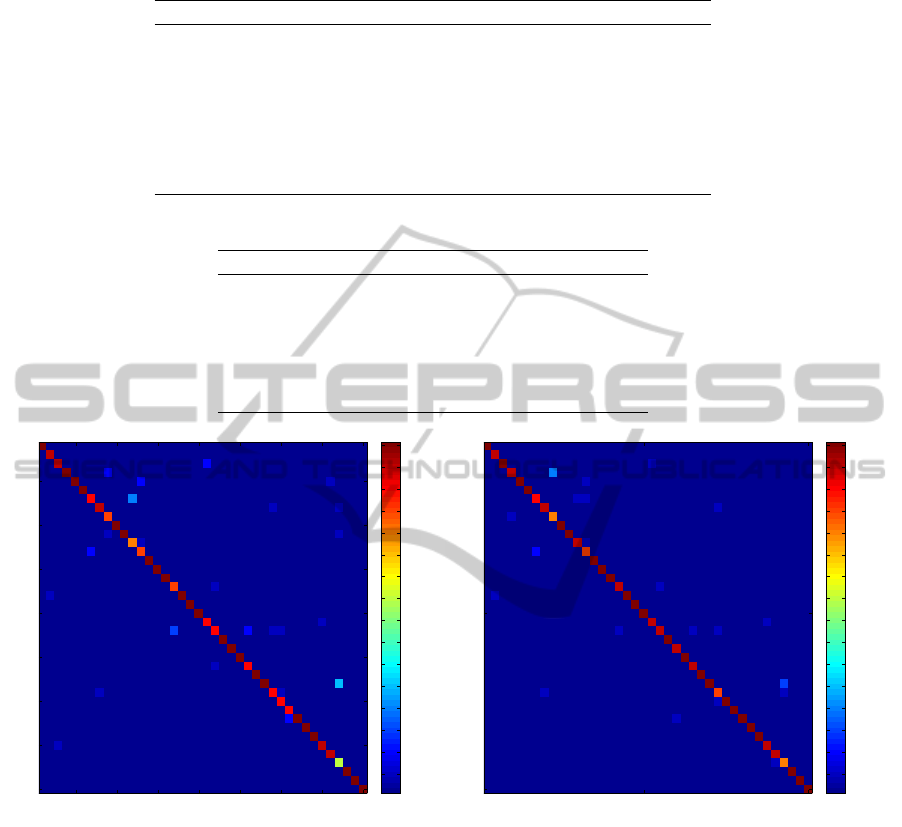
Table 1: Correctness rate obtained by combining α and β in different ways.
Name Combination Correctness rate (%)
MFS1 M
β
I
70.00
MFS2 M
β
G
80.94
MFS3 M
β
L
57.66
MFS4 M
β
I
+ M
β
G
+ M
β
L
89.06
MFS5 M
α
I
+ M
α
G
+ M
α
L
+ M
β
I
+ M
β
G
+ M
β
L
95.00
MFS6 M
α
I
+ M
α
G
+ M
α
L
+ M
β
I
+ M
β
G
95.78
Table 2: Correctness rate and respective cross-validation errors obtained by the compared descriptors.
Method Correctness rate (%) Error
Fourier 88.75 0.05
GLCM 91.67 0.04
Fractal Descriptors 94.37 0.03
LBP 95.00 0.04
(Xu et al., 2009) 93.75 0.05
Proposed MFS6 95.78 0.03
Expected class
Predicted class
5 10 15 20 25 30 35 40
5
10
15
20
25
30
35
40
1
2
3
4
5
6
7
8
9
10
11
12
13
14
15
16
Expected class
Predicted class
20 40
20
40
1
2
3
4
5
6
7
8
9
10
11
12
13
14
15
16
(a) (b)
Figure 4: Confusion matrices. (a) (Xu et al., 2009). (b) Proposed.
a more parallelized procedure. Another point is that
PCA is a simple approach and more advanced fea-
ture selection algorithms also can be applied provid-
ing even better results.
Generally speaking, M
β
descriptors enhanced the
classification performance of the multifractal analy-
sis and added meaningful information to M
α
descrip-
tors, such that when they are combined more images
are correctly classified. Nevertheless, the proposed
H
¨
older exponent did not succeed when applied over
the Laplacian of the image. Such behaviour can be
explained by the dilation process, which propagates
the discontinuities on this type of image and makes
the local exponent more unstable than the smoothing
effect of the Gaussian convolution in (Xu et al., 2009).
7 CONCLUSIONS
We presented a method to estimate the local H
¨
older
exponent in grey-level images and applied it in the
division step of the multifractal analysis of these im-
ages. Our approach is an adaptation of the Bouligand-
Minkowski fractal dimension analysis, here computed
over the neighbourhood of pixels. It was introduced
into the pipeline of the multifractal process and com-
VISAPP2015-InternationalConferenceonComputerVisionTheoryandApplications
510

puted over the intensity grey-level image as well as
over the gradient and the Laplacian of the same im-
age.
The efficiency of the proposed approach was
tested in the classification of 40 classes of Brodatz
database, and compared to other classical texture de-
scriptors and the multifractal approach described in
(Xu et al., 2009). The results showed that the new de-
scriptors can be combined to the previous multifractal
analaysis and in this way they are capable of outper-
forming the classification results of other state-of-the-
art methods in the literature.
Such promising results suggest that the dilation
process successfully employed in a multiscale de-
scription of textures can also be a reliable method
to locally characterize a neighbourhood providing
meaningful descriptors in the context of a multifractal
analysis.
ACKNOWLEDGEMENTS
Joao Batista Florindo acknowledges support from
FAPESP (The State of S
˜
ao Paulo Research Foun-
dation) (Grant No. 2013/22205-3). Odemir Mar-
tinez Bruno acknowledges support from CNPq (Na-
tional Council for Scientific and Technological De-
velopment, Brazil) (Grant Nos. 484312/2013 and
308449/2010).
REFERENCES
Ardizzone, E., Bruno, A., and Mazzola, G. (2013). Scale
detection via keypoint density maps in regular or
near-regular textures. Pattern Recognition Letters,
34(16):2071 – 2078.
Backes, A. R., Casanova, D., and Bruno, O. M. (2009).
Plant leaf identification based on volumetric fractal
dimension. International Journal of Pattern Recog-
nition and Artificial Intelligence, 23(6):1145–1160.
Bedford, T. (1989). H
¨
older exponents and box dimension
for self-affine fractal functions. Constructive Approx-
imation, 5(1):33–48.
Brodatz, P. (1966). Textures: A photographic album for
artists and designers. Dover Publications, New York.
Chhabra, A., Meneveau, C., Jensen, R., and Sreenivasan,
K. R. (1989). Direct determination of the f (α) singu-
larity spectrum and its application to fully developed
turbulence. Physical Review A, 40(9):5284–5294.
Duda, R. O. and Hart, P. E. (1973). Pattern Classification
and Scene Analysis. Wiley, New York.
Falconer, K. (2003). Fractal Geometry: Mathematical
Foundations and Applications. Wiley, Chichester,UK.
Farinella, G. M., Allegra, D., and Stanco, F. (2014). A
benchmark dataset to study the representation of food
images. In International Workshop on Assistive Com-
puter Vision and Robotics (ACVR).
Florindo, J. B. and Bruno, O. M. (2013). Texture analysis
by multi-resolution fractal descriptors. Expert Systems
with Applications, 40(10):4022–4028.
Gonzalez, R. C. and Woods, R. E. (2002). Digital Image
Processing (2nd Edition). Prentice Hall, Upper Saddle
River.
Haralick, R. M. (1979). Statistical and structural approaches
to texture. Proceedings of the IEEE, 67(5):786–804.
Julesz, B. (1981). Textons, the elements of texture percep-
tion, and their interactions. Nature, 290(5802):91–97.
Mandelbrot, B. B. (1982). The Fractal Geometry of Nature.
Freeman.
Materka, A. and Strzelecki, M. (1998). Texture analysis
methods – a review. Technical report, Institute of
Electronics, Technical University of Lodz.
Meakin, P. (1987). Random walks on multifractal lat-
tices. Journal of Physics A: Mathematical and Gen-
eral, 20(12):L771.
Ojala, T., Pietik
¨
ainen, M., and Harwood, D. (1996). A com-
parative study of texture measures with classification
based on featured distributions. Pattern Recognition,
29(1):51–59.
Todorovic, S. and Ahuja, N. (2009). Texel-based texture
segmentation. In ICCV, pages 841–848. IEEE.
Varma, M. and Zisserman, A. (2009). A statistical ap-
proach to material classification using image patch ex-
emplars. IEEE Transactions on Pattern Analysis and
Machine Intelligence, 31(11):2032–2047.
Xu, Y., Ji, H., and Ferm
¨
uller, C. (2009). Viewpoint invari-
ant texture description using fractal analysis. Interna-
tional Journal of Computer Vision, 83(1):85–100.
Zhang, J. and Tan, T. (2002). Brief review of invariant tex-
ture analysis methods. Pattern Recognition, 35(3):735
– 747.
MultifractalTextureAnalysisusingaDilation-basedHölderExponent
511
