
Visualizing Dynamic Weighted Digraphs with Partial Links
Hansj
¨
org Schmauder, Michael Burch and Daniel Weiskopf
VISUS, University of Stuttgart, Stuttgart, Germany
Keywords:
Partial Links, Dynamic Graph Visualization, Time-varying Data.
Abstract:
Graphs are traditionally represented as node-link diagrams, but these typically suffer from visual clutter when
they become denser, i.e. more vertices and edges are present in the data set. Partial link drawings have been
introduced for node-link diagrams aiming at reducing visual clutter caused by link crossings. Although this
concept was shown to perform well for some parameter settings, it has not been used for visually encoding
dynamic weighted digraphs. In this paper we investigate the problem of visualizing time-varying graphs as
one node-link diagram in a specific layout by exploiting the links as timelines. Partially drawn links are used
to show the graph dynamics by splitting each link into as many segments as time steps have to be represented.
Conventional 2D layout algorithms can be applied while simultaneously showing the evolution over time.
Color-coded links represent the changing weights. We use tapered links to reduce possible overlaps at the link
target nodes that would occur when using traditional arrow-based directed links. We experiment with different
graph layouts and different numbers of data dimensions, i.e. number of vertices, edges, and time steps. We
illustrate the usefulness of the technique in a case study investigating dynamic migration data.
1 INTRODUCTION
The visualization of dynamic weighted graphs is of
interest in many application domains. For example,
call graphs in software development, contacts among
people in a social network, or protein-protein interac-
tions in the field of bioinformatics have a relational
structure which is changing over time.
Node-link diagrams are the most convenient vi-
sual metaphor to visually encode relationships among
objects. The relations are graphically depicted as
straight links connecting related objects, where the
objects are displayed as circular, rectangular, or tri-
angular shapes to mention the most important ones.
Although node-link diagrams are intuitive representa-
tions, they typically suffer from visual clutter (Rosen-
holtz et al., 2005) caused by many link crossings
when the graphs become denser and denser. In con-
trast, an adjacency matrix representation is useful for
dense graphs but suffers from bad performance of
path-related tasks (Ghoniem et al., 2004).
The visualization of dynamic graphs (Beck et al.,
2014) makes this problem even more challenging.
Using animated node-link diagrams is one solution
towards solving this problem, but static displays of
dynamic data benefit from preserving a viewer’s men-
tal map (Purchase et al., 2006), thus supporting com-
parison tasks and the visual exploration of such time-
varying data for trends. The drawback of static di-
agrams is the reduced visual scalability, i.e., only a
limited number of graphs of a sequence can be dis-
played demanding for a suitable visualization which
allows graph comparisons and scales for longer graph
sequences.
In this work we propose a compromise repre-
sentation benefiting from the strengths of node-link
diagrams as well as of static displays of dynamic
graph data combined into a single graph representa-
tion which is advantageous for visual scalability. To
achieve this goal we map a timeline to each directed
edge which begins at the node where the edge starts
and points to the target node. Each link is split into
as many segments as time steps have to be displayed.
The static representation also makes it easier to ap-
ply interaction techniques than in the animated case.
Moreover, an additional hierarchical organization of
the graph vertices can easily be attached to a static
diagram.
Applying this concept to complete links soon
leads to a situation where visual clutter occurs, mak-
ing the diagram unreadable and useless. To miti-
gate this situation we apply the concept of partial
links (Burch et al., 2011b; Bruckdorfer and Kauf-
mann, 2012), i.e., we allow the viewer to interactively
123
Schmauder H., Burch M. and Weiskopf D..
Visualizing DynamicWeighted Digraphs with Partial Links.
DOI: 10.5220/0005303801230130
In Proceedings of the 6th International Conference on Information Visualization Theory and Applications (IVAPP-2015), pages 123-130
ISBN: 978-989-758-088-8
Copyright
c
2015 SCITEPRESS (Science and Technology Publications, Lda.)

reduce the link lengths until the clutter is reduced
and visual patterns can be derived. The presented ap-
proach is also dependent on the generated graph lay-
out. We illustrate the usefulness of our technique by
showing real-world graph data from people migration
behavior. In this scenario we demonstrate interaction
techniques implemented in the visualization tool and
finally, use our technique to gain insights from such
time-varying weighted relational data.
2 RELATED WORK
There are many application domains dealing with dy-
namic relational data. Consequently, related literature
in this field comes in a variety of forms.
There are two camps of researchers in the field
of dynamic graph visualization. Time-to-time map-
ping as it is used in animation is one way to show the
time dependency, whereas time-to-space mapping is
another way to visually depict time-varying graphs.
Several comparative user studies focus on the ques-
tion which of the two general visualization principles
of dynamic data, in particular dynamic graph data,
leads to better user performances (Archambault et al.,
2011; Ghani et al., 2012; Tversky et al., 2002).
When animating a graph, a node-link diagram
is generally laid out and is smoothly transformed
into the sequence of layouts one after the other.
This process demands for a good layout for both,
each single graph in the sequence as well as for
the whole sequence in order to preserve a viewers’
mental map (Purchase et al., 2006) guaranteed by a
high degree of dynamic stability. Offline (Diehl and
G
¨
org, 2002) and online (Frishman and Tal, 2008) ap-
proaches are investigated for their suitability to repre-
senting dynamic graphs.
Animation has some general drawbacks apart
from high algorithmic complexities. The viewer can
only see one graph at a time, leading to problems
when comparing several graphs in the sequence to de-
rive time-varying visual patterns and insights in the
data such as trends, counter-trends, or anomalies. For
this reason time-to-space mappings (Burch and Diehl,
2008; Stein et al., 2010; Brandes and Nick, 2011)
have been developed which present a subsequence of
the evolving graph in one view. This concept allows
one to visually analyze a dynamic graph by having a
look at all the graphs side by side similar to a small
multiples representation (Tufte, 1983; Tufte, 1990).
One drawback of such a small multiples diagram
is its poor visual scalability. For example, in the paral-
lel edge splatting technique (Burch et al., 2011a) only
one representation row is used for a graph sequence
which is already enhanced by the authors by apply-
ing the concept of Rapid Serial Visual Presentation
(RSVP) (Beck et al., 2012). However, in their RSVP
variant the graph sequence is animated and only one
time window containing a subsequence of graphs is
displayed. The parallel edge splatting idea was there-
fore extended to a grid-based mapping of the graph
sequence while also supporting a flip-book metaphor
in order to make the visualization more scalable in the
time dimension (Burch and Weiskopf, 2014).
A recent article surveyed existing research in the
field of dynamic graph visualization (Beck et al.,
2014). The paper states the observation that to-
day more and more static representations of dynamic
graph data are designed and less animated diagrams.
But negatively, the designed graph visualization typi-
cally use a small multiples representation which does
not allow us to integrate the time-varying weights of
the graph edges into a single static graph view.
As an enhancement in our work, instead, we do
not use small multiples representations; nor do we
use an animated sequence of graph diagrams. We, in-
stead, show one graph in a convenient layout, but we
additionally use each directed link as a timeline start-
ing at the origin node. To avoid visual clutter (Rosen-
holtz et al., 2005) we do not draw the link completely
but allow the user to interactively vary the link length
similar to the originally proposed (Becker et al., 1995)
and later evaluated (Rusu et al., 2011; Burch et al.,
2011b) partially drawn links. Moreover, we use ta-
pered links which do not use explicit arrow heads at
the target vertices and consequently, further unclutter
the node-link diagram (Holten et al., 2011). A similar
concept has already been used in the TimeSpiderTrees
visualization (Burch et al., 2010) in which the graph
sequence is mapped to growing circles. The edges
are visually encoded as straight links but only drawn
partially with the goal to reduce overlaps and visual
clutter.
Partial edges were mathematically modeled as a
graph drawing problem (Bruckdorfer and Kaufmann,
2012) and integrated it as an interaction technique into
a graph visualization tool (Burch et al., 2014). How-
ever, in their work, they did not investigate the visual
encoding of dynamic weighted and directed graphs by
using partially drawn links, which we illustrate in this
paper.
3 DATA MODEL
We model a directed weighted graph mathematically
as
G = (V, E)
IVAPP2015-InternationalConferenceonInformationVisualizationTheoryandApplications
124
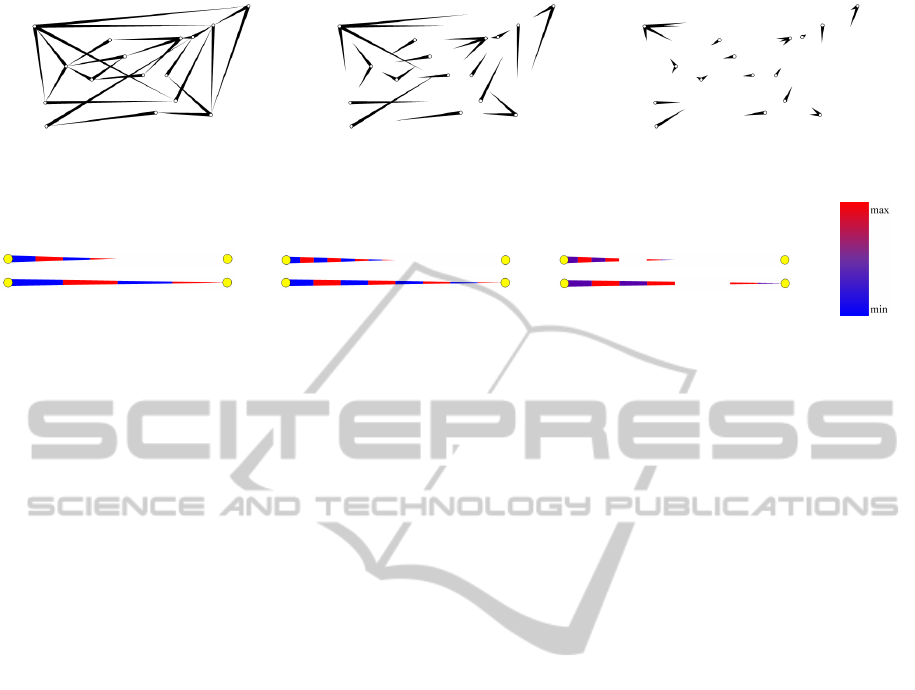
Figure 1: A directed graph containing 16 vertices and 26 edges displayed as node-link diagram using tapered links. Lengths
are varied: (a) 100 % link length, (b) 60 %, (c) 20 %.
Figure 2: A dynamic weight displayed as a partial link divided into color-coded segments: (a) 4 weights and 50 percent link
length. (b) 8 weights and 50 percent link length. (c) 8 time steps where at 2 of them, no edges are available, i.e. 6 weights
and 50 percent link length. (d)–(f) The scenarios from (a) to (c) with 100 percent link length.
where
V = {v
1
, . . . , v
n
}
denotes the set of n ∈ N vertices and
E ⊆ V ×V
the set of directed edges. Each edge e ∈ E is associ-
ated with a weight w(e) ∈ R given by a weight func-
tion w : E → R.
In the context of this work, a layout L of a graph
G is a function
L : G 7−→
{
(x
1
, y
1
), . . . , (x
n
, y
n
)
}
⊆ N
2
which takes an abstract graph data set modeled as G
and maps all vertices contained in G to (x, y)-positions
in the two-dimensional space. In this visual encod-
ing strategy, we follow aesthetic graph drawing cri-
teria (Ware et al., 2002) which are responsible for
making a generated node-link diagram readable, ex-
plorable, and understandable. The partial link visual-
ization tool is implemented in the C# programming
language, which supports an easy extension of the
functionality by additional source code for more lay-
out techniques.
A dynamic graph
Γ = (G
1
, . . . , G
k
)
consists of a sequence of k ∈ N static graphs (single
graphs). We define the union of all graphs as G
S
=
(V
S
, E
S
) with
V
S
=
k
[
i=1
V
i
, E
S
=
k
[
i=1
E
i
.
We use this union graph G
S
in our visualization ap-
proach to compute a 2D layout.
4 VISUALIZATION TECHNIQUE
Our visualization technique is based on node-link dia-
grams. Each link represents a directed weighted edge
and a timeline is visually encoded starting at the ori-
gin vertex and pointing to the target vertex. Color
coding is used to represent the time-varying weights.
We use tapered links to reduce overlaps at the target
vertices when many edges point to the same vertex.
Moreover, the tapered edges are perceptually useful to
directly derive the edge direction (always from thicker
to thinner end).
4.1 Partial Links
Partially drawn links have been introduced to reduce
explicit link crossings in node-link diagrams. By
shortening the links, the exact connections become
more difficult to trace, leading to ambiguities which
node is the edge’s actual target node. We allow the
viewer to interactively vary those link lengths until a
balance between reduction of visual clutter and target
node ambiguities is achieved.
Figure 1 illustrates the impact of link length re-
duction on the visual appearance of the node-link di-
agram. One can directly see how the number of link
crossings is reduced but also how much more diffi-
cult it becomes to solve path-related tasks the less of
the link is displayed. For example, in scenario (c), no
explicit link crossings remain for the 20 percent link
lengths, but it also gets harder to trace paths in the
graph.
VisualizingDynamic WeightedDigraphswithPartialLinks
125

4.2 Time-varying Partial Links
Each graph edge is visually encoded by a straight par-
tial link. To each of these links a timeline is attached
starting at the origin vertex and pointing to the tar-
get vertex. The link is equally divided into as many
segments as graphs have to be displayed. When more
graphs have to be displayed as pixels on the link can
be color-coded, we use a weight aggregation tech-
nique.
Figure 2 illustrates some partial link scenarios
with dynamic weights in either 50 percent link lengths
(a)–(c) or 100 percent link lengths (d)–(f). Here we
can see that the weight is oscillating between low and
high values and that at some time steps, the edge may
not be available at all (c), (f).
Figure 3 illustrates how dynamic weights can be
visualized in a directed dynamic graph. A planar
graph without link crossings in the layout is used for
illustrative purposes.
Figure 3: A small, directed planar graph with dynamic
weights and the weight color mapping.
4.3 Interaction Techniques
Figure 4 illustrates the GUI of our visualization tool.
On the left part of the GUI the user can interactively
change parameters while the dynamic graph view on
the right hand side is directly updated.
Apart from generating a static overview of the dy-
namic weighted graph data, we support an analyst by
several interaction techniques to explore the data. In
the following we give a short list of the most impor-
tant ones of these techniques. These can be classi-
fied into techniques that allow graph layout changes,
node/link/time interval selections, visual appearance
changes to nodes and links, filtering techniques, and
details-on-demand.
Graph Layout. We take the union graph G
S
of the
complete graph sequence into account when comput-
ing a general graph layout. The user can interactively
decide which graph layout is applied to the graph data
set. To this end we support force-directed, circular,
and random layouts. After that, the user is also able
to drag and drop single nodes. All adjacent edges
are then also moved. This helps the user to make
small layout changes and to see to which other nodes a
dragged node is connected because the adjacent links
are smoothly moved around.
Selection. The user can interactively select either
single nodes and links or node and link groups by
clicking on them one after the other. By using rubber-
banding, a connected region can be defined in which
all directly selected links and the selected nodes’ out-
going links are marked for link length manipulation.
Visual Appearance. The diameter of nodes and the
width of links can be changed on demand. Tapered
and traditional link representations are supported.
Showing the links all in their complete length
(100 percent link length) soon leads to a situation pro-
ducing vast amounts of visual clutter. The addition-
ally attached timeline to each link makes the readabil-
ity and pattern detection even worse. For this reason,
the user is able to interactively and smoothly adjust
the link lengths.
We support several color codings which can be se-
lected from a given menu. The most important ones
are linear optimal, vegetation, topographic, blue-to-
red, or heated object color scales. Also logarithmic
and double-logarithmic mappings are supported. Al-
pha blending can be applied on demand to transpar-
ent links, which is useful when these are crossing. A
color gradient is used for the color coding, in which
the lowest value is fully transparent and the links be-
come more and more opaque with increasing values.
Filtering. Since we are dealing with weighted
graphs, a user can interactively filter edges for spe-
cific weights. The filtered out edges are shown in gray
color, i.e. they are still displayed for context infor-
mation, all other edge weights are still color-coded.
Also, some time periods might be uninteresting, be-
cause of a stability pattern for example. In this case,
the user can filter out such time intervals in all of
the links. The filtered out time periods can either be
grayed out or removed completely from the visualiza-
tion, which leaves more space for the remaining time
steps. If vertices are attached with descriptions in tex-
tual form, a text filter can be applied. All vertices
matching a given substring can either be filtered out
or only those can be shown.
Details-on-Demand. Hovering the mouse over a
node gives additional information about this node in
textual form, either in a separate panel or in form of
tool tips. Also the weight values can be displayed.
IVAPP2015-InternationalConferenceonInformationVisualizationTheoryandApplications
126
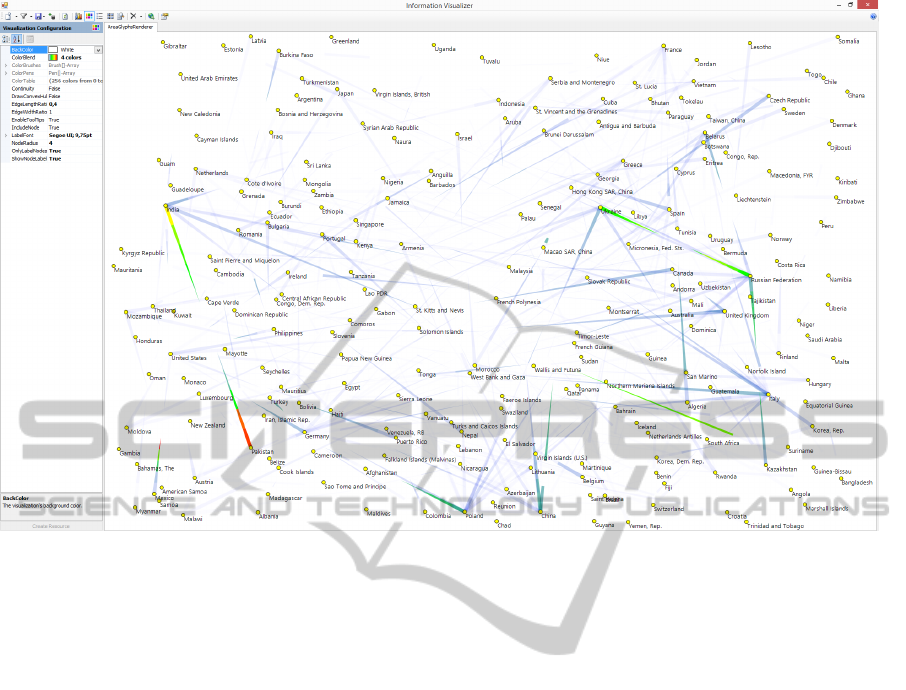
Figure 4: The graphical user interface of our visualization tool: On the left hand side the user can make parameter settings,
whereas on the right hand side the currently selected dynamic weighted graph is displayed.
5 MIGRATION GRAPHS
In this scenario we visually explore the dynamic
country-to-country migration of people in the world.
The corresponding graph contains 226 vertices,
34,968 edges per time frame on average, and spans
over 5 time periods (measured every 10 years between
1960–2010). The edge weights are problematic since
they range from 1 to 9,367,910. Our tool can solve
this by applying a logarithmic weight mapping before
color coding. Moreover, to reduce visual clutter, we
are able to use transparent links for the lower weight
values.
Figure 5 shows the dynamic migration graph for
all countries in the world over five decades. For il-
lustrative purposes, we first generated a random graph
layout, which has the benefit that the vertices are more
or less equally distributed in the 2D plane. From this
figure, we can draw various conclusions, of which
some are illustrated below:
• China and Hong Kong: If we have a look at the
dynamic edge pointing from China to Hong Kong,
we can see that there seems to be a missing data
point, i.e. for the decade from 1970 until 1980, no
migration data is recorded.
• Ukraine and Russia: There was an increase of
people migrating between Ukraine and the Rus-
sian Federation and vice versa, but after the year
2000, the number of people migrating in either di-
rection has dramatically reduced.
• Pakistan and India: From 1960 to 1970, many
people immigrated from Pakistan to India, but
not that many in the other direction. The num-
bers rapidly decreased decade by decade, but still
many people immigrate between both countries,
which can be seen by the green colored peaks of
the links pointing to each other.
• Poland and Germany: There is much immi-
gration from Poland to Germany in nearly every
decade, but not from Germany to Poland.
• Mexico and United States: The number of peo-
ple immigrating from Mexico to the United States
is strongly increasing, which can be seen by the
red color-coded link peak.
Since we also have a hierarchical organization of
the vertices (the hierarchy of the countries based on
the continents, regions, etc.) we can use the geo-
graphic information to place the vertices as well (see
Figure 6). The vertices in this figure are placed close
to the centroid of the area representing each country.
As this is probably the most familiar way of visualiz-
ing geographic positions, the viewer can readily spot
the countries of interest. In this figure we use 45 per-
VisualizingDynamic WeightedDigraphswithPartialLinks
127
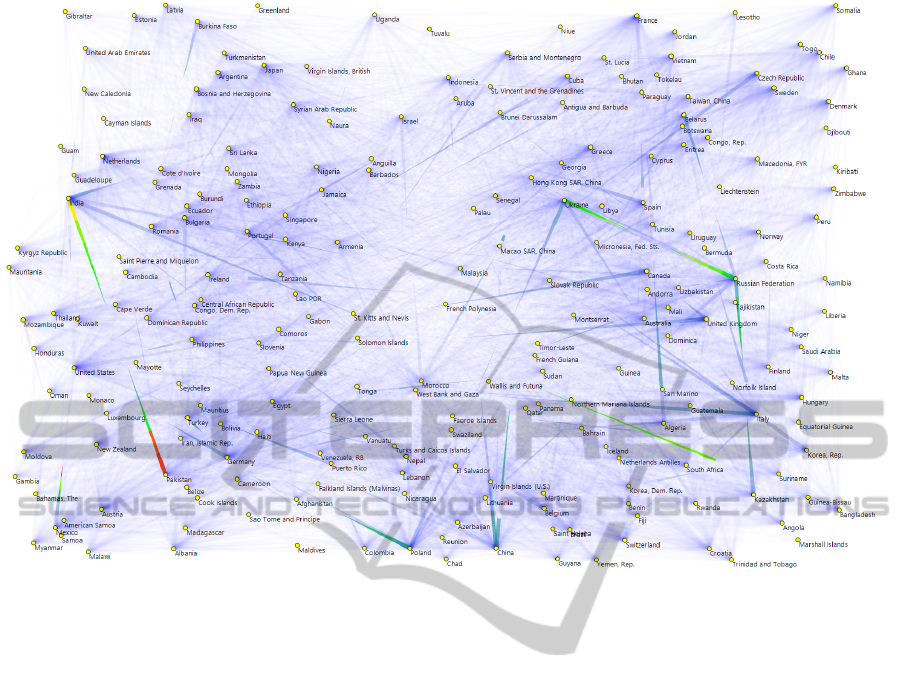
Figure 5: Migration data visualized with 40 percent link lengths and opaque color coding for low values.
cent link lengths and additionally adapt the color scale
to show clearer differences to the world map in the
background. Thanks to the color coding with high
transparency for low migration values, we can still see
differences. For example, France and Lesotho, both
on the right side on the very top in figure 5, have a
quite different number of target countries: For France,
there are 987 outgoing edges, for Lesotho there are
only 234 edges.
6 LIMITATIONS AND
SCALABILITY
Although we designed a useful and interactive visu-
alization technique which combines the evolution of
a graph into one single graph representation in a spe-
cific layout, we are aware of the fact that there are also
many limitations of our approach.
• Layout Dependency: The interpretation strongly
depends on the layout of the graph as it is also the
case for static graph visualization. Visual clutter
might be reduced and graph patterns might be bet-
ter perceivable if a suitable layout is generated.
• Link Length Dependency: The link length can
be reduced, but we are aware of the fact that
if the links become too short, many more target
vertex ambiguities will occur, leading to misin-
terpretations of the data. Moreover, differently
long links (depending on the distance of two
nodes) cause differently stretched timelines which
may cause problems when comparing their time-
varying weights.
• Color Codings: As with any visualization tech-
nique, the applied color coding has a strong im-
pact on the strength of the visualization and its in-
terpretability for visual patterns. For this reason,
we leave the selection of a suitable color coding
to the user, but to achieve basic expressiveness,
the colors’ intensities should be proportional to
the encoded weight.
• Path-related Tasks: Our approach has benefits
when solving path-related tasks since a node-link
diagram is used and the dynamics of the graph is
integrated into one single static diagram. Such
path tracing is problematic in matrix representa-
tions, graph animations, or small multiple repre-
sentations.
• Scalability in the Time Dimension: An increase
of the number of time steps sooner or later leads
to an aggregation of the color-coded weights en-
coded in each link which may lead to a loss of
visible time-varying patterns.
IVAPP2015-InternationalConferenceonInformationVisualizationTheoryandApplications
128

Figure 6: Migration data visualized with 45 percent link lengths and semi-transparent color coding in a world map layout.
• Graph Planarity: In particular, our approach is
suitable for planar graphs where no link cross-
ings occur. In such a graph scenario the ques-
tion arises if we need partially links at all since
those are specifically designed for minimizing vi-
sual clutter mainly caused by link crossings. But
if a directed edge occurs in both directions be-
tween the same vertices, a 40 percent link length
makes sense even in a planar graph layout.
• Decreasing Thickness: The tapered links are
beneficial at the target vertices since they do not
use arrow heads which would cause additional
visual clutter. On the negative side, the time-
dependent weights are visualized with different
link thickness (large ones at the beginning and
smaller ones towards the end). Whereas it is
suitable for the visualization of node relations,
this may cause perceptual problems when inves-
tigating edge weight variations over time (Stone,
2011).
7 CONCLUSION AND FUTURE
WORK
In this paper we introduced a dynamic graph visual-
ization technique which makes use of partially drawn
links. The links are exploited as timelines starting
at the adjacent vertices and pointing to the target
vertices. The user can interactively change the link
lengths in order to reduce visual clutter caused by
many explicit link crossings. We experimented with
different graph layouts and illustrated our novel idea
in a case study investigating dynamic migration data.
We described interaction techniques and their impact
on the perceived graphs, in particular on the partially
drawn links.
For future work, we plan to also visually integrate
an existing or computed hierarchical organization of
the vertices. This is helpful to further navigate in the
data and to filter it on different levels of hierarchi-
cal granularity. Our novel approach should be eval-
uated in a comparative user study which would give
insights into the readability and usability. Also data
sets from different application domains might be of
interest such as dynamic social network data along
with domain expert feedback for our use cases.
ACKNOWLEDGEMENTS
The authors would like to thank the German Research
Foundation (DFG) for financial support of the project
within the Cluster of Excellence in Simulation Tech-
nology (EXC 310/2) at the University of Stuttgart.
REFERENCES
Archambault, D., Purchase, H. C., and Pinaud, B. (2011).
Animation, small multiples, and the effect of mental
map preservation in dynamic graphs. IEEE Trans-
actions on Visualization and Computer Graphics,
17(4):539–552.
Beck, F., Burch, M., Diehl, S., and Weiskopf, D. (2014).
VisualizingDynamic WeightedDigraphswithPartialLinks
129

The state of the art in visualizing dynamic graphs. In
EuroVis State-of-the-Art Reports, EuroVis STAR.
Beck, F., Burch, M., Vehlow, C., Diehl, S., and Weiskopf,
D. (2012). Rapid serial visual presentation in dynamic
graph visualization. In Proceedings of VL/HCC, pages
185–192.
Becker, R. A., Eick, S. G., and Wilks, A. R. (1995). Visual-
izing network data. IEEE Transactions on Visualiza-
tion and Computer Graphics, 1(1):16–28.
Brandes, U. and Nick, B. (2011). Asymmetric relations in
longitudinal social networks. IEEE Transactions on
Visualization and Computer Graphics, 17(12):2283–
2290.
Bruckdorfer, T. and Kaufmann, M. (2012). Mad at edge
crossings? Break the edges! In FUN, pages 40–50.
Burch, M. and Diehl, S. (2008). TimeRadarTrees: Visualiz-
ing dynamic compound digraphs. Computer Graphics
Forum, 27(3):823–830.
Burch, M., Fritz, M., Beck, F., and Diehl, S. (2010). Time-
SpiderTrees: A novel visual metaphor for dynamic
compound graphs. In Proceedings of the IEEE Sympo-
sium on Visual Languages and Human-Centric Com-
puting, VL/HCC, pages 168–175.
Burch, M., Schmauder, H., Panagiotidis, A., and Weiskopf,
D. (2014). Partial link drawings for nodes, links, and
regions of interest. In Proceedings of the International
Conference on Information Visualisation, pages 53–
58.
Burch, M., Vehlow, C., Beck, F., Diehl, S., and Weiskopf,
D. (2011a). Parallel edge splatting for scalable dy-
namic graph visualization. IEEE Transactions on
Visualization and Computer Graphics, 17(12):2344–
2353.
Burch, M., Vehlow, C., Konevtsova, N., and Weiskopf, D.
(2011b). Evaluating partially drawn links for directed
graph edges. In Proceedings of Graph Drawing, pages
226–237.
Burch, M. and Weiskopf, D. (2014). A flip-book of
edge-splatted small multiples for visualizing dynamic
graphs. In Proceedings of the 7th International Sym-
posium on Visual Information Communication and In-
teraction, VINCI, pages 29–38.
Diehl, S. and G
¨
org, C. (2002). Graphs, they are changing.
In Proceedings of Graph Drawing, pages 23–30.
Frishman, Y. and Tal, A. (2008). Online dynamic graph
drawing. IEEE Transactions on Visualization and
Computer Graphics, 14(4):727–740.
Ghani, S., Elmqvist, N., and Yi, J. S. (2012). Perception
of animated node-link diagrams for dynamic graphs.
Computer Graphics Forum, 31(3):1205–1214.
Ghoniem, M., Fekete, J.-D., and Castagliola, P. (2004). A
comparison of the readability of graphs using node-
link and matrix-based representations. In Proceed-
ings of IEEE Symposium on Information Visualiza-
tion, pages 17–24.
Holten, D., Isenberg, P., van Wijk, J. J., and Fekete, J.-D.
(2011). An extended evaluation of the readability of
tapered, animated, and textured directed-edge repre-
sentations in node-link graphs. In PacificVis, pages
195–202.
Purchase, H. C., Hoggan, E. E., and G
¨
org, C. (2006). How
important is the ”mental map”? - an empirical inves-
tigation of a dynamic graph layout algorithm. In Pro-
ceedings of Graph Drawing, pages 184–195.
Rosenholtz, R., Li, Y., Mansfield, J., and Jin, Z. (2005).
Feature congestion: a measure of display clutter.
In Proceedings of Conference on Human Factors in
Computing Systems, pages 761–770.
Rusu, A. I., Fabian, A. J., Jianu, R., and Rusu, A. (2011).
Using the Gestalt principle of closure to alleviate the
edge crossing problem in graph drawings. In Proceed-
ings of the International Conference on Information
Visualisation, pages 488–493.
Stein, K., Wegener, R., and Schlieder, C. (2010). Pixel-
oriented visualization of change in social networks.
In Proceedings of the International Conference on Ad-
vances in Social Networks Analysis and Mining, pages
233–240.
Stone, M. (2011). In color perception, size matters. IEEE
Computer Graphics and Applications, 32(2):8–13.
Tufte, E. R. (1983). The Visual Display of Quantitative In-
formation. Graphics Press, Cheshire, CT.
Tufte, E. R. (1990). Envisioning Information. Graphics
Press, Cheshire, CT.
Tversky, B., Morrison, J. B., and B
´
etrancourt, M. (2002).
Animation: can it facilitate? International Journal on
Human-Computer Studies, 57(4):247–262.
Ware, C., Purchase, H. C., Colpoys, L., and McGill, M.
(2002). Cognitive measurements of graph aesthetics.
Information Visualization, 1(2):103–110.
IVAPP2015-InternationalConferenceonInformationVisualizationTheoryandApplications
130
