
The Visual Exploration of Aggregate Similarity for Multi-dimensional
Clustering
James Twellmeyer
1
, Marco Hutter
1
, Michael Behrisch
2
, J
¨
orn Kohlhammer
1,3
and Tobias Schreck
2
1
Fraunhofer IGD, Darmstadt, Germany
2
University of Konstanz, Konstanz, Germany
3
Technische Universit
¨
at Darmstadt, Darmstadt, Germany
Keywords:
Clustering, Information Visualisation, Visual Analytics, Similarity Functions, Aggregation Functions.
Abstract:
We present a visualisation prototype for the support of a novel approach to clustering called TRIAGE. TRIAGE
uses aggregation functions which are more adaptable and flexible than the weighted mean for similarity mod-
elling. While TRIAGE has proven itself in practice, the use of complex similarity models makes the inter-
pretation of TRIAGE clusterings challenging. We address this challenge by providing analysts with a linked,
matrix-based visualisation of all relevant data attributes. We employ data sampling and matrix seriation to
support both effective overviews and fluid, interactive exploration using the same visual metaphor for hetero-
geneous attributes. The usability of our prototype is demonstrated and assessed with the help of real-world
usage scenarios from the cyber-security domain.
1 INTRODUCTION
Let Bob be a security analyst. Bob has set up spam
traps to capture spam messages. Bob knows that most
messages are sent as campaigns, but he can only col-
lect individual messages. Piecing together the cam-
paigns could give Bob valuable insights into the threat
landscape. Bob decides to cluster the spam messages.
Cluster analysis is an exploratory technique aimed
at grouping data entities, such that entities in the same
group are similar and entities in different groups are
dissimilar. The definition implies the existence of a
similarity model. Let D be a data table consisting of
d attributes (columns) and n entities (rows). In this
paper we focus on multi-dimensional (MD) similarity
models, i.e. models which include similarity informa-
tion from all d attributes.
A well known MD similarity model was pro-
posed by Gower and extended by Kaufman and
Rousseeuw (Gower, 1971; Kaufman and Rousseeuw,
2009). It can be applied to datasets containing primi-
tive attributes of different types (such as numeric and
ordinal attributes), but cannot be applied to structured
attributes (such as Bob’s email addresses and keyword
sets). In these cases, many authors, such as Kaufman
and Rousseeuw or Everitt et al., advocate the aggre-
gation of by-attribute similarity functions, S
1
, . . . , S
d
,
with a weighted mean. (Kaufman and Rousseeuw,
2009; Everitt et al., 2011) The by-attribute similari-
ties are weighted with respect to perceived attribute
importance. For example, let x and y be two entities
with 4 attributes in Bob’s dataset. Bob obtains a vec-
tor σ of four similarity values by applying the four
by-attribute similarity functions S
1
, . . . , S
4
as follows:
σ = (S
1
(x, y), S
2
(x, y), S
3
(x, y), S
4
(x, y))
= (0.1, 0.4, 0.8, 0.4).
(1)
Bob then uses the weighted mean with a weight vector
w to aggregate the by-attribute similarities in σ to a
single MD similarity for x and y as follows:
S
W M
(x, y) =< w, σ >
= (0.1, 0.4, 0.4, 0.1) ·(0.1, 0.8, 0.9, 0.2)
T
= 0.71
(2)
However, Thonnard et al. claim that this approach
does not work for datasets like Bob’s (Thonnard et al.,
2010). Instead, these authors proposed TRIAGE,
which replaces the weighted mean with other aggre-
gation functions, such as the ordered weighted aver-
age (OWA) or the discrete Choquet integral. OWAs
were introduced by Yager and include a sorting step
prior to the application of a weight vector (Yager,
40
Twellmeyer J., Hutter M., Behrisch M., Kohlhammer J. and Schreck T..
The Visual Exploration of Aggregate Similarity for Multi-dimensional Clustering.
DOI: 10.5220/0005304100400050
In Proceedings of the 6th International Conference on Information Visualization Theory and Applications (IVAPP-2015), pages 40-50
ISBN: 978-989-758-088-8
Copyright
c
2015 SCITEPRESS (Science and Technology Publications, Lda.)

1988). For example, if Bob decided to apply OWA
to σ in Equation 1 using the weight vector w in Equa-
tion 2, he would do so as follows:
S
OWA
(x, y) =< w, sort(σ) >
= (0.1, 0.4, 0.4, 0.1) ·(0.9, 0.8, 0.2, 0.1)
T
= 0.5
(3)
The Choquet integral enables the weighting of
both individual attributes and data subspaces (Cho-
quet, 1954). These aggregation functions provide
users with more flexibility when modelling multi-
dimensional similarity. The OWA can be made more
robust with respect to outliers by simply giving the
largest and smallest similarities a low weight (see
Equation 3). The Choquet integral can be config-
ured to adapt to automatically to data subsets with
different statistical properties. However, this flexibil-
ity and adaptability comes at the cost of an increased
complexity. Beliakov et al. provide an practical in-
troduction to aggregation functions for the interested
reader (Beliakov et al., 2007).
TRIAGE is well suited to datasets like Bob’s. His
dataset consists of a mixture of attribute types, some
of which are structured. Each cluster may only be
visible in a different subset of attributes. This is be-
cause spammers attempt to obfuscate their activities
by varying the attributes of emails and each spammer
uses a different variation strategy.
The TRIAGE approach employs graph-based al-
gorithms to cluster the data, which responds to two
further properties of Bob’s dataset. Firstly, his clus-
ters vary significantly in size and shape; some cam-
paigns are large-scale (e.g. advertising for fake medi-
cation), others are more focused (e.g. phishing attacks
on specific organisations). Secondly, the number of
clusters cannot be specified a-priori.
1.1 The Problem
The TRIAGE pipeline is summarised in Figure 1. It
begins with the data table D. A similarity function
S
i
is defined for each attribute. Then an aggregation
function f is applied to generate a single similarity
value for each pair of entities. Finally, a graph-based
clustering algorithm is applied to generate MD clus-
ters. To facilitate exploration, the dataset is also clus-
tered for each attribute based on the by-attribute sim-
ilarities. Each clustering delivers a null cluster con-
taining all entities which could not be grouped.
Our goal is not data reduction, but exploration. We
group entities automatically to gain insight by exam-
ining the groups. But, due to the use of aggregation
functions, such as OWA and the Choquet integral, it
is not always intuitively clear how the similarities of a
given pair of entities were aggregated. Thus, the clus-
terings which result from TRIAGE are often difficult
to interpret.
We present a linked, matrix-based visualisation
prototype to support the appraisal and interpretation
of a TRIAGE clustering. We developed our visuali-
sation to address two main issues. Firstly, to provide
users with a useful overview of the clustering, i.e. the
distribution of cluster size and density, and the simi-
larities between clusters. Secondly, to help users un-
derstand the internal semantics clusters, i.e. the im-
portant substructures, attributes and values.
We cooperated with security analysts during the
VIS-SENSE
1
research project. Based on multiple
workshops and a field study during this coopera-
tion (Fischer et al., 2014), we derived five essential
analytic tasks. We used the taxonomy presented by
(Shneiderman, 1996) to formalise them as follows:
(T1) Overview of clusters, their size and density dis-
tribution.
(T2) Relate multi-dimensional clusters to the by-
attribute clusters.
(T3) Zoom and Filter to focus on a few clusters.
(T4) Relate entities within clusters to discover sub-
structures.
(T5) Details-on-demand to check individual similar-
ities or values.
In the next section we examine related work.
In Section 3 we present the usage scenarios which
guided our design process and the design itself. Sec-
tion 4 contains a summary of the execution of usage
scenarios with real-world datasets. We also discuss
the limitations and potential improvements of our pro-
totype. Finally, we end the paper with our conclusions
in Section 6.
2 RELATED WORK
To respond to the tasks (T1) to (T5), we need a means
to assess and explore both clusterings (T1) and in-
dividual clusters (T3, T4 and T5). An additional
requirement is support for the comparison of dif-
ferent clusterings with respect to different attributes
(T2). We have focussed on techniques supporting
cluster analysis in multi-dimensional, heterogeneous
datasets. We present an in depth survey of matrix vi-
sualisations, since matrices play a central role in our
prototype.
1
http://www.vis-sense.eu
TheVisualExplorationofAggregateSimilarityforMulti-dimensionalClustering
41
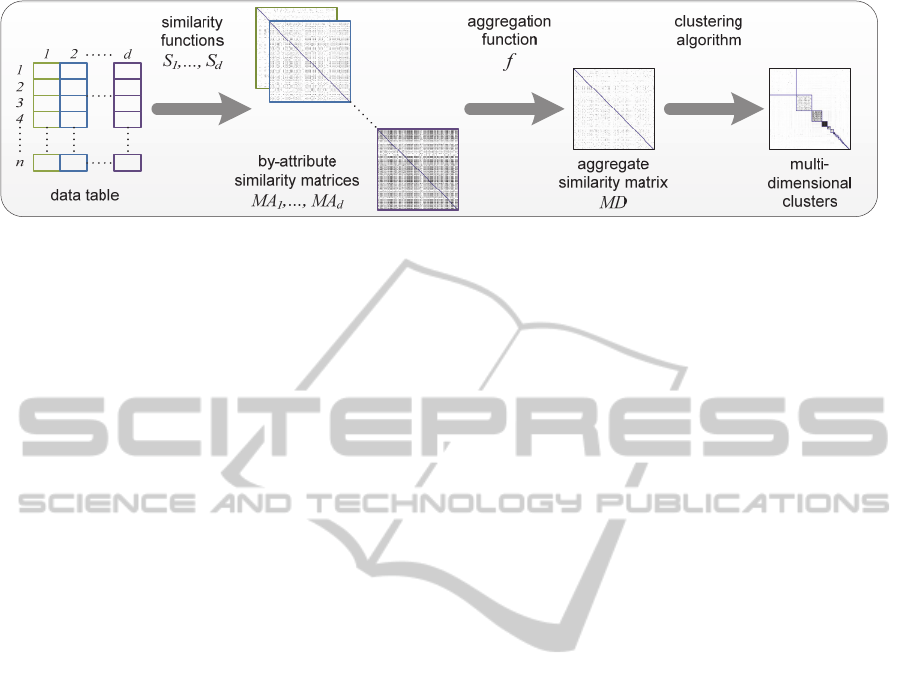
Figure 1: The generic multi-dimensional clustering pipeline. Starting with the input data table, a similarity matrix is calculated
for each attribute. An aggregation function is applied to fuse the by-attribute similarities. Finally, the clustering algorithm is
executed to obtain multi-dimensional clusters.
Exploring Heterogeneous Data. Classical spread-
sheets were extended in the 1990s to support larger
datasets and improved interaction. Prominent exam-
ples include TableLens (Rao and Card, 1995) and Fo-
cus (later InfoZoom) (Spenke et al., 1996). Spread-
sheets are simple, compact and intuitive, but sorting
is the only meaningful way to compare attributes. To
maintain the table metaphor the same sorting must be
applied to all attributes. Thus, it is often impossible
to find a sorting which exposes dependencies between
three or more attributes.
Parallel Coordinate Plots (PCPs) are an estab-
lished technique for the visualisation of multidimen-
sional data. They suffer from chronic overplotting,
but have been subject to many optimisations to im-
prove readability in cluster-identification tasks. How-
ever, Holten and van Wijk showed that many of these
changes had no measurable effect (Holten and van
Wijk, 2010). Li et al. also showed that scatterplots
perform better than PCPs in the judgement of correla-
tion between attributes (Li et al., 2008).
Sankey diagrams have also been used for cluster
comparison tasks (Lex et al., 2010). They are sim-
ilar to PCPs, but overplotting is reduced by plotting
entity groups rather than individual entities. Lines
between groups indicate entity co-occurrence. The
width of lines is proportional to the number of entities
which co-occur. The technique suffers from two ma-
jor drawbacks; when the number of clusters is large
then edge crossings reduce readability, and two clus-
terings must be adjacent to one another to enable ef-
fective comparison.
Matrix Visualisations. All the above techniques
are focused on visualising entities. An alternative is to
visualise the similarity between entities. Similarity-
based projections and node-link diagrams with edge-
weight-based layouts include this similarity informa-
tion implicitly. However, visualising the similarity
matrices themselves provides analysts with direct ac-
cess to a similarity-based view of the data.
Matrices are an established method for the vi-
sualisation of relational data. They were first pro-
posed as a visual aid for exploratory data analysis
by Jacques Bertin in 1967 (Bertin and Berg, 2010).
While matrices are used in the statistics and data-
mining communities, node-link diagrams have gen-
erally been preferred by the visualisation community.
Recently, increases in dataset size have led to renewed
interest in matrices, because they are more compact
than node-link diagrams. Prominent examples are
Matrix Zoom (Abello and van Ham, 2004), Matrix-
Explorer (Henry and Fekete, 2006), NodeTrix (Henry
et al., 2007) and GreenTea (Wong et al., 2013). Ma-
trix Zoom supports the navigation of large, hierarchi-
cally clustered graphs, exploiting the hierarchy to en-
able zooming while optimising the use of screen real
estate and RAM. However, the cluster hierarchy is an
essential prerequisite for the system. MatrixExplorer
provides the user with two coordinated views (a ma-
trix and a node-link diagram) on the same data. Node-
Trix takes this approach one step further by combin-
ing the views to a hybrid visualisation. GreenTea pro-
vides a linked visualisation of one graph as a node-
link diagram and a matrix of the shortest-path dis-
tances between nodes. MatrixExplorer, NodeTrix and
GreenTea do simplify certain tasks, but they sacrifice
the compactness of the matrix.
Both Ghoniem et al. and Keller et al. conducted
user studies comparing matrices and node-link dia-
grams (Ghoniem et al., 2005; Keller et al., 2006).
They came to the conclusion that matrices were a bet-
ter choice for large, dense graphs in information re-
trieval tasks. Except for node and edge count esti-
mations (considered by Ghoniem et al.), these tasks
are not applicable to our use case, but encouraging
nonetheless.
GAP (Wu et al., 2010), MIMatrixViz (Bremm
et al., 2010) and CLUSION (Strehl and Ghosh, 2003)
are pure matrix visualisations, and thus most similar
to our approach. GAP combines an entity similar-
ity matrix, an attribute similarity matrix and a data-
IVAPP2015-InternationalConferenceonInformationVisualizationTheoryandApplications
42

table heatmap in a single display. The approach en-
ables the simultaneous exploration of both clusters
and attribute subspaces. MIMatrixViz enables the si-
multaneous display of two matrix representations of
the same data. It supports zooming, panning and de-
tails on demand and provides a customised matrix se-
riation (also known as matrix sorting or reordering)
algorithm. CLUSION uses a coarse seriation algo-
rithm to provide users with a quick, compact overview
of a dataset partitioned into a predefined number of
clusters of similar size. The authors compared their
approach with PCP and projection techniques to il-
lustrate the usefulness of matrices in cluster assess-
ment. Behrisch et al. present a different take on matri-
ces (Behrisch et al., 2014). The authors support navi-
gation in large sets of matrices with the help of a novel
distance function. While this work is related to ours,
the focus is more on matrix search and retrieval tasks
than on the simultaneous display of multiple views on
the same data.
We go beyond the state of the art by using mul-
tiple, linked matrices (one per attribute) to provide
multiple views of the data. We use the matrices as
a generic visual metaphor, which remains consistent
across heterogeneous attribute types. Our prototype
includes established interactive mechanisms, such as
zooming, panning and seriation. Finally, we have in-
cluded an interactive sampling mechanism to enable
the fluid exploration of large datasets at multiple lev-
els of detail. Our prototype enables the easy compari-
son of by-attribute and multi-dimensional clusterings,
to help users to validate clusterings and discover in-
teresting data subspaces. Through zooming and re-
sampling users can examine single clusters in detail
to understand why they were formed.
3 DESIGN AND
IMPLEMENTATION
To guide our design process we defined a series of
typical usage scenarios. We use these scenarios to
present and assess the usability of our approach in
Section 4. The scenarios are as follows:
(S1) Assess the overall clustering; i.e. the number,
density and distribution of clusters (T1). Identify
interesting attributes (T2).
(S2) Assess the null cluster (i.e. the entities which
could not be grouped). Identify structures in the
null cluster which may indicate the presence of
groups which were missed, and thus a poor clus-
tering (T2). Remove the null cluster and re-
sample the data (T3).
(S3) Assess an MD cluster in its context. Assess
its quality (i.e. density and semantics) and sim-
ilarity to other clusters (T2). Identify those at-
tributes which contributed most to the formation
of the cluster and those attributes which did not
contribute to the formation of the cluster (T2).
(S4) Focus on one MD cluster (T3). Apply local sort-
ing to reveal substructures (T4). Relate the sub-
structures to clusters in attributes (T2). Formulate
a domain-dependant interpretation of the cluster,
using the values involved (i.e. find the story be-
hind the cluster) (T5).
Our prototype (shown in Figure 2) is a coordinated
display of similarity matrices. One matrix for each
attribute and a multidimensional (MD) similarity ma-
trix are displayed simultaneously. All the matrices are
symmetric, meaning that the rows and columns are in-
terchangeable. We apply the same sorting to the rows
and columns of each matrix to ensure that the symme-
try is clearly visible. However, we sort each matrix
individually, such that the structures relevant for that
matrix stand out. Each row (or column) corresponds
to a single entity in the dataset. Each matrix cell con-
tains the similarity score between the corresponding
column entity and row entity. The cells are all in the
range [0, 1], which is mapped to a colour map gen-
erated in accordance with Ware’s guidelines (Ware,
2013); light cells indicate low similarity and satu-
rated cells indicate high similarity. Each matrix can
be zoomed and panned. Hovering over any cell in
the matrix causes a tooltip to be shown containing the
pair attribute values corresponding to the cell together
with their similarity score.
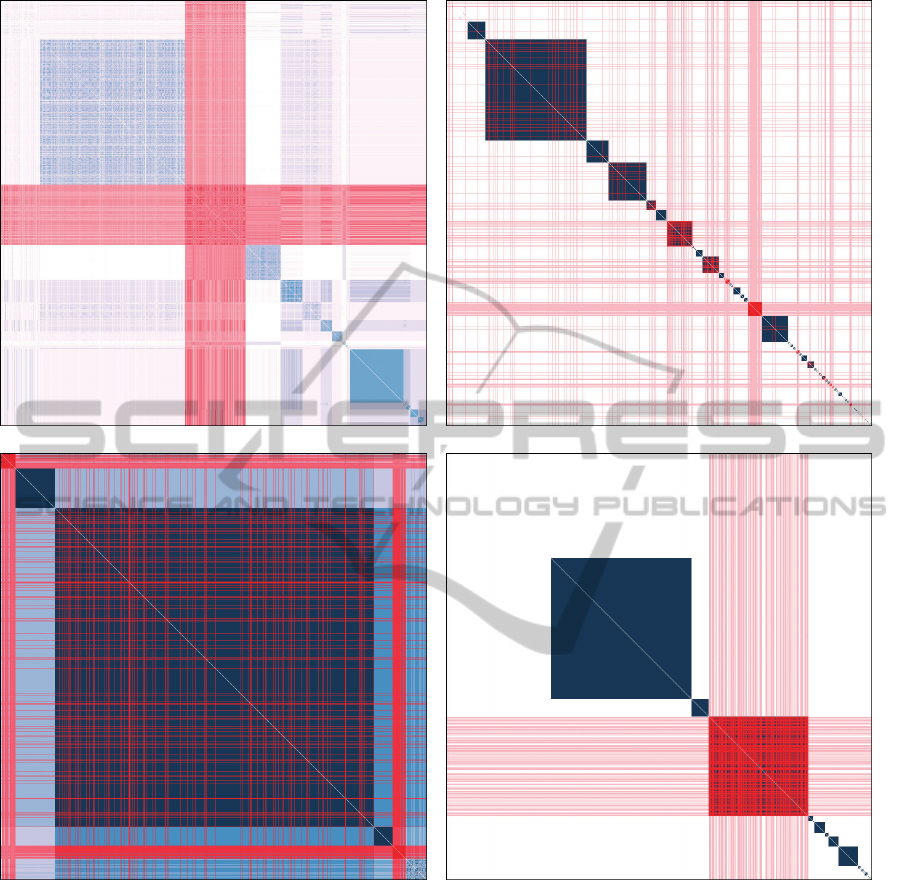
The matrix entries are initially sorted by cluster
label using the coarse seriation method described be-
low. Thus, entities in the same cluster are placed adja-
cent to one another, which normally results in a block-
diagonal form (see Figure 3). Each block on the di-
agonal of the matrix corresponds with a cluster in the
dataset. We will use the terms diagonal block and
cluster interchangeably when referring to the matrix
visualizations.
Frames are overlaid over the cluster boundaries in
the matrices to assist the user in cluster perception.
We use the grid induced by these cluster boundaries
to divide the matrix into brushable regions. When a
user clicks on a cluster the entities contained in that
cluster are highlighted; all rows and columns cor-
responding to the entities in the cluster are marked
red. Since the matrices are linked, the brushed enti-
ties are highlighted in all the matrices simultaneously,
not only in the matrix which was clicked. This allows
a user to immediately see whether a cluster in one at-
tribute is clustered or scattered in the other attributes.
TheVisualExplorationofAggregateSimilarityforMulti-dimensionalClustering
43
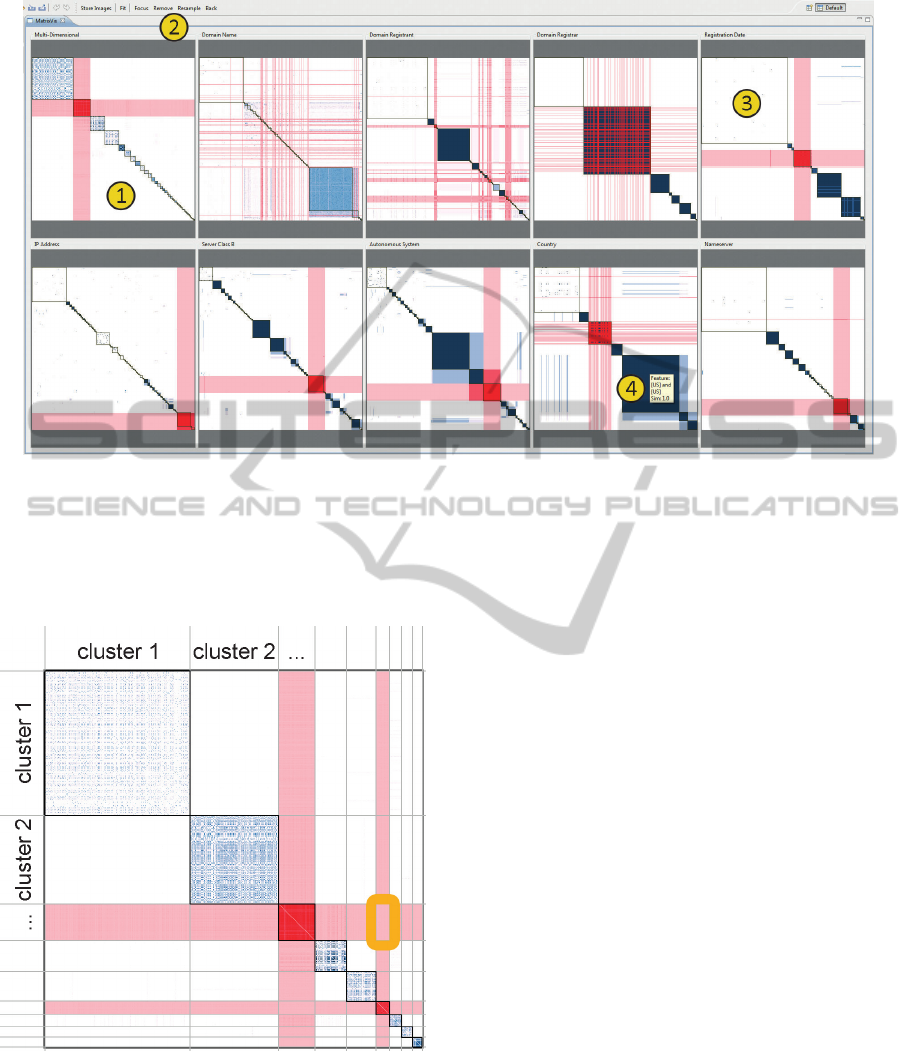
Figure 2: Overview of our prototype, which consists of a coordinated display of matrices. The top left matrix (1) is the
multidimensional similarity matrix, the others are by-attribute similarity matrices. Global actions are available in the toolbar
(2). Null clusters are always displayed as the top left cluster of each matrix (3). Tooltips reveal data values and similarity
scores (4). In this view a cluster in the Multi-Dimensional matrix was selected. It is quite salient and, thus, compact. It is
easy to see that the attributes Domain Name, and Domain Registrant did not contribute to the formation of this cluster, since
the highlighted entities are scattered in these matrices. The other attributes made clear contributions to the formation of the
cluster, since the highlighted entities here are tightly grouped and fall in a single cluster in almost all cases.
Figure 3: The initial sorting by cluster label produces a
block diagonal form. Saturated matrix cells indicate a high
similarity. The clusters are overlaid with boundary lines
(black). A grid of brushable regions is induced by the
blocks (grey lines — not visible in the actual visualisation).
Rows and columns corresponding to the selected entities
are highlighted (in red). The grid cell framed in orange was
clicked to make the current selection. A matrix with empty
off-diagonal blocks was chosen to simplify this figure. In
general, the off-diagonal blocks are not empty.
When a user clicks on an off-diagonal region the ad-
jacent clusters are highlighted. Arbitrary regions can
be brushed by clicking and dragging.
3.1 Interactive Sampling
The datasets we have considered range in size from
5000 to 10000 entities. It is generally not useful to
display the full-sized matrices, since their allocated
screen space is too small and the quadratic increase in
memory requirements can lead to RAM exhaustion.
Ellis and Dix published a taxonomy and comparison
of data reduction strategies for information visualisa-
tion (Ellis and Dix, 2007). Sampling was the strategy
which fulfilled most of the authors’ criteria and was
the strategy which the authors had used successfully
in the past (Ellis and Dix, 2002). Thus, we employ a
sampling mechanism for data reduction.
Our sampling strategy is focused on the MD ma-
trix, since this is the most important matrix in the
analysis. When a dataset is loaded, an initial sampling
is generated using the following guidelines:
• The sample must contain at least one element
from each cluster,
• The sample must be as close as possible to uni-
formly distributed, and
IVAPP2015-InternationalConferenceonInformationVisualizationTheoryandApplications
44

• The sample must contain approximately N ele-
ments, where N is a predefined target sample size.
The first guideline ensures that no clusters are over-
looked. At present we use a target size of N = 1 000,
which enables an initial period of interactive zoom-
ing and panning, and is a reasonable compromise be-
tween detail and RAM load.
After the application of filters, the displayed data
resolution may become low. A user can then initiate
a re-sampling of the data. In this case, the following
guidelines are followed:
• The new sample must have the same distribution
with respect to the MD matrix clusters as the cur-
rent sample, and
• The sample must contain a maximum of N ele-
ments.
Since we know the size of the datasets and clusters a
priori the target distributions are achieved by pseu-
dorandomly sampling a targeted number of integer
indices from each cluster. When zooming into clus-
ters, the number of entities available may be less than
the target size N. In this case, the available entities
are simply displayed (i.e. the sample is equal to the
dataset).
3.2 Matrix Seriation
Mueller et al. provide a guide to the interpretation of
similarity matrices (Mueller et al., 2007b). Important
visual features in cluster analysis are on-diagonal and
off-diagonal blocks. On-diagonal blocks can be inter-
preted as strongly connected subgraphs. The darker
and denser the blocks are, the higher the edge weights
and the degree of connectedness. White space indi-
cates the presence of dissimilar entity pairs. When
a lot of white space is present, the block should
be reordered to reveal substructures (Mueller et al.,
2007b).
Off-diagonal blocks indicate the presence of bi-
partite subgraphs, i.e. connections between clus-
ters (Mueller et al., 2007b). Again, the darker and
denser the blocks, the stronger the inter-cluster con-
nections.
For the initial display of the matrices we fol-
low the same coarse seriation approach as CLU-
SION (Strehl and Ghosh, 2003). This provides the
user with a good initial impression of the number of
clusters, their size distribution and density distribu-
tion, as well as inter-cluster connections. Due to the
different nature of our clustering algorithms, we had
to adapt the Strehl and Gosh seriation. In particu-
lar, their algorithm delivers cluster labels in an or-
der, which places similar clusters adjacent to one an-
other (Strehl and Ghosh, 2003). In our system this is
not the case. Our coarse seriation algorithm is sum-
marised below.
• The order of the entities in a cluster is randomised
to ensure that cluster substructures do not appear
in the initial overview (aggregate cluster proper-
ties are important in the overview, salient sub-
structures may distract the user).
• A meta-graph is constructed based on the cluster-
ing; a node represents each cluster and the aggre-
gate similarity between each cluster pair results in
an edge weight.
• Seriation is carried out on the data of the meta-
graph and a sorted list of cluster labels is returned.
• The original matrix is sorted by cluster label based
on the returned list.
The null cluster is not considered in the sorting pro-
cess. It is always placed as the top left block on the
diagonal.
After applying filters and re-sampling, the coarse
seriation loses its usefulness. Due to the random sort-
ing, cluster substructures cannot be seen. To resolve
this issue, the user can apply a fine seriation to a ma-
trix by right-clicking. Like Wong et al. we provide
a selection of seriation algorithms to the user (Wong
et al., 2013).
Most of the seriation algorithms attempt to trans-
form the matrix, such that its non-zero elements are
close to the diagonal. It is important to note that the
results of many of the algorithms are dependent on the
initial sorting of the matrix (Mueller et al., 2007a).
Thus, the application of multiple seriations sequen-
tially can lead to an improved overall visual result.
In addition to the interactions described above we
provide a set of functions which can be applied to all
matrices simultaneously:
Refit all the displayed matrices to maximise their use
of display space. This function is useful when the
available display space changes.
Remove the selected entities from the current dis-
play.
Focus on the selected entities by removing all unse-
lected entities from the current display.
Re-sample the dataset (described in detail above).
Back go one step back in the interaction history.
4 USAGE SCENARIOS
To present and assess the usability of our approach
we carried out the scenarios defined in Section 1
with three datasets from the cyber-security domain.
TheVisualExplorationofAggregateSimilarityforMulti-dimensionalClustering
45

Table 1: A summary of the three datasets used for the usage scenarios.
Dataset Entities (n) Attributes (d) MD Clusters Null Cluster Size
SGNET 10 162 22 21 931 (9% of entities)
HARMUR 5 852 10 42 1 866 (32% of entities)
419SCAM 4 688 6 103 (Null cluster removed)
The first dataset is a subset taken from the SGNET
project (Leita and Dacier, 2008), the second is a
subset from the HARMUR project (Leita and Cova,
2011) and the third is a subset from the 419SCAM
email archive (Isacenkova et al., 2013). The SGNET
dataset is a collection of malware samples collected
from a globally deployed network of honeypots. It
contains attributes regarding the source host, destina-
tion host, exploit used to spread the malware and var-
ious descriptive attributes of the malware itself. The
HARMUR dataset is a collection of blacklisted web-
sites. It contains the domain names, information on
the host servers and details on the registration of the
domains. The 419SCAM email archive contains a set
of real scam emails which employ a variety of strate-
gies to extract money from innocent citizens (e.g. bo-
gus sales or prizes). The attributes extracted include
telephone numbers and email addresses found in the
body of the email, the subject line and header infor-
mation.
Each dataset consisted of a heterogeneous mixture
of attributes. Each dataset had already been clustered
and we had access to the raw data, the similarity ma-
trices and cluster labels for each attribute, as well as
the aggregated (MD) similarity matrix and cluster la-
bels. A summary of the properties of the datasets is
shown in Table 1.
We used a single screen with a resolution of 1920
x 1080 to carry out the usage scenarios. The proto-
type was optimised to make maximal use of a screen
of this size. In the following paragraphs we discuss
our observations when carrying out each of the usage
scenarios.
Scenario (S1): The number of clusters, their size
and density could be perceived for all attributes. This
was also the case when the display was crowded (e.g.
when viewing the SGNET dataset.) Redundant at-
tributes could easily be identified, since they showed
similar block-diagonal patterns. Less useful attributes
could be also be identified; these either had large null
clusters or consisted of a very large number of small
clusters.
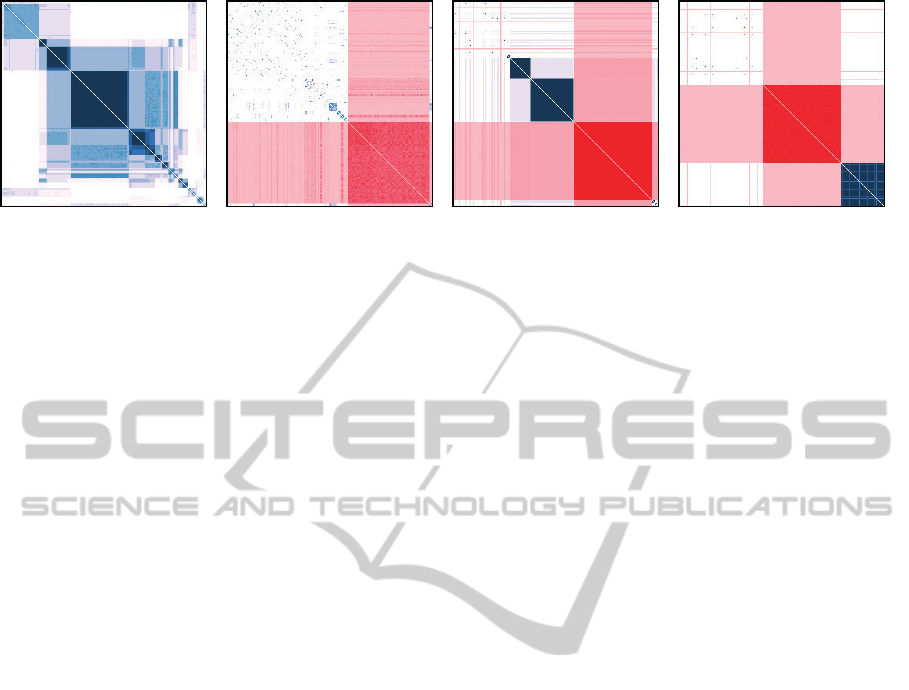
The different types of similarity functions used led
to visually distinct matrices (see Figure 4). Simple
matching led to a clean block-diagonal structure with
dark blocks and white off-diagonal regions. Similar-
ity matrices resulting from string comparison were
more noisy. The MD matrices were generally nois-
ier than the others; the SGNET matrix had numerous
salient off-diagonal blocks, the other two matrices had
fewer.
Uneven textures within on-diagonal blocks al-
luded to the presence of sub-clusters. These textures
were strongest in the MD matrices.
The smallest clusters were difficult to assess with-
out zooming, due to the small amount of screen space
they occupied. This was particularly problematic in
the 419SCAM dataset.
Scenario (S2): The null clusters could easily be
selected and focussed on. Re-sampling and sorting
enabled easy assessment. No significant substructures
were identified in HARMUR or SGNET, thus they
could be safely removed. The datasets were then re-
sampled to increase their resolution.
Scenario (S3): Brushing a cluster quickly re-
vealed those attributes which were involved in its for-
mation (highlighted rows and columns which were
tightly bunched) and those attributes which were not
(highlighted rows and columns which were scattered).
This is shown in Figure 4. Salient off-diagonal blocks
could be brushed to highlight the corresponding clus-
ters simultaneously and examine the similarities be-
tween them. In all the datasets darker clusters were
generally easier to explain than lighter clusters.
Small clusters were difficult to select without
zooming. We applied the following strategy to deal
with this problem: we assessed and removed the
largest clusters, then re-sampled to increase the res-
olution and repeated the process.
In the 419SCAM dataset we discovered a near
one-to-one correspondence between telephone num-
bers and MD clusters. In the SGNET dataset we dis-
covered an MD cluster with light, but uniform colour-
ing, which is very unusual. Brushing revealed that the
most prominent feature was the MD5 hash of the mal-
ware samples; i.e. the samples in the cluster were all
identical. The colouring had been brightened by the
other attributes, which were not uniform.
Scenario (S4): As mentioned above, darker clus-
ters could generally be explained without the need for
focussing. In the SGNET dataset it was useful to fo-
cus on a small set of similar clusters, rather than a
single cluster. This was easy to achieve with our pro-
totype.
IVAPP2015-InternationalConferenceonInformationVisualizationTheoryandApplications
46
(a) SGNET MD Matrix (b) Malware Size
(c) Executable Sections (d) Operation Summary
Figure 4: The MD and Malware Size matrices are visually distinct due to their generating similarity functions. The Malware
Size and Execution Sections matrices are clearly less relevant than the Operation Summary matrix for the formation of the
brushed cluster.
Focussing on the fourth largest HARMUR cluster,
we were able to identify a strong sub-cluster, which
could probably be separated from the other entities in
the cluster. A set of missing values led to its inclusion
in the larger cluster (see Figure 5).
We examined 3 clusters with multiple telephone
numbers in the 419SCAM dataset. Sorting and brush-
ing revealed that the telephone numbers defined clus-
ter sub-structures. The other attributes were responsi-
ble for holding the clusters together.
The temporal attribute in the 419SCAM dataset
became useful when examining the internals of clus-
ters. However, it was difficult to use, since the clusters
in this matrix were not sorted by date.
5 DISCUSSION
The goal of our prototype was to support the explo-
ration of clusters generated by the TRIAGE frame-
work. We chose a common, similarity-based rep-
resentation for all attributes; the matrix. The cho-
TheVisualExplorationofAggregateSimilarityforMulti-dimensionalClustering
47
(a) HARMUR MD Matrix (b) Domain Name (c) Creation Date (d) Registrar
Figure 5: A zoomed view of the fourth cluster in the HARMUR dataset. A salient subcluster is visible. Highlighting reveals
a group of similar domain names registered on the same day using the same address. Some missing values in the Creation
Date and Registrar led to linkage of this cluster with a larger group of entities.
sen representation is not dependent on attribute type,
enabling a homogeneous presentation of a heteroge-
neous set of attributes. With the help of brushing and
linking we were able to coordinate the matrix dis-
plays. Panning, zooming and filtering enabled de-
tailed exploration of multi-dimensional clusters for
datasets of up to around 20 attributes.
At present, we support datasets of up to around
10 000 entities. While this is a comparatively small
amount of raw data, the matrices generated each con-
tain around 10 000
2
entries. Handling the problem
thus becomes challenging despite the small size of the
raw data. In addition, the high complexity of the clus-
tering algorithms prohibits the consideration of much
larger datasets.
We could successfully carry out the usage sce-
narios defined above. However, they did reveal two
weaknesses in our prototype. Firstly, matrices con-
taining many small clusters were difficult to explore,
since the clusters only occupied small amounts of
screen space. Secondly, the matrices were not always
an ideal representation. The user should have access
to more appropriate representations of temporal at-
tributes. This problem could also be solved by intro-
ducing other seriation methods (e.g. sort in ascending
order). In addition, we noticed that for certain sim-
ilarity functions (e.g. simple matching) the matrices
could be replaced with simpler representations. How-
ever, the representation of the attributes would then
no longer be heterogeneous.
The requirement for sampling is potentially a ma-
jor limitation of our work. For every dataset with n
entities, there is a minimum percentage p of entities
which is required in a uniform sample to reproduce
the distribution of the original dataset. The percent-
age of entities required is entirely dataset dependent,
so we cannot actually specify a maximum dataset size
for our system. If p ×n is much larger than the sample
size, then our approach will not work.
It is worth noting that the TRIAGE approach is
conceptually close to subspace clustering in high-
dimensional data (Vidal, 2011). Subspace cluster-
ing is an extension of traditional clustering techniques
that seeks to find clusters in different subspaces within
a dataset. In high-dimensional data, many attributes
are often irrelevant and can mask existing clusters by
adding noise. Subspace clustering algorithms localise
the search for relevant attributes, which allows them
to find clusters that exist in multiple, possibly over-
lapping subspaces (Kriegel et al., 2009; Parsons et al.,
2004). A possible direction for future work is to in-
clude overviews of attribute relationships, such as the
correlation view in GAP (Wu et al., 2010). This could
facilitate the application of our technique to datasets
with more attributes by including interactions to fil-
ter and group attributes. It would also enable explicit
support for data subspace exploration tasks, which are
important in subspace clustering applications.
As mentioned in Section 2 user studies such as
those by Ghoniem et al. and Keller et al. and which
compare matrices to node-link diagrams are gener-
ally focused on information retrieval tasks (Ghoniem
et al., 2005; Keller et al., 2006). To the best of our
knowledge there are no studies which examine the ex-
ploratory tasks we have presented in matrices. We see
this as a promising avenue for future work.
6 CONCLUSIONS
We presented a linked, matrix-based visualisation
prototype for the appraisal and interpretation of clus-
ters delivered by the TRIAGE framework. A key chal-
lenge we addressed was to assist the user in effec-
tively interpreting clusterings delivered by the frame-
work. Our prototype used matrices to provide a con-
sistent visual metaphor across multiple heterogeneous
attributes. With the help of coarse seriation, a com-
pact overview was generated for user appraisal of
overall clustering results. Zooming and filtering ca-
IVAPP2015-InternationalConferenceonInformationVisualizationTheoryandApplications
48

pabilities combined with brushing and linking allow
the detailed exploration of clusters to understand how
and why they were formed. A fine seriation function-
ality enables users to gain an understanding of cluster
substructures. Finally, a sampling mechanism enables
the fluid exploration of large data sets at multiple lev-
els of detail.
Our design was guided by four usage scenarios,
which were used to demonstrate and assess the proto-
type. The usage scenarios were carried out success-
fully with real-world datasets from the cyber-security
domain. However, they did reveal some weaknesses
in our approach.
Our prototype was developed for the TRIAGE ap-
proach to cluster analysis. It is generic enough to be
used with similar clustering pipelines.
ACKNOWLEDGEMENTS
We would like to thank Olivier Thonnard for his
valuable advice and feedback during the creation of
this paper. The research leading to these results has
received funding from the European Commission’s
Seventh Framework Program (FP7/2007-2013) under
grant agreement no. 257495 (VIS-SENSE).
REFERENCES
Abello, J. and van Ham, F. (2004). Matrix zoom: A visual
interface to semi-external graphs. In IEEE Symposium
on Information Visualization, pages 183–190.
Behrisch, M., Davey, J., Fischer, F., Thonnard, O., Schreck,
T., Keim, D., and Kohlhammer, J. (2014). Vi-
sual analysis of sets of heterogeneous matrices us-
ing projection-based distance functions and semantic
zoom: Visual analysis of sets of heterogeneous matri-
ces. Computer Graphics Forum, 33(3):411–420.
Beliakov, G., Pradera, A., and Calvo, T. (2007). Aggre-
gation Functions: A Guide for Practitioners, volume
221. Springer Berlin Heidelberg, Berlin and Heidel-
berg.
Bertin, J. and Berg, W. J. (2010). Semiology of graph-
ics: Diagrams, networks, maps. ESRI Press and Dis-
tributed by Ingram Publisher Services, Redlands and
Calif, 1st ed edition.
Bremm, S., Schreck, T., Boba, P., Held, S., and Hamacher,
K. (2010). Computing and visually analyzing mutual
information in molecular co-evolution. BMC Bioin-
formatics, 11(1):330.
Choquet, G. (1954). Theory of capacities. Annales de
l’institut Fourier, 5:131–295.
Ellis, G. and Dix, A. (2002). Density control through ran-
dom sampling: an architectural perspective. In Sixth
International Conference on Information Visualisa-
tion, pages 82–90.
Ellis, G. and Dix, A. (2007). A taxonomy of clutter reduc-
tion for information visualisation. IEEE transactions
on visualization and computer graphics, 13(6):1216–
1223.
Everitt, B. S., Landau, S., Leese, M., and Stahl, D. (2011).
Cluster Analysis. John Wiley & Sons.
Fischer, F., Davey, J., Fuchs, J., Thonnard, O., Kohlham-
mer, J., and Keim, D. A. (2014). A visual analytics
field experiment to evaluate alternative visualizations
for cyber security applications. In EuroVis Workshop
on Visual Analytics, pages 43–47, Swansea, UK. Eu-
rographics Association.
Ghoniem, M., Fekete, J.-D., and Castagliola, P. (2005).
On the readability of graphs using node-link and
matrix-based representations: a controlled experiment
and statistical analysis. Information Visualization,
4(2):114–135.
Gower, J. C. (1971). A general coefficient of similarity and
some of its properties. Biometrics, 27(4):857.
Henry, N. and Fekete, J. (2006). MatrixExplorer: a
dual-representation system to explore social networks.
IEEE Transactions on Visualization and Computer
Graphics, 12(5):677–684.
Henry, N., Fekete, J.-D., and McGuffin, M. J. (2007). Node-
Trix: a hybrid visualization of social networks. IEEE
Transactions on Visualization and Computer Graph-
ics, 13(6):1302–1309.
Holten, D. and van Wijk, J. J. (2010). Evaluation of cluster
identification performance for different PCP variants.
Computer Graphics Forum, 29(3):793–802.
Isacenkova, J., Thonnard, O., Costin, A., Balzarotti, D., and
Francillon, A. (2013). Inside the SCAM jungle: A
closer look at 419 scam email operations. In 2013
IEEE Security and Privacy Workshops (SPW), pages
143–150.
Kaufman, L. and Rousseeuw, P. J. (2009). Finding Groups
in Data: An Introduction to Cluster Analysis. John
Wiley & Sons.
Keller, R., Eckert, C. M., and Clarkson, P. J. (2006). Ma-
trices or node-link diagrams: which visual representa-
tion is better for visualising connectivity models? In-
formation Visualization, 5(1):62–76.
Kriegel, H.-P., Kr
¨
oger, P., and Zimek, A. (2009). Clustering
high-dimensional data: A survey on subspace cluster-
ing, pattern-based clustering, and correlation cluster-
ing. ACM Trans. Knowl. Discov. Data, 3(1):1:1–1:58.
Leita, C. and Cova, M. (2011). HARMUR: Storing and ana-
lyzing historic data on malicious domains. In Kirda, E.
and Holz, T., editors, Proceedings of the First Work-
shop on Building Analysis Datasets and Gathering
Experience Returns for Security (BADGERS), pages
46–53.
Leita, C. and Dacier, M. (2008). SGNET: A worldwide
deployable framework to support the analysis of mal-
ware threat models. In 2008 Seventh European De-
pendable Computing Conference EDCC, pages 99–
109.
TheVisualExplorationofAggregateSimilarityforMulti-dimensionalClustering
49

Lex, A., Streit, M., Partl, C., Kashofer, K., and Schmalstieg,
D. (2010). Comparative analysis of multidimensional,
quantitative data. IEEE Transactions on Visualization
and Computer Graphics, 16(6):1027–1035.
Li, J., Martens, J.-B., and van Wijk, Jarke J (2008). Judging
correlation from scatterplots and parallel coordinate
plots. Information Visualization, 9(1):13–30.
Mueller, C., Martin, B., and Lumsdaine, A. (2007a). A
comparison of vertex ordering algorithms for large
graph visualization. In Asia-Pacific Symposium on Vi-
sualisation 2007, pages 141–148.
Mueller, C., Martin, B., and Lumsdaine, A. (2007b). In-
terpreting large visual similarity matrices. In Asia-
Pacific Symposium on Visualisation 2007, pages 149–
152.
Parsons, L., Haque, E., and Liu, H. (2004). Subspace clus-
tering for high dimensional data: A review. SIGKDD
Explor. Newsl., 6(1):90–105.
Rao, R. and Card, S. K. (1995). Exploring large tables with
the table lens. In Conference Companion on Human
Factors in Computing Systems, CHI ’95, pages 403–
404, New York, NY, USA. ACM.
Shneiderman, B. (1996). The eyes have it: a task by data
type taxonomy for information visualizations. In 1996
IEEE Symposium on Visual Languages, pages 336–
343.
Spenke, M., Beilken, C., and Berlage, T. (1996). FOCUS:
The interactive table for product comparison and se-
lection. In Proceedings of the 9th Annual ACM Sym-
posium on User Interface Software and Technology,
UIST ’96, pages 41–50, New York, NY, USA. ACM.
Strehl, A. and Ghosh, J. (2003). Relationship-based cluster-
ing and visualization for high-dimensional data min-
ing. INFORMS Journal on Computing, 15(2):208–
230.
Thonnard, O., Mees, W., and Dacier, M. (2010). On a
multicriteria clustering approach for attack attribution.
ACM SIGKDD Explorations Newsletter, 12(1):11.
Vidal, R. (2011). Subspace clustering. IEEE Signal Pro-
cessing Magazine, 28(2):52–68.
Ware, C. (2013). Information Visualization: Perception for
Design. Morgan Kaufmann Publishers, Waltham and
MA, third edition.
Wong, P. C., Mackey, P., Foote, H., and May, R. (2013).
Visual matrix clustering of social networks. Computer
Graphics and Applications, IEEE, 33(4):88–96.
Wu, H.-M., Tien, Y.-J., and Chun-houh Chen (2010). GAP:
A graphical environment for matrix visualization and
cluster analysis. Computational Statistics & Data
Analysis, 54(3):767–778.
Yager, R. R. (1988). On ordered weighted averaging ag-
gregation operators in multicriteria decisionmaking.
IEEE Transactions on Systems, Man, and Cybernet-
ics, 18(1):183–190.
IVAPP2015-InternationalConferenceonInformationVisualizationTheoryandApplications
50
