
Automatic Perceptual Color Quantization of Dermoscopic Images
Vittoria Bruni
1
,Giuliana Ramella
2
and Domenico Vitulano
2
1
Department of SBAI, University of Rome La Sapienza, Rome, Italy
2
Institute for the Applications of Calculus, CNR, Rome, Italy
Keywords:
Color Quantization, Perception Laws, Visual Quality, Dermoscopy.
Abstract:
The paper presents a novel method for color quantization (CQ) of dermoscopic images. The proposed method
consists of an iterative procedure that selects image regions in a hierarchical way, according to the visual
importance of their colors. Each region provides a color for the palette which is used for quantization. The
method is automatic, image dependent and computationally not demanding. Preliminary results show that the
mean square error of quantized dermoscopic images is competitive with existing CQ approaches.
1 INTRODUCTION
Color Quantization (CQ) is the process that selects
and assigns a limited set of colors for representing
a color image with maximum fidelity (Burger and
Burge, 2009). The need of performing a CQ pro-
cess frequently arises in image display (Heckbert,
1982; Weeks, 1998) and image compression (Wal-
lace, 1991; Plataniotis and Venetsanopoulos, 2000).
Moreover, CQ is considered as a prerequisite for
many image processing tasks (i.e. color segmenta-
tion, color-texture analysis, content based retrieval)
and it also has a wide range of applicative field. In
particular, CQ plays an important role in dermoscopy
since the colors of melanin, the most important chro-
mophore in melanocytic neoplasms not visible by the
naked eye, essentially depend on its localization in
the skin (Braun et al., 2005; Korotkov and Garcia,
2012; Celebi et al., 2013). Even though CQ task is
easy, rapid and efficient for a human observer (Rosch,
1978; Kuriki, 2004), CQ implementation is a very
difficult task (NP-complete) (Braquelaire and Brun,
1997).
In the literature CQ has been widely studied and
several methods have been proposed. The critical
common aspect to all methods is the efficient simu-
lation of the visual perception process that minimizes
the error relative to the image quality. CQ exist-
ing methods can be classified in numerous ways on
the basis of criteria taking into account different fea-
tures of the CQ method at hand (Brun and Trmeau,
2002; Celebi, 2011). According to the adopted
image processing technique, CQ based on cluster-
ing (Celebi et al., 2014), evolutionary approach (Hr-
uschka et al., 2009), histogram analysis (Ramella and
di Baja, 2013), neural network (Palomo and Dom-
nguez, 2014), perceptual laws (Beghdadi et al., 2013),
and so on, can be distinguished. Here we focus our
attention on perception-based CQ methods since we
are interested to investigate how the visual laws can
be used to guide efficiently the CQ processing of der-
moscopic images. Since there are several ways to
include visual perception into a CQ scheme, there
exists a large number of papers on this topic. At
least two main sub-classes of methods can be distin-
guished for the this special category: the ones based
on DCT/DWT transform, that are oriented to im-
prove JPEG standard from a perceptual point of view
(Battiato et al., 2001); and the ones based on visual
distortion, where a visual threshold-based processing
for the quantization error of quality measures is em-
ployed (Schaefer and Nolle, 2014).
In this paper, we propose to incorporate human
perception into a CQ scheme by using visibility laws
(Bruni et al., 2006) based on the measure of the con-
trast sensitivity, the luminance adaptation and the con-
trast masking according to the color variable percep-
tive context determined by the original color distribu-
tion. To this purpose we determine iteratively a hierar-
chical color regions partition according to their color
importance at perceptive level and we compute the
dominant color of the partition until a fixed number
of colors is obtained. In the successive step a suitable
color mapping is performed. Our perceptual-based
method is automatic since perceptive thresholds are
automatically tuned according to the analyzed image;
323
Bruni V., Ramella G. and Vitulano D..
Automatic Perceptual Color Quantization of Dermoscopic Images.
DOI: 10.5220/0005304903230330
In Proceedings of the 10th International Conference on Computer Vision Theory and Applications (VISAPP-2015), pages 323-330
ISBN: 978-989-758-089-5
Copyright
c
2015 SCITEPRESS (Science and Technology Publications, Lda.)

it can be considered as context adaptable, since the
resulting CQ is image-dependent. With regard to the
specific domain of the images (dermoscopy), the re-
sults of this preliminary study, evaluated in terms of
MSE and MAE and compared with those obtained by
other authors (Celebi et al., 2013), are encouraging.
The computational load required by the algorithm is
very moderate and comparable to the most perform-
ing color quantization methods.
The outline of the paper is the following. Section
2 gives a detailed description of the general perceptual
model. Section 3 provides a thorough description of
the main steps of the whole quantization procedure.
Experimental results and discussions are in Section 4
while concluding remarks are drawn in Section 5.
2 PERCEPTUAL MODEL
Even though the image can be composed of differ-
ent colors, human eye is able to classify and detect
its dominant colors after observing the image just for
few milliseconds. It means that the visual mecha-
nisms of the early vision (preattentive phase) are not
completely independent on those colors that mainly
characterize the observed scene (image). In the case
of dermoscopic images, the object of interest is well
defined since the contextof the images is limited (usu-
ally image backgroundis the skin) and then anomalies
of the skin attract human attention at the first glance
— some examples are shown in Fig. 1. Based on
these considerations, the problem of CQ in dermo-
scopic images can be viewed in the more general con-
text of the detection of local image anomalies. In
fact, as several neurological studies show, if on the
one hand human eye is used to recognize those re-
gions in the image with which it is very familiar; on
the other hand, it is instinctively attracted by the most
unnatural parts of the image, probably due to safety
instincts (i.e. to check if there are dangers/unnatural
components in the scene) (Monte et al., 2005; Fra-
zor and Geisler, 2006; Moorthy and Bovik, 2009).
That is why in this paper we aim at modelling the der-
moscopic image as an image with a given distortion,
namely skin mole (melanoma), and we want to detect
and characterize it by means of a hierachical detection
of those image regions that attract human attention at
the first glance. To this aim we consider the defect
detection method in (Bruni et al., 2006; Bruni et al.,
2013) and we adapt it to the case of dermoscopic im-
ages. The main features of this model are:
• to project the analysed image into a new space that
is able to better reproduce image components in a
way that is consistent with their visual perception
at the first glance: for example, the objects that at-
tract first human attention are the brighter parts in
the projected image. The projection space has to
depend on the kind of image and the characteristic
of the distortion;
• to define the level of resolution that reproducesthe
perceived image information: human eye is not
sensitive to fine textures in the preattentive phase;
that is why, usually textured regions are perceived
as uniform regions having constant color. The
level of resolution is used for the characterization
of a low pass filter to apply to the projected image;
• to define a detection operator whose goal is to de-
tect those regions in the projected and filtered im-
age that correspond to the ones that attract more
eye attention at the first glance. Since, the pro-
jection space is selected as the one where image
anomalies become the brighter part of the image,
a thresholding operator is used for detection and
the threshold is automatically selected by measur-
ing the local and global visual image contrast.
This general model has some nice features. It is com-
pletely automatic and does not require user’s inter-
vention in parameters setting; it is simple since it is
based on simple operations like linear filtering, con-
trast evaluation and thresholding operations; it is not
computationally demanding and it is easy to imple-
ment making it useful for real time applications.
Figure 1: Eight dermoscopic images. From left to right,
top to bottom: Acl285, Nbl034, Nbl063, Nml012, Ael484,
Fel096, Nml024 and Newl012 (Argenziano et al., 2002).
VISAPP2015-InternationalConferenceonComputerVisionTheoryandApplications
324
3 PERCEPTUAL COLOR
QUANTIZATION
The selection of the projection operator to apply to
the original image, as explained in the previous sec-
tion, has to take into account the class of images and
the type of application we are dealing with. This step
tries to simulate the human visual system that reacts in
the presence of different colored objects in the scene.
In the specific case of dermoscopic images we have
to consider both color perception and the presence of
skin anomalies. On the other hand, in this paper we
do not want to use too complicated models in order
to limit the computational effort of the whole proce-
dure. That is why the luminance component of the
YIQ color space (Gonzalez and Woods, 2002) has
been considered. The YIQ system takes advantage
of human color-response characteristics. In particu-
lar, it is based on the sensitiveness to changes in the
orange-blue (I) range than in the purple-green range
(Q) - therefore less bandwidth is required for Q than
for I. In addition, Y (that represents the luminance
component and preserves the 90% of the whole im-
age information (Winkler, 2005)) is the one used for
black and white television and it is a weighted average
of red, green and blue components. The weights re-
flect the fact that human eye is more sensitive to green
than red, but is more sensitive to red than blue; that is
why the weights in the average are about .3, .6 and
.1 respectively for red, green and blue color compo-
nents.
Finally, since melanoma are in general of dark col-
ors with respect to the skin, and since we are inter-
ested in better distinguishing those colors that charac-
terize it for clinical purposes, the negative of Y com-
ponent has been considered. In this way, skin anoma-
lies become the brighter parts of this component. An
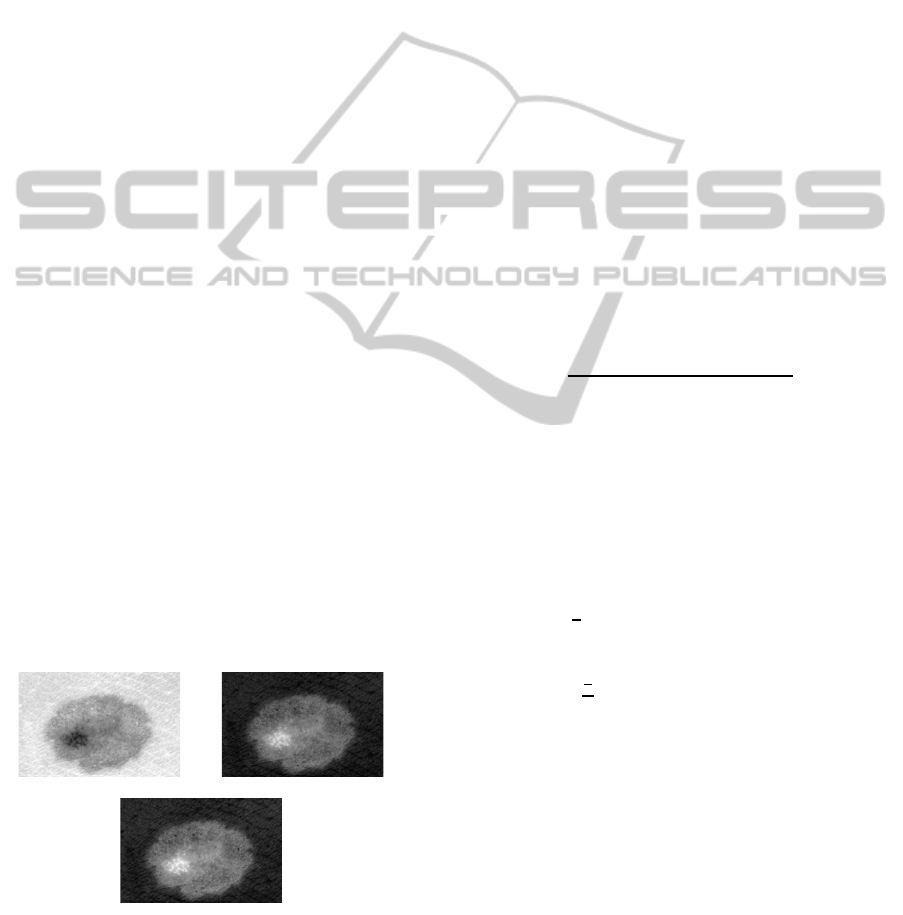
example is shown in Fig. 2.
Figure 2: Acl285 test image. From left to right, top to bot-
tom: Image luminance component Y; negative of the lu-
minance
¯
Y; filtered version of
¯
Y at the optimal resolution
¯r (1
st
level of a db2 wavelet decomposition has been auto-
matically selected).
As mentioned above, in the preattentivephase, hu-
man eye acts as a low pass filter since it is not inter-
ested in the detection of image details in this phase.
As a result non-homogeneous colored image regions
are usually perceived at the first glance as uniform ar-
eas. For the selection of this ”visual resolution” (and
then the order of the low pass filter to be applied to
the image), the same arguments and methods given in
(Bruni et al., 2006; Bruni et al., 2013) have been used.
The ”visual resolution” must be a good trade off be-
tween the enhancement of the degraded region and
the preservation of their geometrical shape and color
features. Perception rules are employed also for the
selection of this resolution ¯r, that is automatically se-
lected by computing the contrast between two succes-
sive low-pass filtered versions of the detection space.
A moving average filter φ
r
of order r can be then used
to smooth the negative of the Y component, namely
¯
Y. The rationale is that the best level of resolution ¯r
is that which measures the minimum perceivable con-
trast, i.e. 0.02 (Winkler, 2005), between two succes-
sive blurred images, i.e.
¯r = argmin
r∈N
{C(r) ≤ 0.02}. (1)
where
C(r) =
Z
Ω
|
¯
Y ∗ φ
r
(x, y) −
¯
Y ∗ φ
r−1
(x, y)|
|Ω| (
¯
Y ∗ φ
r
(x, y))
dxdy, (2)
is the definition of visual contrast given by Peli (Win-
kler, 2005), Ω is the image domain and |Ω| is its size.
It is worth observing that φ
r
is a low pass filter; hence
the numerator of the integrand function in eq. (2) is a
sort of derivative of
¯
Y, while
¯
Y ∗ φ
r
is its local mean.
Fig. 3 depicts a typical behaviour of the con-
trast curve C(r) versus the level of resolution r: it
is a decreasing function and the optimal point ¯r co-
incides with the maximum inflection of the curve.
The value of
r can be associated to a precise scale
level J in a pyramidal decomposition (for instance a
dyadic wavelet decomposition) by means of the equa-
tion J = ⌈log
2
r
H
⌉ , where H is the length of the filter
associated to the adopted wavelet (Mallat, 1998), see
(Bruni et al., 2006) for details. In our experiments the
low pass filter associated to the Daubechies wavelet
with 2 vanishing moments (Mallat, 1998) has been
adopted since it has minimum support and reasonable
regularity that are well adapted to the analysed im-
ages. Let
¯
Y
r
be the low pass filtered version of
¯
Y. As
it can be observed in Fig. 2, skin anomalies are the
brighter objects in
¯
Y
r
.
3.1 Selection of Dominant Colors
The objective of this section is to iteratively separate
¯
Y
r
foreground (skin anomalies) and background. The
AutomaticPerceptualColorQuantizationofDermoscopicImages
325

2 4 6 8 10 12 14 16 18 20 22
0.015
0.02
0.025
0.03
0.035
0.04
0.045
0.05
r
C(r)
Figure 3: Contrast C(r), as in eq. (2), versus the resolution
r. The arrow indicates the optimal resolution ¯r.
goal is to iteratively detect image regions according to
their visual importance (from the most to the less im-
portant in the pre-attentive vision process). The num-
ber of iterations is represented by the number of col-
ors K to be used for image quantization; K is consid-
ered as an input known value. In particular, regions of
interest in
˜
Y
r
are selected using a threshold value that
has to correspond to the point of maximum visibil-
ity of the foreground with respect to its background.
To this aim, a suitable distortion based on the image
visual contrast is defined.
Let M be the mean value of
¯
Y
r
, that measures its
global background; let us define a reference image
¯
Y
M
as follows
¯
Y
M
(x, y) =
¯
Y
r
(x, y) if
¯
Y
r
(x, y) ≥ M
M otherwise;
(3)
and let T (
¯
Y
M
, T) be the clipping operator, i.e.
T (
¯
Y
M
, T)(x,y) =
¯
Y
M
(x, y) if
¯
Y
M
(x, y) ≤ T
T otherwise.
(4)
The goal is to select a suitable value for T (namely
T)
that is able to separate
¯
Y
M
foreground (the brightest
regions) from the rest of the image. In particular,
T
will be the one that maximizes a visual distortion D
that depends on both local and global image contrast,
as explained in the following.
Definition 1. Let Ω
T
= {(x, y) ∈ Ω :
¯
Y
M
(x, y) > T}
be the set of pixels whose
¯
Y
M
value over-exceeds the
threshold value T. Let D
1
and D
2
be defined as
D
1
(x, y) =
¯
Y
M
(x, y) − T (
¯
Y
M
, T)(x, y)
M
D
2
(x, y) =
¯
Y
M
(x, y)|M
T
− M|
M
T
M
,
with M
T
the average value of T (
¯
Y
M
, T) in Ω − Ω
T
,
then the visual distortion for the set Ω
T
is defined as
D(Ω
T
) =
1
|Ω
T
|
∑
(x,y)∈Ω
T
D
1
(x, y)D
2
(x, y). (5)
The distortion D describes the interaction between
image background and foreground. D
1
(x, y) measures
the contrast variation of a changing object with re-
spect to a fixed background: the contrast is measured
through the Weber’s law, the changing object is a re-
gion of
¯
Y
M
before and after clipping, while the fixed
background is given by M. Hence, D
1
evaluates how
an object changes its perception if it is substituted for
the threshold value T. It is worth outlining that: i)
D
1
(x, y) = 0 ∀ (x, y) ∈ Ω− Ω
T
; ii) the value of D
1
in
Ω
T
is an increasing function for decreasing threshold
values (increasing |Ω
T
|). In particular, D
1
(Ω
T
) grows
quickly for higher thresholds since clipping involves
less uniform regions with small area; on the contrary,
the growing law changes as the threshold value de-
creases, since the clipping selects many points whose
values are closer to the background.
D
2
measures the contrast variation of the same ob-
ject of
¯
Y
M
over different backgrounds — M
T
is the
background of the image after the clipping operation
and it decreases toward M as T decreases. D
2
is the
product of two different components: the former,
¯
Y
M
M
T
,
is a growing function as M
T
decreases. The latter,
|M
T
−M|
M
, is a decreasing function converging to zero
for smaller threshold values. Hence, D
2
revealsa con-
vex shape. In fact, the term
|M
T
−M|
M
gives a minor
contribution in the first part, since the clipping opera-
tor involves few pixels and then M
T
does not change
significantly. On the contrary, in the second part M
T
approaches M faster, as more points close to the back-
ground are selected, and then D
2
approaches zero.
The visual distortion D combines D
1
and D
2
us-
ing a multiplicative model, that is the conventional
way of combining contrast based measures. Since
D
1
increases while D
2
decreases, the optimal sep-
aration point is the equilibrium point of the prod-
uct of the two measures. Then, the optimal detec-
tion threshold
T is the one that realizes the maximum
value of D (see Fig. 4) and provides the frontier be-
tween image foreground and background. From that
point on, pixels of the background are selected by the
clipping operator, confusing the most visual attractive
part of image with the remaining part. The most vi-
sually important region Ω
1
in
¯
Y
r
is then defined as
Ω
1
= {(x, y) ∈ Ω :
¯
Y
r
(x, y) ≥
¯
T}.
The mean value of the colors (in the RGB color
space) of points belonging to Ω
1
is considered as the
dominant color of the region and it is set to the first
value c
1
of the color palette to be used in the quanti-
zation step. By excluding from the image the selected
region Ω
1
, the procedure can be reapplied to the re-
maining part of the image (Ω − Ω
1
) in order to select
a number of representative regions from which to ex-
tract the dominant colors to add to the desired color
VISAPP2015-InternationalConferenceonComputerVisionTheoryandApplications
326
0 2 4 6 8 10 12 14
x 10
4
0
0.05
0.1
0.15
0.2
0.25
0.3
0.35
0.4
0.45
|Ω
T
|
D(Ω
T
)
Figure 4: Distortion curve D(Ω
T
) versus the size of Ω
T
.
palette. As a result, the detection algorithm is iter-
ated K times, with K the number of desired colors
in the palette. In order to adapt the algorithm to the
number of desired colors, the value M in eq. (3) is
differently defined and computed at each iteration. In
fact, the detection algorithm can be less sensitive to
some details as K decreases; while it is the opposite
as K increases. That is why, the value M, that repre-
sents the image background, is defined as a correction
of the average value of the image to be analysed. The
correction term is defined as 1− k
|M
av
−Mo|
M
av
, where k is
the k−th region we are going to select while M
av
and
Mo respectively are the average value and the most
frequent value of
¯
Y
r
.
3.2 Algorithm
1. Convert the original RGB image to the luminance
componentY.
2. Find the best level of resolution
r via eq. (1) and
compute the blurred negative of Y, i.e.
¯
Y
r
.
3. Compute the mean value M
av
and the mode Mo
of
¯
Y
r
and repeat the following steps K times (for
k = 1, 2, . . . , K)
• Compute the mean value of
¯
Y
r
; set M =
M
1− k
|M
av
−Mo|
M
av
and evaluate eq. (3).
• For each integer T ∈ [M, 255], in decreasing
order, evaluate D(Ω
T
).
• Extract the optimal
T as the maximum point of
the curve (|Ω
T
|, D(Ω
T
)).
• Extract the binary mask: Ω
k
(x, y) =
1 if
¯
Y
r
(x, y) ≥
T
0 otherwise.
• Compute the average color c
k
of image pixels
such that Ω
k
(x, y) = 1 and put it in the palette.
• Set Ω = Ω − Ω
k
and
¯
Y
r
=
¯
Y
r
(Ω)
4. Assign to each pixel in the original image
the closest color in the selected color palette
{c
1
, c
2
, . . . , c
K
, } and let I
Q
the quantized image.
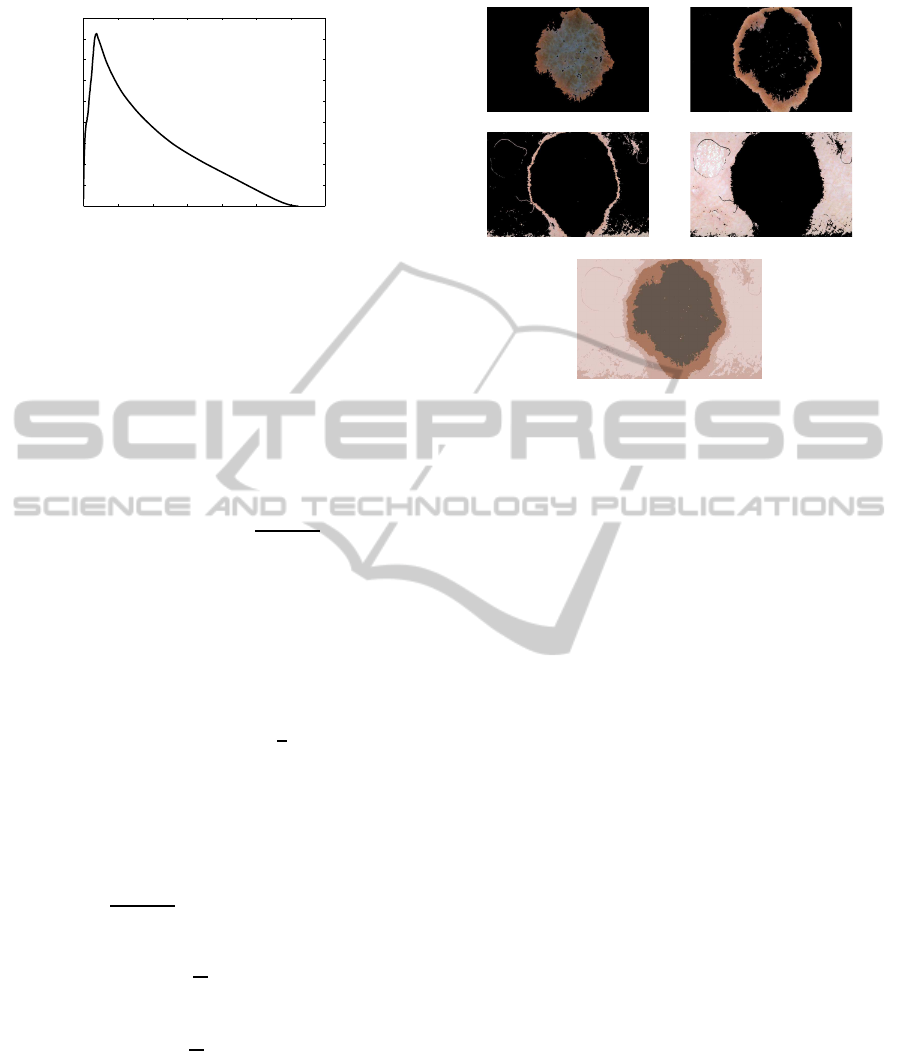
Figure 5: Test Image Nml012. From left to right, top to
bottom: regions Ω
1
, Ω
2
, Ω
3
, Ω
4
selected by the proposed
algorithm and the quantized image (K = 4).
4 EXPERIMENTAL RESULTS
The proposed method has been tested on several im-
ages extracted from different dermoscopy databases.
The results presented in this section concern eight test
images contained in the database included in (Argen-
ziano et al., 2002) in order to provide fair comparative
studies with existing methods.
Accounting for the medical interest for the charac-
terization of melanoma according to its different col-
ors, the results we are going to present in this sec-
tion concern the selection of very few colors from
the original image to be used in the definition of the
new color palette, i.e., K = 4, 6, 8, that is fixed by
the user. The quantization results will be measured
in terms of Mean Square Error (MSE) between the
original and the quantized image, and also in terms of
Mean Absolute Error (MAE). The evaluation of the
results will be made by means of comparisons with
some well knownmethodsfor CQ, especially the ones
that have been used in the processing of dermoscopic
images. To this aim we have considered the work in
(Celebi et al., 2013) (WSM), since it is very recent
and provides very impressive results on dermoscopic
images. In addition, it provides several comparative
studies with existing CQ algorithms. WSM consists
of an optimization of the classical K-means clustering
procedure from both computational and faithfulness
of the results points of view. In particular, it refines
the inizialization step of the K-means algorithm and
optimizes its implementation. In addition, we com-
pare the proposed method with the Median-Cut (MC)
AutomaticPerceptualColorQuantizationofDermoscopicImages
327

Table 1: MSE and MAE (in the brackets) results on some test dermoscopic images achieved by the methods in (Heckbert,
1982; Wu, 1991; Cheng and Yang, 2001; Celebi, 2009; Celebi et al., 2013) and the proposed one for a different number K of
colors in the palette.
Method K Acl285 Nbl034 Nbl063 Nml012 Ael484 Fel096 Nml024 Newl012
4 759.1 1177.3 1610.4 1400.2 625.9 945.4 1761.6 770.5
(35.7) (47.5) (54.9) (46.3) (31.6) (41.3) (56.2) (36.8)
MC 6 639.1 939.8 892.2 520.0 524.6 787.5 1016.2 655.8
(33.2) (41.9) (41.8) (31.2) (29.7) (38.2) (43.0) (34.8)
8 526.1 761.7 791.0 418.4 379.5 762.8 960.7 528.9
(30.2) (37.5) (39.2) (27.8) (26.0) (37.6) (41.6) (31.9)
4 823.9.4 1325.0 1283.6 1331.8 684.2 1027.1 1735.5 852.7
(37.9) (50.6) (50.3) (46.6) (34.8) (43.2) (56.3) (39.9)
CY 6 433.9.9 777.6 708.1 479.9 410.9 572.3 956.7 567.5
(26.3) (37.9) (36.5) (29.6) (27.8) (31.1) (42.2) (31.0)
8 329.5.0 533.1 486.5 371.0 234.9 424.5 561.0 381.0
(22.8) (30.9) (29.7) (25.5) (19.6) (27.8) (32.8) (26.4)
4 786.7 1249.0 1086.0 922.6 598.6 1182.1 1444.3 776.1
(36.2) (48.1) (44.0) (38.1) (30.3) (44.0) (52.6) (37.2)
WU 6 477.6 779.9 751.0 458.0 295.3 540.4 825.2 477.7
(27.3) (37.1) (36.3) (27.4) (20.5) (30.4) (38.8) (28.5)
8 283.7 628.2 509.9 306.8 228.6 380.1 592.9 354.0
(22.0) (33.1) (28.6) (22.7) (17.9) (24.5) (32.4) (24.1)
4 718.8 1242.5 1085.8 1133.4 1070.9 1329.8 1443.2 1000.4
(33.5) (49.5) (44.9) (45.6) (30.6) (40.1) (53.0) (35.8)
ADU 6 406.7 648.3 674.9 466.7 685.3 491.9 789.0 409.2
(24.6) (33.6) (34.7) (28.2) (24.3) (29.4) (38.5) (26.3)
8 297.1 476.3 457.3 292.1 240.4 334.2 587.5 310.2
(21.3) 29.0) (27.3) (22.0) (16.4) (23.1) (32.9) (22.2)
4 714.6 1147.0 1062.2 789.1 522.8 884.4 1316.6 726.6
(33.0) (46.5) (43.7) (37.1) (29.1) (40.3) (50.5) (35.6)
WSM 6 359.8 637.0 726.2 412.8 256.5 436.8 763.7 393.8
(24.5) (33.6) (35.8) (26.3) (19.7) (27.1) (37.2) (26.4)
8 234.5 458.9 405.4 274.3 173.5 313.1 550.7 281.8
(19.9) (28.4) (26.8) (21.5) (15.9) (22.5) (31.6) (22.4)
4 658.4 1126.1 986.7 546.9 415.1 786.9 1613.8 711.2
(33.7) (48.9) (44.1) (31.4) (26.2) (36.2) (53.0) (35.2)
PCQ 6 319.9 640.2 623.0 349.9 253.9 420.7 765.3 508.2
(23.5) (34.2) (32.2) (24.1) (17.3) (26.4) (37.6) (26.8)
8 199.0 516.7 577.5 292.8 226.4 302.2 565.5 431.3
(18.1) (29.4) (29.5) (21.6) (15.2) (21.0) (32.3) (23.4)
(Heckbert, 1982) and its modifications in (Cheng and
Yang, 2001) CY and (Wu, 1991) WU. Similarly to
the proposed method, all of them are based on a re-
cursive optimization of color histogram but they use
different criteria and measures (respectivelyvariances
and directional distances from the mean) that do not
explicitely depend on visual perception rules. The re-
sults have also been compared with the Adaptive Dis-
tributing Units (ADU)(Celebi, 2009) that is a learn-
ing clustering algorithm. Even though some of these
methods are not recent, they perform quite well on
dermoscopic images.
Table 1 gives MSE and MAE results provided by
the selected methods and the proposed one, indicated
with PCQ (Perceptual Color Quantization), on the
same test images and for different number of desired
colors K; the best results are in bold. As it can be ob-
served, the proposed method is able to outperfom its
competitors in most cases. In particular, it is able to
greatly improve WSM results when the desired num-
ber K of colors in the palette is small, while it shows
comparable results when K increases. This is very in-
teresting as the challenge of any information coding
framework is to get better performance at very low
bit rates. It is worth noting that the proposed method
does not use any refinement of both the final and the
partial results in the definition of the color palette. As
it can be observed in Figs. 5 and 6, the quantized
image reflects the color content and also the nature of
the image content, giving a consistent segmentation of
skin anomalies and skin itself. Figure 5 also depicts
all the intermediate steps of the detection procedure
and shows the regions from which the dominant color
is extracted.
VISAPP2015-InternationalConferenceonComputerVisionTheoryandApplications
328
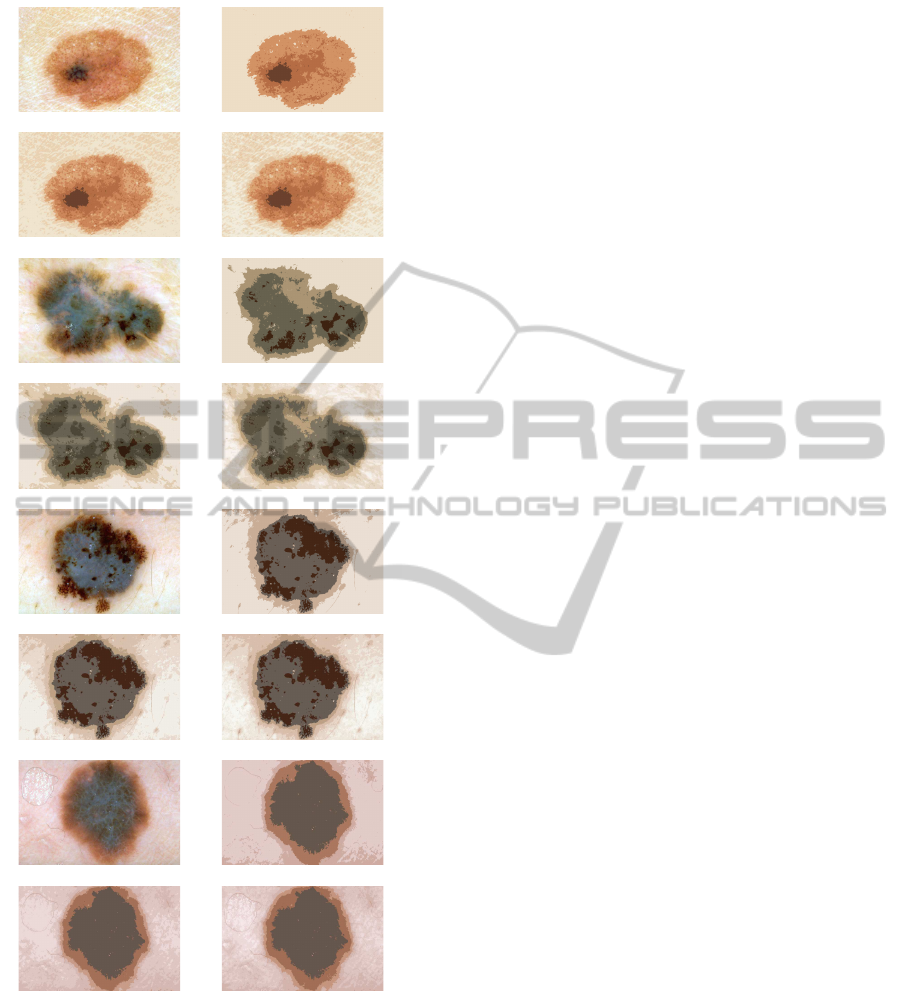
Figure 6: For each selected test image: original image and
its quantized version for different number of desired colors
(from top to bottom: K = 4, 6, 8).
It is worth stressing that the proposed method is
completely automatic, since it is able to adapt to the
analysed image thanks to the consistent use of per-
ception rules in the whole procedure (from the pro-
jection space to the selection of the best threshold
for separating image background and foreground). It
is also competitive from the computational point of
view. In fact, as it is evident from the Algorithm,
the method uses simple linear operations or compar-
isons. In particular, the complexity of the method de-
pends on the number of colors K in the final palette as
well as on the number of gray levels N
′
in the pro-
jected and filtered luminance component (i.e. less
than 256). Hence, the complexity of each iteration
of the method (step 3 of the Algorithm) is O(N
′
), and
then the complexity for the selection of the colors in
the final palette is O(KN
′
). The additional cost re-
quired by the computation of
¯
Y
r
is proportional to the
image size and does not depend on the desired num-
ber of colors K, making the method competitive even
with respect the computational point of view.
5 CONCLUSIONS
The paper has presented a new method for CQ of der-
moscopic images that is based on the use of some vi-
sual perception laws at the early stage. The goal of
the method is to detect in a hierarchical way those
regions in the image that attract human attention at
the first glance, and to derive from each of them a
dominant color to use in the successive quantization
step. To this aim the color image is transformed in
a gray-level image at a given resolution where the
brighter parts represent the regions that attract hu-
man attention at the first glance; then, a proper vi-
sual distortion measure is used for iteratively select-
ing adaptive thresholds that separate regions having
different visual importance. Presented results are en-
couraging since the method is completely automatic,
image dependent and requires low computing time,
resulting competitive with existing approaches. Fu-
ture research will be oriented to the extension of the
method to a wider class of images. This extension
would require the choice of a projection space that
is more consistent with the way colors are perceived
by human eye, and a finer extraction of the dominant
color in each selected region.
ACKNOWLEDGEMENTS
The Authors would like to thank Prof. Celebi for hav-
ing encouraged their research in color quantization of
dermoscopic images.
REFERENCES
Argenziano, G., Soyer, H., and Giorgi, V. D. (2002). Der-
moscopy:a tutorial. EDRA Medical Publishing and
AutomaticPerceptualColorQuantizationofDermoscopicImages
329

New Media, +cd edition.
Battiato, S., Mancuso, M., Bosco, A., and Guarnera, M.
(2001). Psychovisual and statistical optimization of
quantization tables for dct compression engines. In
Proc. 11th Int. Conf. Image Analysis and Processing.
Beghdadi, A., Larabi, M., Bouzerdoum, A., and
K.M. Iftekharuddin, K. M. (2013). A survey of per-
ceptual image processing methods. In Signal Process-
ing: Image Communication, 28, 811-831.
Braquelaire, J. and Brun, L. (1997). Comparison and opti-
mization of methods of color image quantization. In
IEEE Trans.on Image Processing, 6 1048-052.
Braun, R. P., Rabinovitz, H., Oliviero, M., Kopf, A., and
Saurat, J. (2005). Dermoscopy of pigmented skin le-
sions. In Journal of the American Academy of Derma-
tology, 52 (1), 109-121.
Brun, L. and Trmeau, A. (2002). Digital color imaging
handbook, chapter 9: Color quantization. In Electrical
and Applied Signal Processing. CRC Press.
Bruni, V., Crawford, A., Kokaram, A., and Vitulano, D.
(2013). Semi-transparent blotches removal from sepia
images exploiting visibility laws. In Signal Image and
Video Processing, 7(1), 11-26.
Bruni, V., Crawford, A., and Vitulano, D. (2006). Visibility
based detection of complicated objects: a case study.
In Proc. of IEE CVMP 06.
Burger, W. and Burge, M. (2009). Principles of Digital Im-
age Processing. Undergraduate Topics in Computer
Science, Springer-Verlag.
Celebi, M. (2009). An effective color quantization method
based on the competitive learning paradigm. In Proc.
of Int. Conf. on Image Proc., Computer Vision and
Pattern Rec.
Celebi, M., Wen, Q., Hwang, S., and Schaefer, G. (2013).
Color quantization of dermoscopy images using the k-
means clustering algorithm. In Color Medical Image
Analysis, 87-107. Celebi, M. E., Schaefer, G. Eds.,
Lecture Notes in Computational Vision and Biome-
chanics, 6, Springer.
Celebi, M. E. (2011). Improving the performance of k-
means for color quantization. In Image and Vision
Computing 29, 260-271.
Celebi, M. E., Hwang, S., and Wen, Q. (2014). Color
quantization using the adaptive distributing units al-
gorithm. In Imaging Science Journal 62(2), 80-91.
Cheng, S. and Yang, C. (2001). Fast and novel tech-
nique for color quantization using reduction of color
space dimensionality. In Pattern Recognition Letters,
22(8):845-856. Elsevier.
Frazor, R. and Geisler, W. (2006). Local luminance and
contrast in natural in natural images, 46. In Vision
Research.
Gonzalez, R. C. and Woods, R. E. (2002). Digital Image
Processing. Prentice Hall, 2nd edition.
Heckbert, P. (1982). Color image quantization for frame
buffer display. In Proc. ACM SIGGRAPH ’82 16(3),
297-307.
Hruschka, E., Campello, R., Leon, A. F. F. P., and de Car-
valho, A. (2009). A survey of evolutionary algorithms
for clustering. In IEEE Trans. on Systems, Man, and
Cybernetics, Part C: Applications and Reviews VOL.
39, 2, pp. 133-155.
Korotkov, K. and Garcia, R. (2012). Computerized analy-
sis of pigmented skin lesions: A review. In Artificial
Intelligence in Medicine, 56, 69-90.
Kuriki, I. (2004). Testing the possibility of average-color
perception from multi-colored patterns. In Optical Re-
view, 11 (4), 249-257.
Mallat, S. (1998). A wavelet tour of signal processing. Aca-
demic Press.
Monte, V., Frazor, R., Bonin, V., Geisler, W., and Corandin,
M. (2005). Independence of luminance and contrast
in natural scenes and in the early visual system 8(12).
In Nature Neuroscience.
Moorthy, A. and Bovik, A. (2009). Visual importance pool-
ing for image quality assessment. In IEEE Journal on
Special Topics in Sig. Proc., 3(2).
Palomo, E. and Domnguez, E. (2014). Hierarchical color
quantization based on self-organization. In Journal of
Mathematical Imaging and Vision, 49,1-19.
Plataniotis, K. and Venetsanopoulos, N. (2000). Color im-
age processing and applications. In Communications
of the ACM, 34, 30-44.
Ramella, G. and di Baja, G. S. (2013). A new technique
for color quantization based on histogram analysis and
clustering. In International Journal Pattern Recogni-
tion and Artificial Intelligence, 27 (3).
Rosch, E. (1978). Cognition and categorization, principles
of categorization. In Rosch, E., Lloyd, B.B. Ed., Erl-
baum, Hillsdale.
Schaefer, G. and Nolle, L. (2014). A hybrid color quantiza-
tion algorithm incorporating a human visual percep-
tion model. In Computational Intelligence.
Wallace, G. (1991). The jpeg still picture compression stan-
dard. In Communications of the ACM, 34, 30-44.
Weeks, A. R. (1998). Fundamentals of electronic image
processing. In SPIE-The International Society for Op-
tical Engineering, Bellingham, Washington USA.
Winkler, S. (2005). Digital Video Quality, Vision Models
and Metrics. Wiley.
Wu, X. (1991). Efficient statistical computations for opti-
mal color quantization. In Graphics gems. Academic
Press.
VISAPP2015-InternationalConferenceonComputerVisionTheoryandApplications
330
