Automatic Illustration of Short Texts via Web Images
Sandro Aldo Aramini, Edoardo Ardizzone and Giuseppe Mazzola
Dipartimento di Ingegneria Chimica, Gestionale, Informatica, Meccanica (DICGIM)
Università degli Studi di Palermo, Viale delle Scienze bd.6, 90128, Palermo, Italy
Keywords: Automatic Illustration, Story Picturing, Semantic Similarity, Semantic Space, Text Analysis, Web Image
Search, Google Image.
Abstract: In this paper we propose a totally unsupervised and automatic illustration method, which aims to find onto
the Web a set of images to illustrate the content of an input short text. The text is modelled as a semantic
space and a set of relevant keywords is extracted. We compare and discuss different methods to create se-
mantic representations by keyword extraction. Keywords are used to query Google Image Search engine for
a list of relevant images. We also extract information from the Web pages that include the retrieved images,
to create an Image Semantic Space, which is compared to the Text Semantic Space in order to rank the list
of retrieved images. Tests showed that our method achieves very good results, which overcome those ob-
tained by using a state-of-the-art application. Furthermore we developed a Web tool to test our system and
evaluate results within the Internet community.
1 INTRODUCTION
In recent years the growing integration between
digital cameras and portable devices (mobile phones,
PDAs or tablets) has dramatically increased the
number of pictures available on the Web. New In-
ternet services, e.g. Flickr, Panoramio, Smugmug,
Picasa, were offered to the users as online storage
services for their photos, creating huge databases of
pictures, that implicitly contain an immense amount
of information. These online collections of images
consist not only of raw pictures, but also of tags,
annotations and descriptions. Each photo individual-
ly provides a low information content, but if we
consider the whole content of the online collections
we are able to extract useful information for differ-
ent purposes. The key concept is that the desired
content is already available onto the Web and we
need just to retrieve, filter and organize it. In this
way every single photo, tag or comment uploaded by
a user on the Web becomes automatically a new
information resource, and can be potentially exploit-
ed by any user who needs it.
The aim of this work is to exploit the resources
of the Web (photos, descriptions, text) for automatic
text illustration, i.e. finding pictures which best illus-
trate the content of a text. Our system works without
any supervising human intervention, and avoids the
use of personal annotated database.
When users look for images on the Web by using
image search engines (e.g. Google Images), they
type one or more keywords in a provided space, and
then they have to select the most relevant images
from the retrieved list. Our goal is some steps be-
yond. Our automatic text illustration method needs
as input only the text to be illustrated, and gives as
output a ranked list of images representing the con-
tent of the whole text. Therefore users do not need to
choose the proper keywords to create the query to
the Image Search Engine, nor to manually select the
most relevant images from the retrieved list of imag-
es.
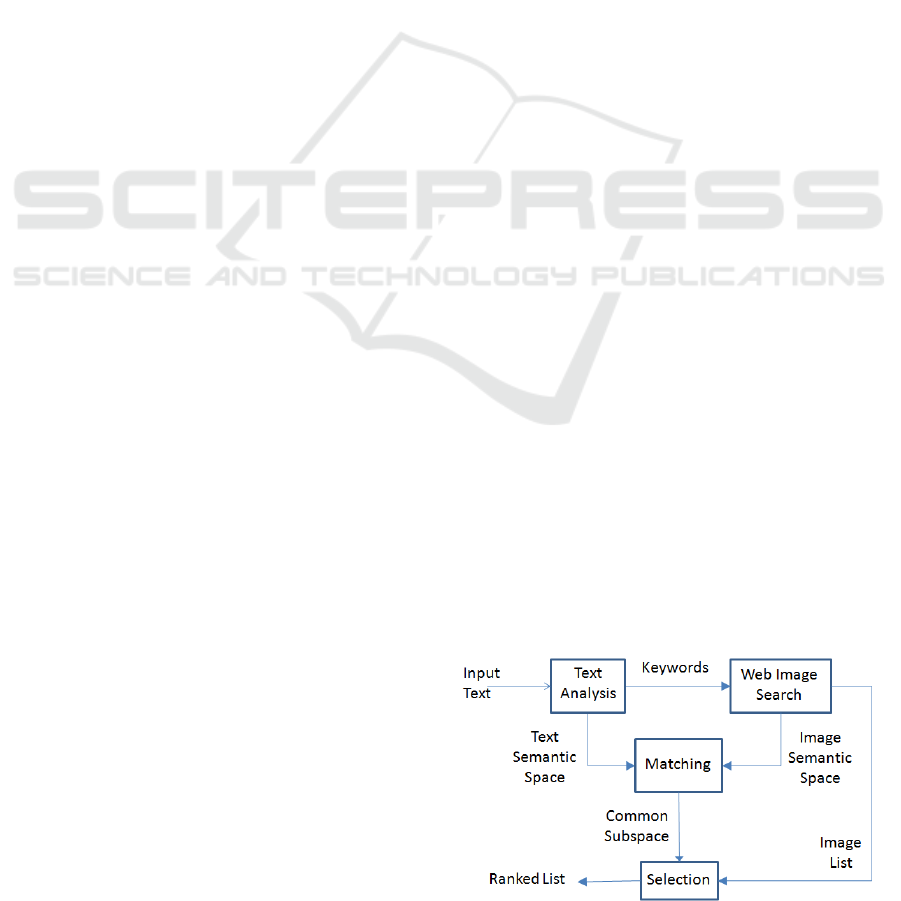
Figure 1: Overall scheme of the proposed approach.
The main contribution of this paper is the exploi-
tation of the Web, as a knowledge base, avoiding the
use of a predefined annotated image dataset. In our
139
Aramini S., Ardizzone E. and Mazzola G..
Automatic Illustration of Short Texts via Web Images.
DOI: 10.5220/0005307301390148
In Proceedings of the 6th International Conference on Information Visualization Theory and Applications (IVAPP-2015), pages 139-148
ISBN: 978-989-758-088-8
Copyright
c
2015 SCITEPRESS (Science and Technology Publications, Lda.)

system images are automatically retrieved by using a
Web image search engine, dynamically at each que-
ry, and annotated with the information extracted
from the related Web pages. Our method is able to
represent all the possible concepts that can be de-
scribed by a text, as it is not limited by the use of a
personal “ad hoc” image dataset. Furthermore it
does not need any time-consuming manual annota-
tion process.
2 RELATED WORKS
“Every picture tells a story”. This phrase dates back
to the beginning of the twentieth century and like the
other one, "a picture is worth 1000 words", suggests
us the importance of the visual communication
through pictures. The relationship between words
and pictures has been widely investigated in the past
decades. Many efforts have been spent in automatic
annotation of images, the process of finding auto-
matically textual tags representing an image (Bar-
nard et al., 2003; Cameiro et al., 2007; Feng et al.,
2004; Monay and Gatica Perez, 2007). In this paper
we focused on the dual problem, automatic illustra-
tion, i.e. the process of finding images which can
summarize the content of a text. Studies in recent
years have shown that depictive pictures aid learning
of texts (Carney and Levin, 2002). Drawings, pic-
tures or illustrations that today we can find in books,
short stories or newspapers, facilitate and speed up
reader's understanding. However, choosing the right
picture to tell a story or to introduce a concept can
be a difficult task, involving personal interpretation
of the author.
Since automatic illustration is a process involv-
ing different research areas, there are a lot of related
works into the scientific community. The under-
standing of a natural language text is still an open
problem, likewise picture understanding (Barnard
and Forsyth, 2001). However many techniques have
been developed to infer semantic information useful
to define a semantic-similarity between documents
(Kandola et al., 2003). Typical text analysis tech-
niques include latent semantic analysis (Deerwester
et al., 1990), or co-occurrence statistical information
(Yutaka and Ishizuka, 2004). Even if some ap-
proaches have been proposed (Coyne and Sproat
2001; Zhu et al., 2007; Joshi et al., 2006; Miller,
1990; Feng and Lapata, 2010; Rasiwasia et al., 2010;
Coelho and Ribeiro, 2011; Delgado et al., 2010),
automatic illustration is a problem far away to have
a definitive solution. WordsEye (Coyne and Sproat
2001) is an interesting method for automatically
converting text into representative 3D scenes, but it
does not focus on natural images. (Zhu et al., 2007)
presented a system to create a synthetic image from
an input text, as a “collage” of pictures that represent
some relevant keywords of the text. The "Story Pic-
turing Engine” (Joshi et al., 2006) is an automatic
illustrator that performs text illustrations by using
Wordnet (Miller, 1990), within an annotated data-
base, and a mutual reinforcement-based ranking
algorithm. (Feng and Lapata, 2010) presented a
probabilistic approach for automatic image annota-
tion and text illustration, based on the assumption
that images and their co-occurring textual data are
generated by mixtures of latent topics. The problem
of joint modelling the text and image components of
multimedia documents (cross-modal retrieval), has
been also studied by (Rasiwasia et al., 2010). (Coe-
lho and Ribeiro, 2011) proposed a method which
combines text mining techniques and visual de-
scriptors, within an annotated dataset, to illustrate
arbitrary texts. (Delgado et al., 2010) proposed a
framework that generates automated multimedia
presentations to assist news readers.
3 SYSTEM OVERVIEW
The goal of the proposed method is to look for a set
of images representing the content of an input text,
exploiting the Web knowledge and without any user
supervision.
Fig. 1 shows the overall scheme of the proposed
method. Input text is processed into the text analysis
block, which returns some keywords that summarize
the text content, and a model of its semantic mean-
ing (Text Semantic Space). Keywords are used to
query to an Image Search Engine for a set of images
related to these words (Image List). As well, some
more information are extracted from the Web pages
which include the retrieved images, and processed in
order to create a model of the concepts related to
these images (Image Semantic Space). The two
spaces are intersected to find the Common Sub-
space, and the retrieved images are ranked on the
base of the words that are into this subspace.
Before describing in detail each step of our
method, in the next section we will briefly discuss
some theory about Semantic Spaces, which are used
to model both text and image content.
4 SEMANTIC SPACES
In this section we briefly introduce the notion of
IVAPP2015-InternationalConferenceonInformationVisualizationTheoryandApplications
140
Semantic Space. According to (Lowe, 2001), “a
semantic space model is a way of representing simi-
larity of typical context in a Euclidean space with
axes determined by local word co-occurrence
counts”. The co-occurrence of a target word within a
dictionary of D fixed words corresponds to the word
position in a space of dimension D. In this space the
word position with respect to the other words ex-
presses the similarity of their meanings in the ana-
lyzed context.
A Semantic Space model is a quadruple <W, L,
S, R> where:
- W is the set of basis elements (i.e. words);
- L is a lexical association function, to map words
into the basis;
- S is a similarity measure between words;
- R is a transformation that reduces the dimension-
ality of the semantic space.
In the next sections we will explain how Seman-
tic Spaces are used to represent the text and the im-
age contents.
5 PROPOSED METHOD
Text analysis methods are typically designed to
study a text within a set of documents (corpus) with
similar contents, which often defines a specific do-
main of knowledge. In our work we focused onto
single texts, without any reference corpus of related
documents, then we cannot use any other infor-
mation but the input text. On the other hand, we are
not limited to a specific domain of knowledge. The
purpose of the Text Analysis module is twofold:
- represent the text content as a Semantic Space
model;
- extract keywords which are representative of the
text.
We aim to model the text content in a compact
and significant form, as well as to extract relevant
keywords. Input text is first scanned to build a dic-
tionary with all its words, and to count related fre-
quencies. The dictionary is filtered to remove com-
mon words (articles, prepositions, etc), the “stop-
words’, which are very frequent in a text, but are not
significant to represent its content.
Our system works with two languages (English
and Italian) and with two different lists of stop-
words. It can be easily extended to other languages,
as only a new list of stop-words is needed.
5.1 Text Semantic Space
To create a Semantic Space, we divide the input text
into sentences. Let n
S
be the number of sentences in
the text. Given a set of N words (w
1
, w
2
, .., w
N
), we
count the number of co-occurrences of the words
into the sentences, that is the number of times in
which two words are in the same sentence. We focus
only on the N most frequent words in the text, where
N is a value which is supposed to be large enough to
capture the text semantic content (see in section 6).
We create a NxN co-occurrence matrix C in which
each term indicates the number of sentences in
which the i-th and the j-th co-occur. These terms are
divided by the number of sentences n
S
:
()
()
()
S
n
s
s
ji
s
n
jic
jic
otherwise
swwif
jic
S
=
=
∈
=
1
,
,
0
,1
,
(1)
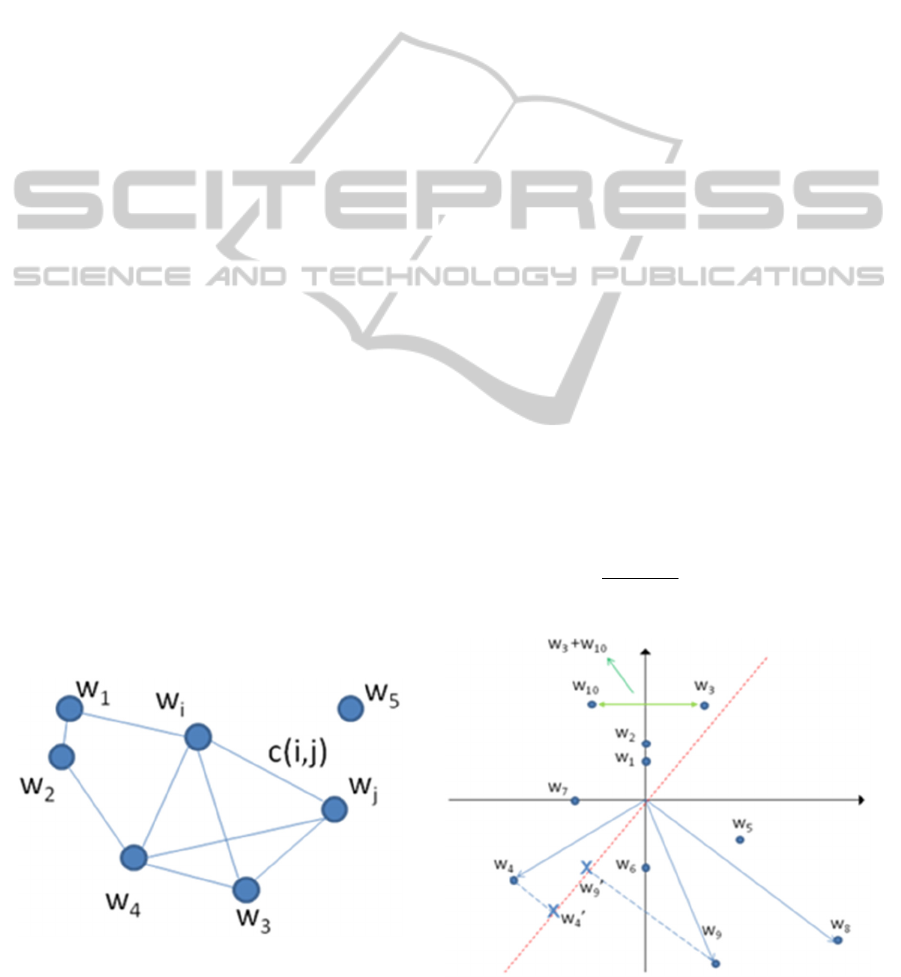
Figure 2: A graph plotting a Semantic Space. Figure 3: The reduced Text Semantic Space, projected
along the principal components axis.
AutomaticIllustrationofShortTextsviaWebImages
141

According to the model presented in section 4:
- W
T
is the set of words in the text;
- L
T
is the identity function, so raw frequencies are
used;
- S
T
is the normalized co-occurrence c(i,j) of two
words into the sentences of the text;
- R
T
reduces the space dimensionality selecting on-
ly the N most frequent words.
The Text Semantic Space (TSS) can be plotted as
a graph (fig. 2), in which the words w
i
are the nodes,
while the normalized co-occurrence values c(i,j) are
the weights of the edges. In general, the TSS graph
may be not completely connected, as some words
may occur alone in the sentences.
Note that many text analysis methods use TF-
IDF (term frequency–inverse document frequency)
measure to build a Semantic Space. TF-IDF is a
statistical measure that is used to evaluate the im-
portance of a word within a set of documents (cor-
pus). It is proportional to the number of times a word
appears in a document, but decreases as the word
occurs frequently in the rest of the corpus. We de-
cided to use raw frequencies, rather than TF-IDF, as
we do not have a corpus of documents but a single
text. Even considering the input text as the whole
corpus, and the sentences as the documents to be
analyzed, the probability that a (relevant) word oc-
curs more than once in a sentence is negligible, then
we decided to use word frequency for our purposes.
The choice to work onto a single text is a strictly
constraint, but it allows our method to adapt to any
type of query and to represent any type of content.
5.2 Keyword Extraction
Keyword extraction is a fundamental technique for
document summarization and retrieval. If the proper
keywords are selected, a reader can easily under-
stand the content of a document and its relationships
with the other texts in a corpus of related documents.
The goal of this step is to select some words to a
query an image search engine, in order to find a list
of candidate images that can illustrate the content of
the input text. We decided to use two keywords to
represent the text content. We noted that using a
single keyword would result in a too generic query,
as it can represent a too generic concept. Further-
more, if we use a combination of two words, rather
than only one, we drastically reduce the problem of
polysemy. In fact the second word specifies the
meaning of the first one, defining the context of the
query. Note that we focused our study onto short
texts (e.g. news) as our method aims to find a single
image representing the content of the whole text. In
fact, in case of longer texts, one single image may be
not enough descriptive to represent the content of
the whole document. On the other hand, in case of
short texts, the use of only two words as keywords
may be a tight constraint. Furthermore, with each
query, we retrieve such a huge quantity of infor-
mation from the Web that we can still have, after
filtering, enough information for our purposes. The
gain of information, with respect to the starting que-
ry, will be one of the criteria used during the valida-
tion phase of the results.
We also conducted some preliminary experi-
ments using more than two keywords, and we did
not note any significant improvement of the results.
However, we plan to conduct in the future more
experiments, to analyze in depth the influence of the
number of keywords on the results.
After having filtered the stop-words from the
text, we use five different methods to extract the
keywords:
- The two most frequent words (MF);
- The two maximum co-occurring words (MC);
- Three methods deriving from the Principal Com-
ponent Analysis of the normalized co-occurrence
(NC) matrix.
The first method simply extracts the two most fre-
quent words in the text. The second one computes
the two words that most frequently co-occur in the
sentences of the text. The last three methods are
inspired to the LSA (Deerwester et al., 1990) ap-
proach, and work within the projected text semantic
space (PTSS). The PTSS is built applying the Prin-
cipal Component Analysis to the NC matrix, extract-
ing the two major components, and projecting the
columns of NC (that are the word vectors) onto the
principal component space. We decided to work into
a 2D-space as, in almost all of our experiments, the
cumulative sum of the eigenvalues of the first two
eigenvectors is above the 90%, that is a good ap-
proximation of the whole energy content. Each word
vector is then projected as a point in PTSS (fig. 3),
but in some cases we need to further process some
peculiar points of the new space. We observed that if
two word vectors are projected onto the same point,
or are symmetrical to one of the axis or the origin,
the corresponding words co-occur in the text always
in the same sentences. Therefore they probably are
related to the same concept, or are part of a compo-
site word, and are considered as a single word when
creating the query. Hence sometimes the final query
may be composed by more than two words.
Regarding the geometrical interpretation, the
norm of the vectors in PTSS indicates the relevance
of the related words within the document (the text).
Hence, the word with the largest norm, for us, is the
IVAPP2015-InternationalConferenceonInformationVisualizationTheoryandApplications
142

most relevant for the input text (w
8
in fig. 3). The
choice of the second word may be guided by two
factors:
- according to the geometrical interpretation, we
select the word with the 2
nd
largest norm (Maximum
Norm – MN) (w
9
in fig.3);
- we select the word whose vector has the largest
orthogonal projection with respect to the direction of
the vector with the largest norm (Maximum Orthog-
onal - MO). It expresses the concept with the maxi-
mum semantic distance from the most relevant word
(w
4
in fig.3).
Note that in most cases the second word extract-
ed by MN and by MO methods is the same. That is
not true in general as shown by experimental results
in section 6.
The last method is a combination of MF and
MN. We select the two words which maximize the
product of the norms of their vectors in PTSS and
their normalized frequency into the text (Maximum
Weighted Norm – MWN).
5.3 Image Semantic Space
The Web Image Search module uses the two key-
words from the Text Analysis step to query an Im-
age Search Engine (i.e. Google Image) for a list of
images. First, we submit the query to the Web image
search engine and we select only the first M valid
images, which form our Image List. We use a parser
to automatically extract image links from the output
HTML Google page. Output links must be validated,
as sometimes they refer to images that no longer
exist, or that need an authentication to be download-
ed. Nevertheless, for efficiency, if we do not get a
reply from a link within a short timeout, we discard
the link (typically 30% of the image links are dis-
carded). For each valid image, we also analyze the
HTML content of the related webpage. For each
webpage we extract metadata keywords, page title
and image alternative attribute. To save computa-
tional resources, we decided to discard other infor-
mation (i.e. body text) which should be analyzed
with time consuming techniques (e.g.. LSA). Exper-
iments showed that this is a good trade-off between
precision and efficiency. Each image is then de-
scribed by a list of associated tags, which neverthe-
less includes some terms that are not related to the
image content. Tags are filtered discarding those
terms that are in a list of stop-words (similarly to
text analysis step): articles, conjunctions, adverbs,
but also spam, terms typically related to the Web
(www, website, blog) or to an image file (photo,
gallery) but not to its content. The filtering process
significantly reduces the number of words in the tag
lists, but it implies that some images will have no
tags, and will be discarded as they do not bring any
useful information. At last, an image is described by
one or more tags, and a word is associated to differ-
ent images. Hence, we represented this information
within a Semantic Space:
- W
I
is the list of all the possible detected words,
after filtering;
- L
I
is the number of images associated to each
word;
- S
I
is based on the Jaccard coefficient:
()
()
()
()
()
ji
ji
jiI
wIwI
wIwI
wwS
∪
∩
=,
(2)
that is the number of images shared by two words w
i
and w
j
divided by the number in the corresponding
union set. This metric indicates how much two
words are correlated.
- R
I
is a thresholding process. We select from the
basis, as relevant words, those which relates to al-
most m=p*M images, where p is an input parameter
that will be discussed in section 6, and M is the im-
age dataset size.
The size of the Image Semantic Space (ISS) is
not fixed, but changes within every query, as it de-
pends on the number of words which pass the above
condition. The Image Semantic Space can be plotted
as a graph of the words’ correlations, as TSS in fig.
2. For the ISS, nodes consist of words in the basis,
reduced by R
I
, while edges are weighted by the simi-
larity measure S
I
(see eq. 2) between words. As in
text case, resulting graph may be not completely
connected, if a word does not share any image with
the other words.
5.4 Matching and Re-ranking
The final step of the process is the comparison of the
two Semantic Spaces (TSS from the text, and ISS
from the Web Image Search), in order to find the set
of images in the Image List that better represents the
text content.
We intersect the two Semantic Spaces and we
select only the words which are shared by the two
spaces (fig. 4). Each word in the Common Subspace
(CSS), as it is part of ISS, is also associated to one
or more images. Nevertheless, each image in the
Image List may have one or more tags in this sub-
space. Our goal is to extract the most relevant com-
mon concept from the two semantic spaces, discard-
ing noise. In fact, representing the two spaces as
graphs,
the best images are those related to the words
AutomaticIllustrationofShortTextsviaWebImages
143
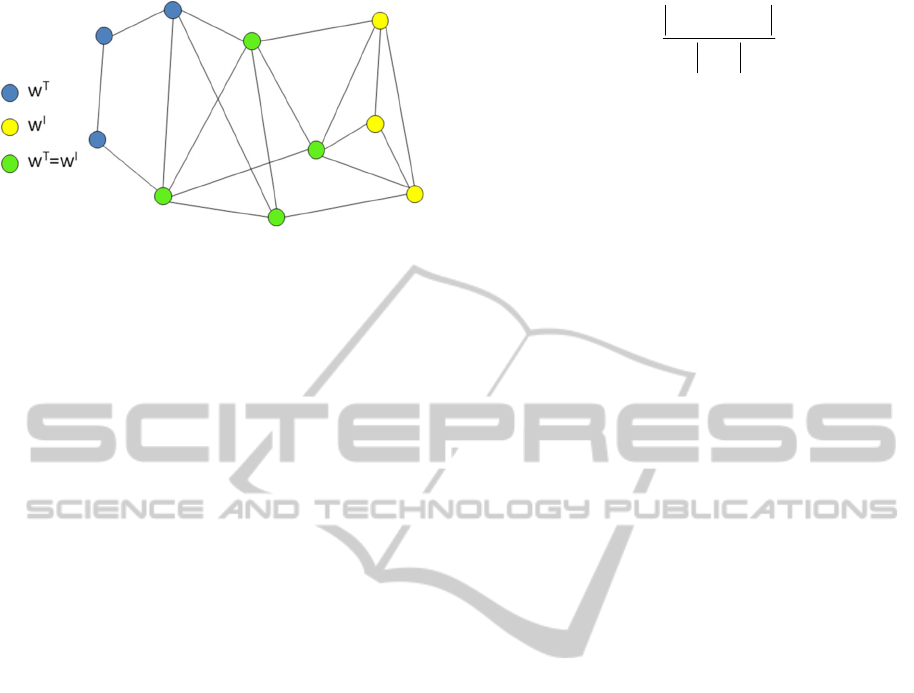
Figure 4: Matching the two Semantic Spaces. Blue nodes
are words in TSS, yellow nodes in ISS, green nodes are
words shared by the two SS.
into the largest sub-graph of ISS, which are also in
CSS. This is not a simple matching of two lists of
words. In fact the intersection of the two sub-spaces
may result in more than one subgraphs, or may pre-
sent some isolated nodes. We select all the images in
the largest connected component of the intersection
and sort them according by the number of tags they
have in this subspace. The most significant images
are those which have the maximum number of tags
associated in CSS, and are presented as output of the
system. We can observe that the matching step is
mainly based on a graph similarity approach, and
then the use of the Semantic Space theory could be
overdone. We nevertheless decided to represent the
analyzed information by using this theoretical mod-
el, as we plan to better exploit this representation in
our future works.
6 EXPERIMENTAL RESULTS
We implemented two different versions of our sys-
tem: the first one is a Matlab stand-alone prototype,
executed on an Intel Core i7 PC (4 CPU, 1.6 GHz
per processor, 4 GB RAM), exploiting the Matlab
parallel library to make 4 workers run simultaneous-
ly; the second one is web-based version, that had
been available online to the Internet community for
our tests, implemented with a client side (a simple
html page) and a server side (a Java servlet).
6.1 Stand-alone Prototype
We tested our prototype on a set of 100 randomly
selected news from the Wikinews (link1) archive.
To evaluate our system, we used both an objective
and a subjective metric. We use as objective metric
the semantic similarity of the two spaces, defined as
the size of the Common Sub-Space, divided by the
number of words in TSS:
()
TSS
ISSTSS
wwS
jiC
∩
=,
(3)
This is a measure of the semantic similarity of
the Text and the Image Semantic Spaces, and it is
related to the “gain of knowledge”, starting from the
initial query. It indicates how many new words have
been added to the starting query-words. If the nu-
merator of S
C
is 2 (the lower bound of the intersec-
tion), only of the two input keywords are shared by
the ISS and the TSS, and the query output may result
into a list of images with very different contents. No
new knowledge is gained. If S
C
is higher, the ISS
shares a larger part of its semantic content with the
input text, and it means that new semantic infor-
mation is added to the two input words.
To help us for a subjective evaluation of the re-
sults, we asked 20 persons to test the system. We
assigned to each of them 5 short texts from our da-
taset (texts are typically made of 5-20 sentences) and
asked them to read the texts and to evaluate results
obtained with all the five proposed keyword extrac-
tion methods described in section 5.2 (MF, MC,
MN, MWN, MO). Furthermore we asked them to
test the same texts also with a state-of-the-art meth-
od, the Story Picturing Engine (Joshi et al., 2006),
which has been designed for the same purpose as our
application. SPE is an automatic text illustration
method, that exploits a personal annotated database
of images. A demo was available online when we
conducted our tests (link2). We decided to compare
the two approaches in terms of final applications,
even if the two underlying datasets are different, just
because it was difficult to adapt the chosen reference
approach to our dataset, which is built dynamically
at each query and can be often described by unrelia-
ble information (html tags). Moreover, our approach,
which has been designed to work using information
taken from the Web, should be heavily modified to
work within the dataset used by SPE.
We asked testers to indicate if each retrieved im-
age (by our methods and SPE) is Very Relevant
(VR), Somewhat Relevant (SR), or Not Relevant
(NR) to the text content. Test were performed with
N=10 most significant words from the text, M=100
retrieved images, and three values of p for R
I
(when
building ISS): 0.1, 0.05, 0.03. SPE online tool has
been tested with the granularity value of 0 that, as
suggested by authors, must be selected to illustrate
the whole story instead of parts of it.
For each input text, and for each proposed key-
word extraction method, we measured the similarity
Sc and the percentage of VR, SR and NR images
into the output list of images (fig.5 shows the
IVAPP2015-InternationalConferenceonInformationVisualizationTheoryandApplications
144
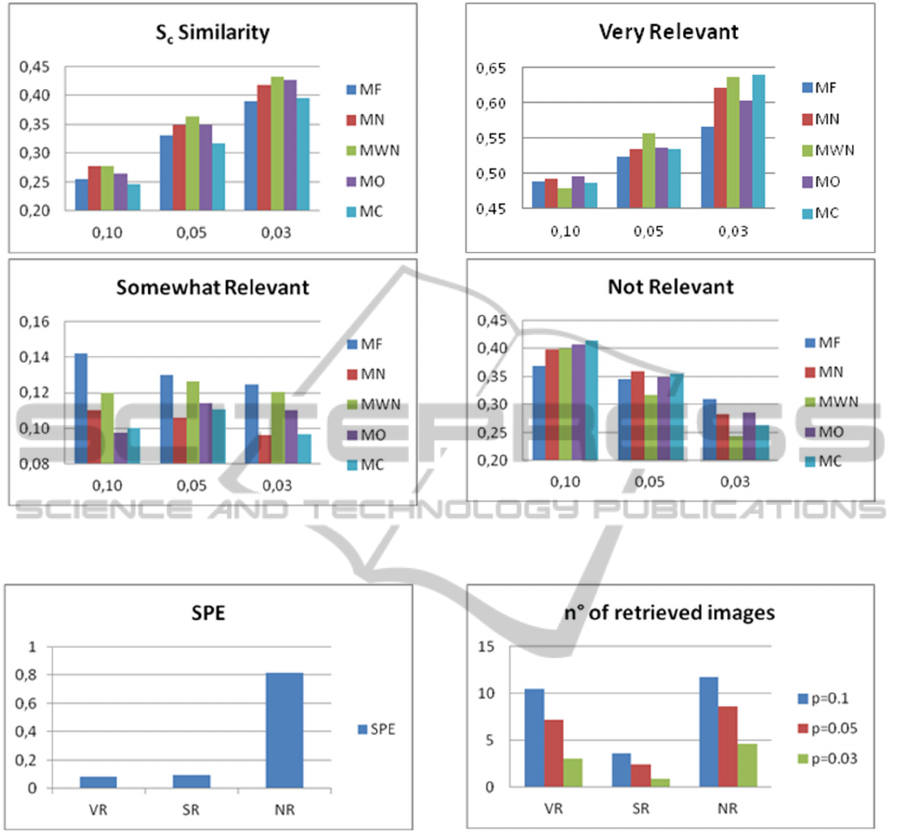
Figure 5: Average values of Sc similarity, and of percentage of VR, SR, NR images, measured for each query, versus
the p parameter, that is related to the threshold used to reduce the Image Semantic Space.
Figure 6: Averaged percentage, per query, of VR, SR
and NR images with SPE.
Figure 7: Averaged number of VR, SR and NR retrieved
images per query and per all the proposed methods.
averaged values, per query, within our dataset). Re-
sults obtained by using SPE are shown in fig. 6.
Fig.7 shows the average number of retrieved images
(VR, SR, NR) per query versus the parameter p, that
is related to the threshold process described in sec-
tion 5.3. When reducing the ISS space by using R
I
,
the lower the value of p, the lower is the minimum
number of images that a word, in ISS, must have
associated to be considered relevant, and the larger
is ISS. Experiments showed that Sc increases when
the parameter p decreases as the system works with
a larger number of words in ISS, thus increasing the
probability to share more words with TSS. Note that
we use two keywords to query for images onto the
Web, so we expect the minimum number of words
in the CSS to be larger or equal than two (the two
keywords). When setting p=0.03 each image in the
output list has, on average, 4 tags, two words more
than the two input keywords, gaining a lot of seman-
tic information with respect of the input query. As
well, the percentage (VR) of very relevant images
per query increases for lower values of p. In fact
when the two semantic spaces are very similar (Sc is
high), the query retrieves a list of relevant images,
and the precision increases. With the best configura-
tion (MWN or MC methods, p=0.03) we achieved
impressive results, more than 63% of Very Relevant
images per query that, if summed with the percent-
age of SR, grows up to a 75% of Relevant (VR+SR)
images (with MWN method and p = 0.03). On the
AutomaticIllustrationofShortTextsviaWebImages
145

Table 1: Results with the Web Server Application: Seman-
tic Similarity (SS) and average percentage, per query, of
relevant (R), not relevant (NR) and not voted (NV) images
for the two languages.
Language SS R (%) NR (%) NV (%)
English 0.35 59 33 8
Italian 0.29 52 22 26
other hand, the number of retrieved images decreas-
es with p (fig.7). In fact if ISS and TSS share a high
number of words and, as we select only the images
which have the maximum number of possible shared
tags, the output image list is reduced.
In our tests we observed two typical situations: a
“good” illustration gives as output few, but very
relevant, images; a “bad” illustration gives as output
several and not relevant images. This fact explains
why the percentage of VR retrieved images in fig. 7,
is different from that in fig. 5. Finally, a low value of
p gives the highest precision, but the lowest number
of retrieved images.
If comparing our method to Story Picturing En-
gine (link2), as expected, experiments show that our
results overcome those by SPE. Even in the worst
case, we achieved a percentage of about 50% of
Very Relevant images per query (in the best case
64%), while SPE gives less than 10% of VR images.
Note that SPE is based on a limited personal dataset
of images, annotated by authors, then it is able to
represent a small set of concepts. On the contrary,
our system works extracting the required knowledge
from the Web, creating dynamically a new image
dataset per each query, and can cover all the possible
concepts that can be expressed by a text.
Fig. 8 shows results versus the parameter p. Best
results are achieved when p=0.01. In this case que-
ries typically retrieve few images but with a lot of
associated tags (e.g. fig. 8.h shows a single image,
but that is very relevant to the input text content). It
results in a high precision and a high value of SC.
Regarding efficiency, the whole process takes 2-
3 minutes to be completed. Most of the time is spent
validating image links as described in section 5.3
(~1 sec per image, using 4 parallel workers) and
downloading metadata (0,5 sec per URL), then exe-
cution time strongly depends on the number of im-
ages retrieved by Google Image. Time spent for the
other steps of the method is negligible.
6.2 Web Server Application
Our Web server application results have been evalu-
ated, as well, using both an objective and a subjec-
tive metrics. The objective metric is the semantic
similarity defined in eq. 3. For a subjective evalua-
tion we required some help from the Internet com-
munity. We asked to the Web users to test our tool
and to leave feedbacks about returned results, select-
ing relevant and not relevant images. We stored their
feedbacks into a database to collect statistical infor-
mation about query results and their relevancy,
Feedbacks helped us to improve the method (e.g.
suggesting us new words to add to the list of stop-
words), and to evaluate our method performance.
We collected more the 1000 queries and we received
feedbacks from more or less 300 users.
Results’ precision depends on two parameters,
described in section 6: the number of images re-
trieved M and the minimum number of images m
associated to the tags (which is strictly related to the
p value described in section 6.1). We achieved the
best results, in terms of speed/precision trade-off,
working with M=25 images and p=0.04. Average
execution time is about 1 minute per query. Average
percentages of precision, per query, are shown in
Table 1, for both English and Italian languages. In
terms of Semantic Similarity, results show that we
gained knowledge with respect of the two input
keywords: each output image is tagged with more
than the two keywords used to create the query.
Precision results show that our method gives as out-
put a very low number of not relevant images, and
achieve very good results in terms of relevant imag-
es (60% circa for English queries, more than 50%
for Italian queries).
7 CONCLUSIONS
In our work we faced several problems:
- we worked with a single text, while many text
analysis techniques study documents within a corpus
of similar documents, which typically specifies the
domain of knowledge. We dynamically create the
domain at each query, without any external infor-
mation. In this way we can represent any type of
content, and we are not limited to a specific domain.
- we needed to model the text content in order to
extract relevant information, which would be com-
pared with those extracted from the Web. Semantic
Space models helped us in this step, and we used
PCA to reduce space dimensionality.
- we needed significant keywords to query an Im-
age Search Engine for a list of relevant images. We
proposed and discussed five different methods to
extract keywords from the input text or from its
models.
IVAPP2015-InternationalConferenceonInformationVisualizationTheoryandApplications
146
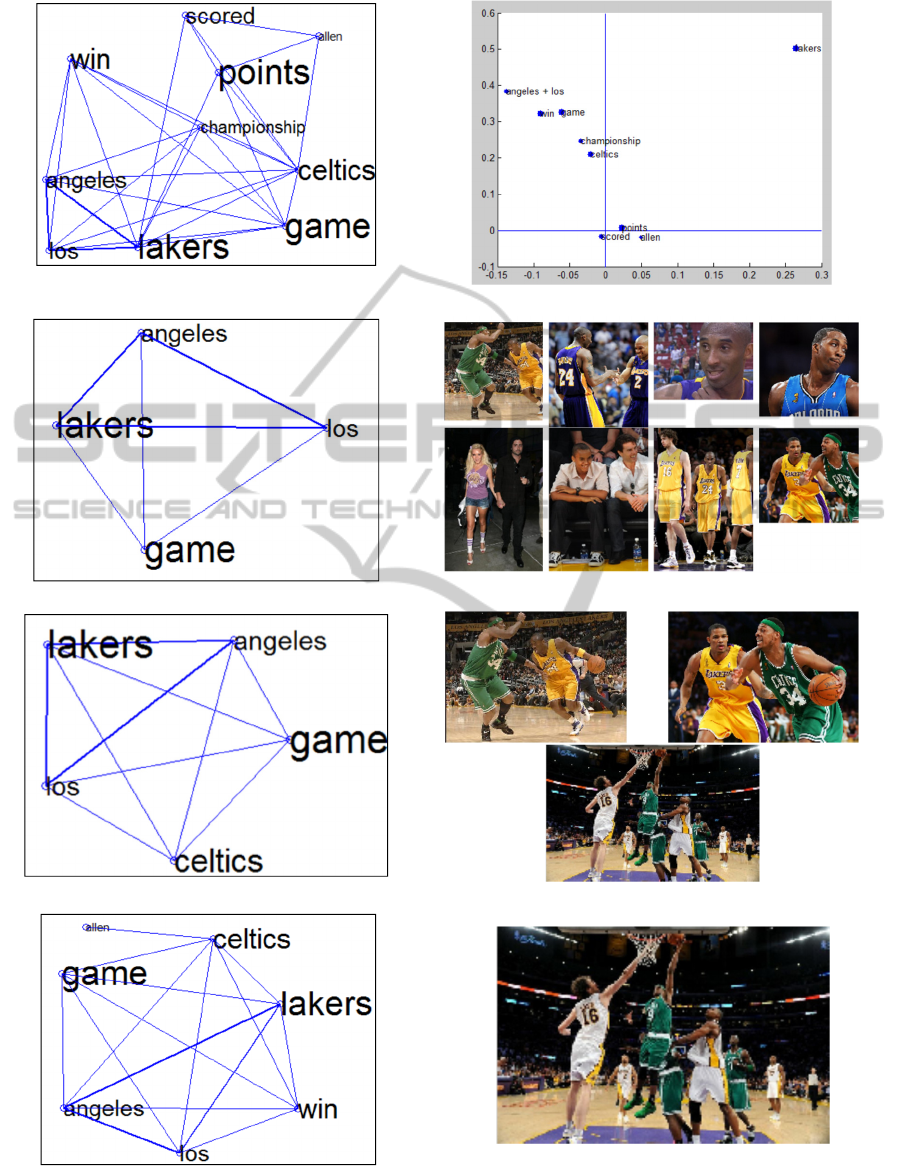
a) TSS
b) PTSS
c) CSS, p=0.1
d) Output tags: angeles, lakers, game, los
e) CSS, p=0.05
f) Output tags: angeles, celtics lakers, game, los,
g)
CSS, p=0.03
h) Output tags: allen, angeles, celtics, game, lakers, los, win
Figure 8: Results obtained with MWN with different values of p. (9.d shows only part of the output list). Input text at
(link3).
AutomaticIllustrationofShortTextsviaWebImages
147

- we had to represent the content of the images of
the Web. We extracted information from the Web
pages containing the retrieved images, i.e. metadata,
and we modelled this content as a Semantic Space,
similarly to the text case.
- we needed to compare the two Semantic Space.
For that, we defined a similarity measure which
indicates how much the two spaces relates to the
same semantic meaning.
- we needed to re-rank the list of retrieved images.
We propose to extract the words from the common
subspace of the two semantic spaces. Images are
ranked on the basis of the number of tags they share
in the common sub-space.
Results are very satisfactory, and impressive if
compared to those obtained with SPE. The main
difference between the two methods is the image
dataset. SPE uses a personal collection of photos,
annotated by hand, hence is very limited by the
number of images and by the concepts represented
in its dataset. We use Google Image to create, dy-
namically at each query, a new image dataset to
work within. Thus we exploit the knowledge of the
Web, increasing the chances to find images relevant
to the text content.
Furthermore our method has been designed to be
multi-language, as it can be easily extended to other
language if the proper list of stop-words is created.
We also developed a Web implementation of the
proposed method, as a new service to Internet users.
We are confident that our solution will interest
news or advertising agencies, newspapers websites,
bloggers or in general all the users who search for
information into the Web.
At last, the “core” of our system is general pur-
pose, and can be used to compare texts, HTML pag-
es, and all types of annotated document, that can be
retrieved from the Web. That is, we can use Google
Search (Youtube, Wikipedia, etc.) instead of Google
Image, to query for any type of tagged contents
which can be useful to describe an input text.
REFERENCES
Barnard, K., Duygulu, P., et al., 2003. Matching words
and pictures. JMLR, 3:1107–1135.
Barnard, K., and Forsyth, D., 2001. Learning the Seman-
tics of Words and Pictures. Proc. International Con-
ference on Computer Vision, pp. II: 408-415, 2001.
Carney, R. N., and Levin, J. R., 2002, “Pictorial illustra-
tions still improve students' learning from text”, Edu-
cational Psychology Review, 2002, 14(1), 5-26.
Carneiro, G., Chan, A., et al., 2007. Supervised learning of
semantic classes for image annotation and retrieval.
IEEE Transactions on Pattern Analysis and Machine
Intelligence, 29(3):394–410.
Carney, R. N., and Levin, J. R., 2002. Pictorial illustra-
tions still improve students' learning from text. Educa-
tional Psychology Review, 14(1), 5-26.
Coelho, F., and Ribeiro, C., 2011, Automatic illustration
with cross-media retrieval in large-scale collections. In
Content-Based Multimedia Indexing (CBMI), 2011
9th International Workshop on (pp. 25-30). IEEE.
Coyne, B., and Sproat, R., 2001. Wordseye: An automatic
text-to-scene conversion system. In Proceedings of the
28th Annual Conference on Computer Graphics and
Interactive Techniques. SIGGRAPH 2001, 487–496.
Deerwester, S., Dumais, S. T., et al., 1990. Indexing by
latent semantic analysis. Journal of the American So-
ciety For Information Science, 41(6), 391-407.
Delgado, D., Magalhaes, J., & Correia, N., 2010. Auto-
mated illustration of news stories. In Semantic Compu-
ting (ICSC), 2010 IEEE Fourth International Confer-
ence on (pp. 73-78). IEEE.
Feng, Y., and Lapata, M., 2010. Topic models for image
annotation and text illustration. In Proceedings of the
NAACL HLT. Association for Computational Linguis-
tics, Los Angeles, California, pages 831–839.
Feng, S., Manmatha, R, and Lavrenko, V., 2004. Multiple
bernoulli relevance models for image and video anno-
tation. In CVPR, volume 2(2004), pp. 1002-1009.
Joshi, D., Wang, J .Z., and Li, J., 2006. The story picturing
engine—a system for automatic text illustration. ACM
Transactions on Mul-timedia Computing, Communica-
tions, and Applications, 2(1):68–89.
Kandola, J. S., Shawe-Taylor, J., and Cristianini, N., 2003.
Learning semantic similarity, In Neural Information
Processing Systems 15 (NIPS 15), pp. 657-664.
Lowe, W., 2001. Towards a theory of semantic space. In
Proceedings of the Twenty-Third Annual Conference
of the Cognitive Science Society 2001 (pp. 576-581).
Mahwah, NJ: Erlbaum.
Miller, G. 1990. WordNet: An on-line lexical database.
Int. Journal of Lexicography, Special Issue, 3(4).
Monay, F., and Gatica-Perez, D., 2007. Modeling seman-
tic aspects for cross-media image indexing. IEEE
Transactions on Pattern Analysis and Machine Intelli-
gence, 29(10):1802–1817.
Rasiwasia, N., Pereira, J. C., et al. 2010. A new approach
to cross-modal multimedia retrieval. In Proceedings of
the International Conference on Multimedia (MM
'10), 251-260.
Yutaka, M., and Ishizuka, M., 2004. Keyword extraction
from a single document using word co-occurrence sta-
tistical information. Int’l Journal on Artificial Intelli-
gence Tools, 13(1):157–169.
Zhu, X., Goldberg, A. B., et al., 2007. A text-to-picture
synthesis system for augmenting communication. In
Proceedings of the 22nd national conference on Artifi-
cial intelligence, Vol. 2, 1590-1595 2007.
link1: http://en.wikinews.org/wiki/Main_Page.
link2: http://alipr.com/spe/
link3: http://en.wikinews.org/wiki/Los_Angeles_Lakers_
need_to_win_game_six_to_tie_NBA_championship.
IVAPP2015-InternationalConferenceonInformationVisualizationTheoryandApplications
148
