
Low Level Features for Quality Assessment of Facial Images
Arnaud Lienhard, Patricia Ladret and Alice Caplier
GIPSA-Lab, Grenoble Images Parole Signal Automatique, Grenoble, France
Keywords:
Aesthetic Quality, Automatic Scoring, Portraits.
Abstract:
An automated system that provides feedback about aesthetic quality of facial pictures could be of great interest
for editing or selecting photos. Although image aesthetic quality assessment is a challenging task that requires
understanding of subjective notions, the proposed work shows that facial image quality can be estimated by
using low-level features only. This paper provides a method that can predict aesthetic quality scores of facial
images. 15 features that depict technical aspects of images such as contrast, sharpness or colorfulness are
computed on different image regions (face, eyes, mouth) and a machine learning algorithm is used to perform
classification and scoring. Relevant features and facial image areas are selected by a feature ranking technique,
increasing both classification and regression performance. Results are compared with recent works, and it is
shown that by using the proposed low-level feature set, the best state of the art results are obtained.
1 INTRODUCTION
Social psychological studies have shown that people
form impressions from facial appearance very quickly
(Willis and Todorov, 2006) and this makes facial pic-
ture selection crucial. With the widespread use of dig-
ital cameras and photo sharing applications, select-
ing the best picture of a particular person for a given
application is a time consuming challenge. Thus, a
system providing automatically feedback about im-
age aesthetic quality would be an interesting and use-
ful tool. Searching images automatically sorted with
respect to their aesthetic scores, editing images to en-
hance their visual appeal or selecting one particular
image among an entire collection would be simplified
for home users. The features used for automated com-
putation have to be adapted to the considered applica-
tion: profile pictures on social networks are different
from pictures presented in a professional purpose (re-
sumes, visiting cards). In this work, only the general
aesthetic quality of facial images is considered, with-
out taking facial expressions or beauty into account.
1.1 Previous Work
Various attempts have been made to solve automatic
aesthetic assessment in images. Different approaches
exist: (Marchesotti and Perronnin, 2012) explore fea-
tures at pixel level whereas (Li et al., 2010) estimate
high-level attributes (smiles, eyes closeness) that can-
not directly be obtained by extracting visual data due
to the semantic gap between information contained
in pixels and human interpretation. Most of recent
works perform region of interest (ROI) extraction to
enhance their prediction results since different objects
locations, shapes or color compositions may change
the global aesthetic quality of an image (Datta et al.,
2006). ROI may be detected using sharpness estima-
tion (Luo and Tang, 2008), saliency maps (Wong and
Low, 2009; Tong et al., 2010) or object detection (Vi-
ola and Jones, 2001).
The main approach for evaluating portraits aes-
thetic quality is characterized by computing a set of
features in the subject and background regions. Often,
features such as contrast, sharpness or color distribu-
tion are computed in addition to features that describe
subject-background relationship (Jiang et al., 2010;
Tang et al., 2013). Recent features that describe high-
level aspects of images have been developed: facial
expression, age and gender of the subject, hair and
skin colors, presence of beard, etc (Dhar et al., 2011).
At the best of our knowledge, little researches
have been done on pictures containing a single frontal
face (Males et al., 2013). Plus, there are no pub-
licly available datasets containing facial images and
their aesthetic ratings, which makes comparison with
previous work difficult. In previous work (Lienhard
et al., 2014), we developed a method that segments
precisely the image (hair, shoulders, skin, back-
ground) and computed features in each region. The
545
Lienhard A., Ladret P. and Caplier A..
Low Level Features for Quality Assessment of Facial Images.
DOI: 10.5220/0005308805450552
In Proceedings of the 10th International Conference on Computer Vision Theory and Applications (VISAPP-2015), pages 545-552
ISBN: 978-989-758-089-5
Copyright
c
2015 SCITEPRESS (Science and Technology Publications, Lda.)

main result of this previous work is that facial area
is almost sufficient to describe efficiently the global
aesthetic of the picture. The proposed method defines
new image regions (eyes and mouth areas) and com-
putes additional features that enhance the aesthetic
prediction performance.
1.2 Objectives
Aesthetic evaluation depends on image content, and
evaluating a landscape is different from judging a por-
trait, where the viewer focuses on the subject face.
That is why finding faces, and studying particular re-
gions in the facial area (eyes, mouth) is important to
make a precise evaluation of portraiture aesthetics.
This article presents a method that achieves aes-
thetic quality assessment of facial images. 15 fea-
tures are measured on the entire image and 3 regions:
face, eyes and mouth. Eyes and mouth have already
been considered for facial expression evaluation (Li
et al., 2010) and information related to these regions
is included in models that extract low-level features in
the entire image (Marchesotti and Perronnin, 2012).
However, computing global statistics such as contrast,
colorfulness or sharpness has not been done yet in
these particular areas. This article demonstrates that
adding relevant information related to these restricted
regions (eyes, mouth) produces equal or better perfor-
mance than any other recent work in this domain. The
feature set is optimized by the Relief metric (Robnik-
ˇ
Sikonja and Kononenko, 2003) and results are com-
pared with 4 recent works focusing on frontal facial
pictures (Lienhard et al., 2014), portraits (Poga
ˇ
cnik
et al., 2012; Khan and Vogel, 2012) or pictures repre-
senting several persons (Li et al., 2010).
This paper is organized as follows. The overall
method is described in Section 2, including image
segmentation, feature computation and the learning
algorithm. Further analysis of relevant features and
regions is given in Section 3. Experiments and results
are reported in Section 4 and an application to picture
selection is given in 5. Conclusion and future work
are reported in Section 6.
2 PROPOSED METHOD
This work focuses on automated aesthetic assessment
of headshots, which are portraits cropped to the ex-
tremes of the target’s head and shoulders (see Figure
1). This section describes the datasets considered in
this work as well as the three steps of the rating al-
gorithm: face and facial attributes detection, feature
extraction, automated aesthetic prediction.
2.1 Datasets
Experiments are made on 3 different datasets.
HFS, for Human Face Scores, is described in (Lien-
hard et al., 2014) and contains 250 headshots that
have been gathered from several existing datasets and
private collections. More precisely, it contains a set of
7 different images of 20 persons, and 110 additional
images of different persons. Examples of images for
3 particular persons are given in Figure 1. Each im-
age has been rated by 25 persons on a 1 to 6 scale
(6 means the highest quality). The ground truth is
considered to be the average score for each picture.
This dataset is used to validate the proposed method
in Section 4.1, and to evaluate the method for picture
selection of a given person in Section 5.
Figure 1: A set of 7 pictures of 3 different persons from the
HFS dataset.
FAVA, for Face Aesthetic Visual Analysis, is a subset
of the AVA database (Murray et al., 2012) containing
various images from which headshots are automati-
cally extracted. More precisely, each picture is scored
from 1 to 10 by internet users (10 means the high-
est quality). This dataset is similar to the one used
in (Poga
ˇ
cnik et al., 2012) and will be used for com-
parison. As described in (Poga
ˇ
cnik et al., 2012), im-
ages with average scores (between 4.5 and 6.5) are
removed. Since our work is based on colored images,
black and white pictures are also removed, and the
final dataset contains 300 pictures.
Flicker is a website hosting a lot of pictures and por-
traits. (Li et al., 2010) created a dataset of 500 images
gathered on this website and scored by the Amazon
Mechanical Turk system. Each image is associated to
a ground truth score between 0 and 10 (10 means high
quality). Photos are either portraits or group portraits.
In this work, only the biggest face detected is consid-
ered in each picture, while (Li et al., 2010) consider
all the faces as well as the relationship between them
(distances, face pose and expressions).
VISAPP2015-InternationalConferenceonComputerVisionTheoryandApplications
546
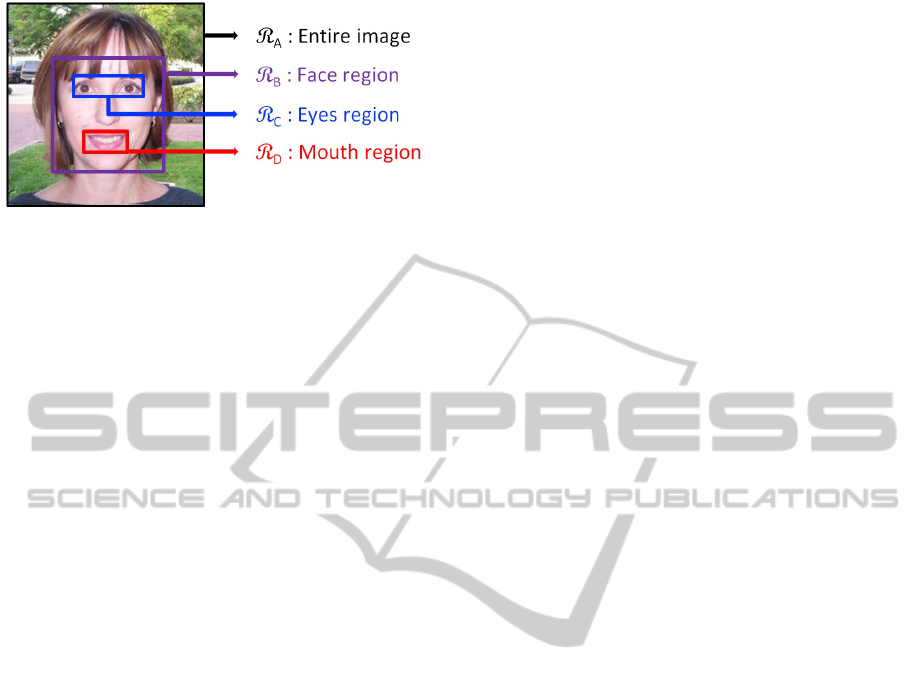
Figure 2: Example of an image and its 4 regions.
2.2 Facial Attributes Segmentation
To locate the face area, bounding box detection is
performed by using Viola-Jones algorithm (Viola and
Jones, 2001) and the OpenCV library. Inside the face
region, observers are more likely to focus on eyes and
mouth, which provide information about the subject:
facial expressions, presence of make up, etc. The pro-
posed method relies on the fact that decisive infor-
mation about face image quality can be obtained by
computing features on eyes and mouth areas only.
In this work, each image is decomposed into the 4
regions described in Figure 2: entire image R
A
, face
area R
B
, eyes area R
C
and mouth area R
D
. Both eyes
are considered to be part of the same region. Eyes
and mouth areas are also detected by Viola-Jones al-
gorithm.
2.3 Features Extraction
State of the art methods implement a lot of features
(76 in (Faria et al., 2013)) in order to assess aesthetic
quality of facial images. In this work, only 15 low-
level features are considered. They consist in image
statistics that can be computed in each region. Thus,
each image is described by a set of 60 values (15 fea-
tures in each of the 4 regions). Features correspond
to sharpness, illumination, contrast and color distri-
bution measures. These categories have been chosen
in this work because they can be computed at the pixel
level and are close to human perception. The feature
list is given below.
Sharpness is evaluated by 3 different values: F
1
,
F
2
, F
3
. The first sharpness measure F
1
is com-
puted by using the blur estimation method described
in (Crete et al., 2007), which compares the difference
between an original image I and its low-pass filtered
version I
b
. More precisely, gradients are measured in
I and in I
b
: the greater the gradient differences be-
tween both images, the sharper the original image I.
Indeed, high differences mean that the original im-
age has sharp edges, and loses a lot of its sharpness
through the filtering process. On the contrary, blurry
images do not change a lot after filtering. This method
appeared to be very discriminant in our previous work
(Lienhard et al., 2014).
Since a sharp facial picture contains high gradi-
ents located in the face region, the average gradient
value F
2
is computed in each region. The size of the
bounding box containing 90% of the image gradients
F
3
is calculated as described in (Ke et al., 2006).
Illumination is characterized by 2 values, F
4
and
F
5
, evaluated by the means of two channels: Value
V and Luminance L
∗
(respectively from HSV and
L
∗
a
∗
b
∗
color spaces). Both measures are considered
in several articles (Ke et al., 2006; Datta et al., 2006;
Poga
ˇ
cnik et al., 2012). They provide information
about the image global brightness if computed on the
entire image, or local brightness if computed on facial
regions. Combination of local and global measures
also give some indications about the brightness dif-
ference between face and non face regions, which in-
fluences our perception of aesthetics (Wong and Low,
2009; Khan and Vogel, 2012). Even if these values are
highly correlated, both are implemented and the less
discriminant measure will automatically be removed
by the feature selection process.
Contrast is measured by 4 values, from F
6
to F
9
.
Two of them correspond to the standard deviation of
V and L
∗
(respectively F
6
and F
7
). Then, the width of
the middle 90% mass of L
∗
histogram F
8
(Ke et al.,
2006; Wong and Low, 2009) and the Michelson con-
trast value F
9
(Desnoyer and Wettergreen, 2010) are
computed. Michelson contrast is obtained by the ra-
tio (L
∗
max
− L
∗
min
)/(L
∗
min
+ L
∗
max
) where L
∗
max
and L
∗
min
are the highest and lowest L
∗
values in the considered
region.
Color information is extracted with the measure-
ment of 6 values, from F
10
to F
15
. The Dark Chan-
nel (DC), introduced to perform haze removal (He
et al., 2010), provides information about sharpness
and colors. High values are related with dull col-
ors or blurry areas. DC corresponds to a mini-
mal filter applied on the RGB color space. Each
pixel p(i, j) of an image I is computed as follows:
p(i, j) = min
c∈R,G,B
(min
(i
0
, j
0
)∈Ω(i, j)
I
c
(i
0
, j
0
)) where I
c
is a channel of I and Ω(i, j) corresponds to the 5 × 5
neighborhood of p(i, j). It has been shown that DC
evaluation helps to increase performance of image
aesthetic assessment (Tang et al., 2013). Since faces
are composed of area with low DC values (skin for ex-
ample) and high DC values (eyes), the DC mean and
its standard deviation are considered (respectively F
10
and F
11
).
Hue H and Saturation S standard deviations (from
HSV color space) are also computed (F
12
to F
13
). The
number of different hues F
14
in each area is an indica-
LowLevelFeaturesforQualityAssessmentofFacialImages
547

tor of its complexity (Ke et al., 2006; Li et al., 2010).
Finally, the colorfulness measure F
15
described in
(Hasler and Suesstrunk, 2003) is implemented, pro-
viding information about the mean and standard devi-
ation of the channels a
∗
and b
∗
of L
∗
a
∗
b
∗
color space.
In recent work (Aydin et al., 2014), it is shown that
F
15
is highly correlated to the human perception of
colorfulness and that this measure is an indicator of
the overall image aesthetic quality.
2.4 Aesthetic Prediction
The learning task is performed by a Support Vector
Machine (SVM) for both categorization (separation
between low and high aesthetic quality images) and
regression (aesthetic quality rating). SVM provided
the best results in preliminary experiments. Other
methods like Random Forest or Neural Networks ob-
tained good results, but slightly below SVM. OpenCV
SVM implementation (Chang and Lin, 2011) is used
with its default parameters and a Gaussian kernel. For
each experiment, a 10-fold cross validation is per-
formed. This task is repeated 10 times to avoid sam-
pling bias, and only average results are reported.
2-class categorization performance is measured
by the Good Classification Rate GCR = N
c
/N
t
. It is
the ratio between the number of images correctly clas-
sified N
c
and the number of test images N
t
. Regres-
sion performance is computed by Pearson’s correla-
tion R. Let ˆs
n
be the ground truth and s
n
the predicted
score of picture n. R is calculated by the formula:
R =
N
t
∑
n=1
( ˆs
n
−
¯
ˆs) · (s
n
− ¯s)
s
N
t
∑
n=1
( ˆs
n
−
¯
ˆs)
2
·
s
N
t
∑
n=1
(s
n
− ¯s)
2
(1)
where
¯
ˆs =
1
N
t
N
t
∑
n=1
ˆs
n
and ¯s =
1
N
t
N
t
∑
n=1
s
n
.
3 ANALYSIS OF RELEVANT
FEATURES AND REGIONS
15 features and 4 regions (R
A
, R
B
, R
C
, R
D
) are a pri-
ori considered. Finding the most discriminant couples
(Feature, Region) in the case of aesthetic quality esti-
mation presents multiple advantages. First, it helps to
design more efficient metrics, adapted to the consid-
ered problem. It also enables to compute fewer fea-
tures, reducing the implementation and computational
cost, and finally improving the overall accuracy of the
prediction.
3.1 Feature and Region Selection
Some of the considered features may be more rele-
vant when computed in limited regions only. For in-
stance, facial images often have blurred background
and sharp edges in the face. Measuring each feature
inside all the regions may also add noise in the data
due to redundant or irrelevant values. Thus, selecting
the most discriminant features for a given area can en-
hance the prediction performance.
In this work, the 60 couples (Feature, Region) are
ranked using the Relief metric, implemented as de-
scribed in (Robnik-
ˇ
Sikonja and Kononenko, 2003).
This metric provides feedback about the ability of
each couple to separate images with similar features
but different aesthetic quality scores. The idea is to
repeatedly consider an image i in the training set and
to find its nearest neighbors in the feature space. For
each neighbor k and feature f , a positive weight is
added to the Relief evaluation of f if images i and k
present both close scores and close values of f , and a
negative weight otherwise. Discriminant features end
up with high Relief evaluation.
Analysis of the features and regions retained by
this metric for the HFS dataset is given in Sections
3.2 and 3.3. In these sections, 2-class categorization
is performed by separating the dataset in 2 groups of
85 images with the lowest and the highest scores.
3.2 Influence of Features
The Relief metric is used to rank the features with re-
spect to their ability to separate images with different
scores or aesthetic categories. In order to analyze the
contribution C of feature F
i
without the region influ-
ence, the following formula is applied:
C(F
i
) =
D
∑
j=A
Relie f (F
i
,R
j
) (2)
where Relie f (F
i
,R
j
) is the value obtained from the
Relief algorithm for the couple (F
i
,R
j
).
It can be observed in Table 1 that sharpness met-
rics are the most discriminant features (C(F
1
) = 0.45,
C(F
2
) = 0.29). Using only F
1
on the HFS dataset,
GCR = 71%, which is already significantly above the
chance level (50%), but still below the performance
obtained by using the entire feature set (86.5%). By
adding the average gradient F
2
, the GCR reaches
77.5%.
Dark Channel measures (F
10
, F
11
) are the most
discriminant features in the color category (C(F
10
) =
0.15, C(F
11
) = 0.32), and combined to the sharp-
ness measurements, a GCR of 82% is obtained, which
is close to the optimal performance obtained in this
VISAPP2015-InternationalConferenceonComputerVisionTheoryandApplications
548

work. By adding the best measures from the illumi-
nation and contrast categories (respectively the mean
of the Value channel F
4
and Michelson contrast F
9
),
GCR = 85.5%. This shows that for this example (HFS
and 2-class categorization), 6 measures are enough to
produce results just below optimal performance. Note
that these features (F
1
, F
2
, F
4
, F
9
, F
10
, F
11
) produce
the same performance for regression than the entire
feature set (R = 0.71).
Table 1: Each row, one or two features are added to the
model. Classification and Regression Performance (respec-
tively CP and RP) are presented, as well as the Relief
weights for each feature (C(F )).
Addition of. . . CP (%) RP (R) C(F )
F
1
71.0 0.50 0.45
F
2
77.5 0.55 0.29
F
10
, F
11
82.0 0.64 0.15, 0.32
F
4
, F
9
85.5 0.71 0.16, 0.20
F
1
to F
15
86.5 0.71 2.64
3.3 Influence of Image Regions
In this section the entire feature set is computed for
each considered region. Table 2 presents the results
for both 2-class categorization (85 images in each
category) and regression (250 images) for the HFS
dataset. It can be seen that computing features in the
very small area corresponding to the eyes is sufficient
to reproduce the results described in (Lienhard et al.,
2014). Plus, it is better to compute the 15 proposed
features in the eyes region than in the entire image for
both classification and regression, which is an inter-
esting result since computing features in small regions
is much faster and thus can lead to real-time applica-
tions. This can be explained by the fact that if the
entire image is of low aesthetic quality, eyes are prob-
ably of low quality as well. And if the eyes region
is sharp, contrasted and well illuminated, it is almost
sufficient for evaluating a portrait as aesthetic.
Table 2: Influence of each image region, as well as the per-
formance obtained by considering the entire set of regions.
Region Class. Perf. (%) Reg. Perf. (R)
R
A
(Image) 77.9 0.54
R
B
(Face) 82.5 0.60
R
C
(Eyes) 83.9 0.64
R
D
(Mouth) 82.4 0.61
R
A
,R
B
,R
C
,R
D
86.5 0.71
Finally, couples with the highest Relief values
are (F
{1,2}
,R
{B,C,D}
): sharpness measures in the fa-
cial areas are the most discriminant values for aes-
thetic quality assessment. The remaining problem is
to choose the number of couples to keep in the final
model. This can be solved by performing preliminary
experiments, where the number of features is incre-
mented until the optimal performance is reached. Re-
sults obtained by the optimal number of couples for
the 3 datasets are reported in Section 4.
4 EXPERIMENTS AND RESULTS
4.1 Validation of the Method
The performance evaluation of the proposed method
is done on HFS dataset. Two equally distributed
groups of pictures are created, containing respectively
images with the lowest and the highest scores. Each
group contains 125 images, the half of the dataset.
2-class categorization is performed and the average
True Positive Rate (TPR) and False Positive Rate
(FPR) are shown in the Receiver Operating Charac-
teristic (ROC) curves presented in Figure 3. High TPR
means that most of good looking images are retrieved
while FPR represents the rate of poor looking images
predicted as good looking images.
Performance is measured by the Area Under the
Curve (AUC). Figure 3 shows that the proposed
features and regions are relevant since performance
is significantly better than the results obtained us-
ing only foreground/background segmentation (Usual
Method), with AUC = 0.87 instead of 0.83. Using the
combination of the best couples (R ,F ) obtained by
the Relief ranking, it is possible to increase the perfor-
mance and obtain an AUC of 0.90. Performance in the
low recall area (FPR < 0.1) is promising, since it is
possible to retrieve about 70% of the good looking im-
ages while making only 10% of false detections. This
last result can be used in real life applications: some
good looking images are selected in a large database,
among which the user can manually choose the best
one.
By removing average images, which are difficult
to categorize as aesthetic or poor looking images, it
is possible to enhance the performance. This means
that erroneous classifications are mostly due to aver-
age images, which are neither good nor bad images.
Figure 3 shows that by removing 30% of average im-
ages, the AUC is 0.93.
4.2 Comparison with Previous Works
To compare the proposed method with previous work,
the experiments of (Li et al., 2010; Poga
ˇ
cnik et al.,
2012; Khan and Vogel, 2012; Lienhard et al., 2014)
are reproduced, using the same learning algorithms
LowLevelFeaturesforQualityAssessmentofFacialImages
549
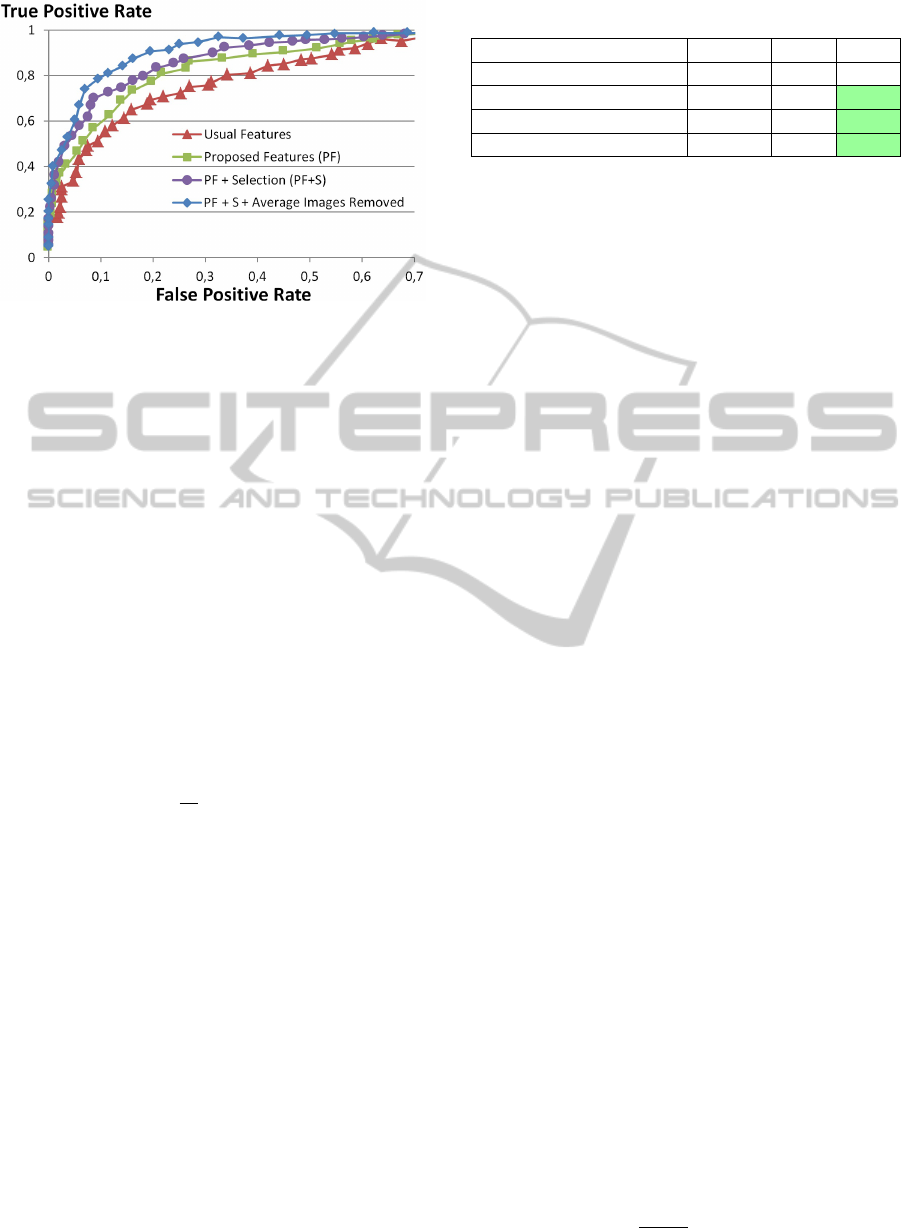
Figure 3: Proposed method achieves the best performance.
AUC can be increased by using feature selection or remov-
ing average pictures.
and databases with the proposed feature set. These
works use images containing both group pictures and
portraits (Li et al., 2010), only portraits (Poga
ˇ
cnik
et al., 2012; Khan and Vogel, 2012) or face portraits
(Lienhard et al., 2014). The method is first com-
pared with previous works performing image catego-
rization, then with works performing score prediction.
4.3 Comparison with Previous
Categorization Models
(Li et al., 2010) consider 500 images from the Flickr
dataset, which are separated in 5 classes with respect
to their ground truth aesthetic score. They perform 5-
class categorization and measure the Cross-Category
Error, which is a function of the error magnitude k:
CCE(k) =
1
N
t
N
t
∑
i=1
I ( ˆc
i
− c
i
= k) (3)
where N
t
is the number of test images, ˆc
i
the ground
truth classification and c
i
the predicted classification
for the i
th
image. I represents the indicator function:
it takes the value 1 if ˆc
i
− c
i
= k, and 0 if ˆc
i
− c
i
6= k.
They obtain 68% accuracy within one cross-category
error: (CCE(−1) + CCE(0) + CCE(1))/N
t
= 0.68.
On the same dataset, using the same learning algo-
rithm (a Gaussian-kernel SVM), the proposed method
achieves the same performance. It has to be noticed
that in this evaluation, only the biggest face is consid-
ered because the proposed method is adapted to head-
shots, not for group pictures. Several attributes related
to faces relationship in the group photo are not mea-
sured: (Li et al., 2010) show that high-level attributes
such as smiles or image composition (faces size and
positions) play an important role in the global aes-
thetic evaluation and including these attributes in the
proposed model may enhance the performance.
Table 3: Classification performance of Previous Work (PW)
is compared with the Proposed Method (PM).
Dataset PW PM
(Li et al., 2010) Flickr 68% 68%
(Khan and Vogel, 2012) Flickr 64% 70%
(Poga
ˇ
cnik et al., 2012) FAVA 75% 81%
(Lienhard et al., 2014) HFS 84% 87%
Comparison with (Khan and Vogel, 2012) is possi-
ble using Li’s dataset and focusing on the 140 images
that are portraits of a single person. 3 out of their 7
features are similar to the proposed features (face illu-
mination, contrast, brightness). They also include fea-
tures relative to image composition (rule of third, face
position and size). Their best result for 2-class catego-
rization corresponds to an accuracy of 63.5%, using
SVM classification and 10-fold cross validation. We
obtain better performance with the proposed feature
set: 69% without selection, 70% with the best feature
selection.
The work presented in (Poga
ˇ
cnik et al., 2012) is
compared using the FAVA dataset, which is very sim-
ilar to the dataset used in their work: both are por-
traits extracted automatically from the AVA dataset
(Murray et al., 2012). Their 2-class categorization ac-
curacy is 73.2%, using 71 various features: subject
position and size, compositional rules, distribution of
edges, color distribution, etc. Gaussian-kernel SVM
is used to perform 10-fold cross validation. Using
the Relief metric to enhance their results, they obtain
(74.8%). The proposed system obtains 81% of correct
classification (76.2% without feature selection).
Finally, the feature set and segmentation algo-
rithm presented in (Lienhard et al., 2014) is tested
and compared with the proposed method. In previous
work, only 83.7% of good classification in the case
of 2-class categorization has been obtained, while the
proposed feature set produces an average of 86.5%.
Results developed in this section are summarized in
Table 3 and show a significant increase of the classi-
fication performance.
4.4 Comparison with Previous
Regression Models
Among the 4 works previously cited, only (Li et al.,
2010) and (Lienhard et al., 2014) performed aes-
thetic score prediction. (Li et al., 2010) calculated the
residual sum-of-squares error RSE to measure perfor-
mance:
RSE =
1
N
t
− 1
N
t
∑
i=1
(
ˆ
S
i
− S
i
)
2
(4)
VISAPP2015-InternationalConferenceonComputerVisionTheoryandApplications
550
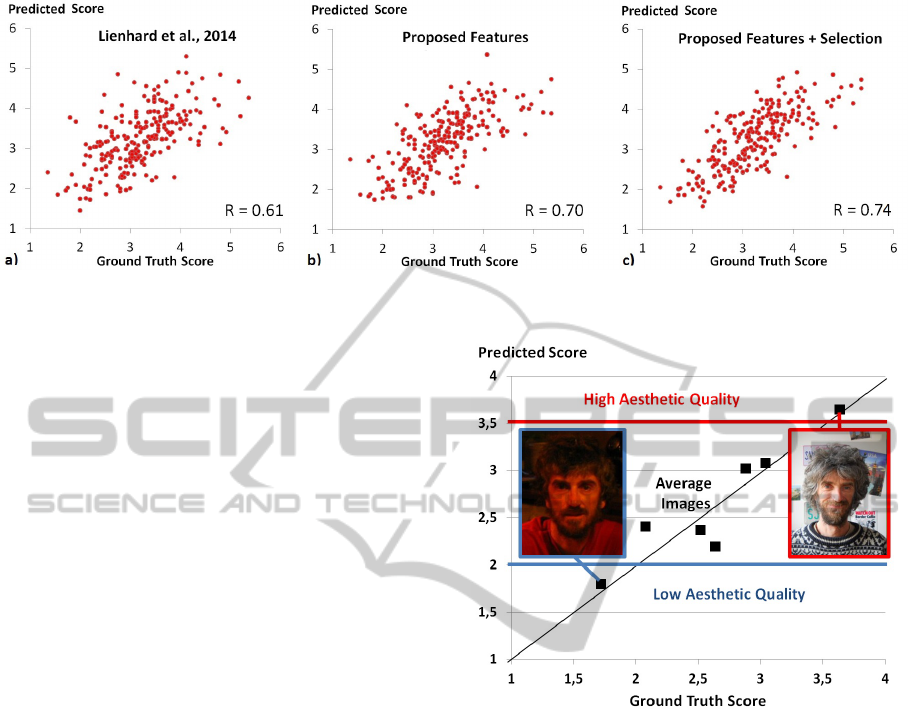
Figure 4: Comparison of the regression prediction obtained by a) (Lienhard et al., 2014), b) the proposed feature set and c)
the reduced set obtained by feature selection.
where S
i
is the ground truth score and
ˆ
S
i
the predicted
score. They perform SVM regression to make score
prediction. Using the same dataset, their features lead
to RSE = 2.38 while the proposed method leads to
RSE = 2.15, which is slightly better.
In (Lienhard et al., 2014), performance is com-
puted by Pearson’s correlation R. Using the proposed
method without feature selection, the correlation in-
creases significantly from R = 0.61 to 0.71. Fea-
ture selection increases the performance to R = 0.74,
which is significantly higher than the results obtained
in our previous work. Figure 4 presents the point
clouds obtained after regression for (Lienhard et al.,
2014), the proposed feature set and the reduced set
obtained by feature ranking. A perfect prediction cor-
responds to a straight line (R = 1), and the proposed
method reaches R = 0.74 which is significantly better
than our previous work (R = 0.61).
5 APPLICATION TO PICTURE
SELECTION
Automated picture selection of a given person is a
practical example that may benefit from the proposed
method and its results. People may have hundreds of
pictures from which they want to select a small set
that is relevant for a given application: facebook pro-
file picture, professional purposes like resumes, etc.
There are many attributes that are very discriminant
in the case of picture selection: is the person smiling
? Are the eyes open ? These attributes are partially en-
coded in our features (opened eyes mean more colors
and higher contrast in the eye region). However sub-
jective judgments like emotions are not considered.
In most of picture selection problems, users are
likely to manually choose appealing images. By au-
tomatically selecting a small subset of images that are
already defined as appealing, it is possible to signifi-
Figure 5: 7 images of the same person represented by their
ground truth scores and automated aesthetic prediction.
cantly reduce the time spent on selection. The follow-
ing experiment is made. First, the learning algorithm
is applied on the entire HFS dataset except for one
particular person (243 images are used for learning).
Then, prediction is made on the 7 images correspond-
ing to the selected person. Figure 5 presents an ex-
ample of image selection using the proposed method.
Using appropriate thresholds, it is possible to retain
automatically appealing images (pictures above the
blue line) or remove unsatisfying images (pictures be-
low the red line).
6 CONCLUSION
In this paper, a framework to assess the aesthetic qual-
ity of frontal facial portraits has been proposed. Fea-
tures are extracted in different face regions (entire
face, eyes, mouth) that contain the most relevant in-
formation about the portrait. Few pixel-level statistics
LowLevelFeaturesforQualityAssessmentofFacialImages
551

are computed in each region and a substantial model
of portrait aesthetic estimation is proposed. Com-
parison between different methods of aesthetic scores
and categories prediction has been made, and per-
formance of 4 recent works is significantly outper-
formed. The proposed feature selection process en-
hanced the overall prediction accuracy and the most
discriminant features and regions have been summa-
rized. Improvements are still to be done to deal effi-
ciently with rotated or occluded faces, and the frame-
work can be generalized to other kind of images by
replacing the face detection process by any adapted
segmentation algorithm.
In the future, results may be enhanced by the ad-
dition of high-level features. More precisely, it would
be interesting to consider attributes such as gender,
age, facial expression, eyes and mouth closeness, etc.
These attributes are closer to human perception of fa-
cial aesthetics than low-level statistics and can help to
perform more specific evaluation, to match with con-
sumer applications and to handle faces with glasses,
hats, make-up or facial hair.
REFERENCES
Aydin, T., Smolic, A., and Gross, M. (2014). Automated
Aesthetic Analysis of Photographic Images. IEEE
Transactions on Visualization and Computer Graph-
ics.
Chang, C. and Lin, C. (2011). LIBSVM: a library for sup-
port vector machines. ACM Transactions on Intelli-
gent Systems and Technologies, pages 1–39.
Crete, F., Dolmiere, T., Ladret, P., and Nicolas, M. (2007).
The blur effect: perception and estimation with a new
no-reference perceptual blur metric. In SPIE Elec-
tronic Image Symposium.
Datta, R., Joshi, D., Li, J., and Wang, J. (2006). Studying
aesthetics in photographic images using a computa-
tional approach. Computer VisionECCV 2006.
Desnoyer, M. and Wettergreen, D. (2010). Aesthetic Im-
age Classification for Autonomous Agents. 20th In-
ternational Conference on Pattern Recognition, pages
3452–3455.
Dhar, S., Ordonez, V., and Berg, T. (2011). High level de-
scribable attributes for predicting aesthetics and inter-
estingness. Computer Vision and Pattern Recognition,
pages 1657–1664.
Faria, J., Bagley, S., R
¨
uger, S., and Breckon, T. (2013).
Challenges of finding aesthetically pleasing images.
In Image Analysis for Multimedia Interactive Services
(WIAMIS), volume 2, pages 4–7.
Hasler, D. and Suesstrunk, S. (2003). Measuring colorful-
ness in natural images. Electronic Imaging. Interna-
tional Society for Optics and Photonics., pages 87–95.
He, K., Sun, J., and Tang, X. (2010). Single Image Haze Re-
moval Using Dark Channel Prior. IEEE transactions
on pattern analysis and machine intelligence.
Jiang, W., Loui, A. C., and Cerosaletti, C. D. (2010). Auto-
matic aesthetic value assessment in photographic im-
ages. IEEE International Conference on Multimedia
and Expo, pages 920–925.
Ke, Y., Tang, X., and Jing, F. (2006). The design of high-
level features for photo quality assessment. In Com-
puter Vision and Pattern Recognition, volume 1, pages
419–426.
Khan, S. and Vogel, D. (2012). Evaluating visual aesthetics
in photographic portraiture. Computational Aesthetics
in Graphics, Visualization and Imaging, pages 1–8.
Li, C., Loui, A., and Chen, T. (2010). Towards aesthetics:
a photo quality assessment and photo selection sys-
tem. In Proceedings of the international conference
on Multimedia, pages 10–13.
Lienhard, A., Reinhard, M., Caplier, A., and Ladret, P.
(2014). Photo Rating of Facial Pictures based on Im-
age Segmentation. In Proceedings of the 9th Int. Conf.
on computer Vision Theory and Applications, pages
329–336, Lisbonne, Portugal.
Luo, Y. and Tang, X. (2008). Photo and video quality
evaluation: Focusing on the subject. Computer Vi-
sionECCV 2008, pages 386–399.
Males, M., Hedi, A., and Grgic, M. (2013). Aesthetic qual-
ity assessment of headshots. In 55th International
Symposium ELMAR, number September, pages 25–
27.
Marchesotti, L. and Perronnin, F. (2012).
´
Evaluation au-
tomatique de la qualit
´
e esth
´
etique des photographies
`
a l’aide de descripteurs d’images g
´
en
´
eriques. In Re-
connaissance des Formes et Intelligence Artificielle
(RFIA).
Murray, N., Marchesotti, L., and Perronnin, F. (2012).
AVA: A large-scale database for aesthetic visual anal-
ysis. Computer Vision and Pattern Recognition, pages
2408–2415.
Poga
ˇ
cnik, D., Ravnik, R., Bovcon, N., and Solina, F.
(2012). Evaluating photo aesthetics using machine
learning. In Data Mining and Data Warehouses, pages
4–7.
Robnik-
ˇ
Sikonja, M. and Kononenko, I. (2003). Theoretical
and empirical analysis of ReliefF and RReliefF. Ma-
chine learning, 53:23–69.
Tang, X., Luo, W., and Wang, X. (2013). Content-Based
Photo Quality Assessment. IEEE Transactions on
Multimedia, 15(8):1930–1943.
Tong, Y., Konik, H., Cheikh, F. A., and Tremeau, A.
(2010). Full reference image quality assessment based
on saliency map analysis. Journal of Imaging Science
and Technology, 54(3):1–21.
Viola, P. and Jones, M. (2001). Rapid object detection
using a boosted cascade of simple features. In Pro-
ceedings of the IEEE Computer Society Conference on
Computer Vision and Pattern Recognition., volume 1,
pages I–511–I–518. IEEE Comput. Soc.
Willis, J. and Todorov, A. (2006). Making Up Your Mind
After a 100-Ms Exposure to a Face. Psychological
science, 17(7):592–598.
Wong, L.-k. and Low, K.-l. (2009). Saliency-enhanced im-
age aesthetics class prediction. In 16th IEEE Interna-
tional Conference on Image Processing, pages 997–
1000. Ieee.
VISAPP2015-InternationalConferenceonComputerVisionTheoryandApplications
552
