
MTTV
An Interactive Trajectory Visualization and Analysis Tool
Fabio Poiesi and Andrea Cavallaro
Centre for Intelligent Sensing, Queen Mary University of London, London, U.K.
Keywords:
Visualization, Trajectory Analysis, Multi-target Tracking.
Abstract:
We present an interactive visualizer that enables the exploration, measurement, analysis and manipulation of
trajectories. Trajectories can be generated either automatically by multi-target tracking algorithms or manually
by human annotators. The visualizer helps understanding the behavior of targets, correcting tracking results
and quantifying the performance of tracking algorithms. The input video can be overlaid to compare ideal and
estimated target locations. The code of the visualizer (C++ with openFrameworks) is open source.
1 INTRODUCTION
Visualization aims at presenting complex data in a
comprehensible form and helps users to improve their
understanding, refine theories and reveal failures. A
plethora of research projects investigate behaviors of
moving and potentially interacting objects such as
cells (Li et al., 2008), particles (Park et al., 2014),
insects (Fasciano et al., 2014) or people (Shitrit et al.,
2014) based on video recordings. Recent advances
in computer vision have led to the automatic gener-
ation of metadata (trajectories) that describe motion
patterns (Poiesi and Cavallaro, 2014). The observa-
tion of trajectory patterns can benefit behavioral stud-
ies (Wong, 2012) of animals (Veeraraghavan et al.,
2008; Kimura et al., 2014) and humans (Helbing
et al., 2000), and can also be useful to localize errors
generated by object trackers.
To understand target interactions (Khan et al.,
2005), a user has to observe concurrent trajectories
and spatio-temporal relationships between points of
interest. Moreover, researchers need to analyze the
performance of multi-target tracking algorithms by
visualizing and understanding errors in the estimated
trajectories. Errors include identity switches (Yin
et al., 2007), track fragmentation (Li et al., 2009) or
drifts (Ross et al., 2008). Evaluation algorithms as-
sess tracking performance offline (Yin et al., 2007;
Li et al., 2009) or online (SanMiguel et al., 2012).
Tracking assessment is often limited to the numerical
analysis of evaluation scores, such as number of iden-
tity switches, number of fragmented tracks or percent-
age of mostly tracked objects (Wu and Nevatia, 2006;
Zhang et al., 2015). A visual feedback of this infor-
mation would support the identification of the causes
of errors and complement the information provided
by the evaluation scores.
While considerable progress has been made in
3D-particle representations to improve the character-
ization of high-density biological structures (Beheiry
and Dahan, 2013), traffic analysis and maritime navi-
gation (Tominski et al., 2012), as well as the 3D visu-
alization of aircraft trajectories (Hurter et al., 2009),
appropriate visualizers for the analysis of multi-target
video tracking results are still missing (Hoferlin et al.,
2009; Whitehorn et al., 2013). We are interested in
visualizing trajectories as 2D target locations (on the
image plane) tracked over time. A visualization tool
should ease the comparison between trajectories and
video in order to allow a user to analyze and compare
tracking results.
We present a multi-target trajectory visualization
software (MTTV), which enables users to explore, an-
alyze and manipulate object tracks. Figure 1 shows
the overall flow diagram of the visualization mod-
ule. The user can select a point in time to overlay
the corresponding video frame onto the correspond-
ing trajectories and then move frames forward and
backward to analyze the results (Figure 2). A user
can visualize (or discard) individual trajectories or
choose a transparency level for simultaneously visu-
alizing (or hiding) multiple targets. This feature is
particularly useful during occlusions due to overlap-
ping trajectories (Joshi and Rheingans, 2005). MTTV
allows the visualization of tracking errors (e.g. frag-
mented or inaccurate trajectories) as markers with ar-
157
Poiesi F. and Cavallaro A..
MTTV - An Interactive Trajectory Visualization and Analysis Tool.
DOI: 10.5220/0005311001570162
In Proceedings of the 6th International Conference on Information Visualization Theory and Applications (IVAPP-2015), pages 157-162
ISBN: 978-989-758-088-8
Copyright
c
2015 SCITEPRESS (Science and Technology Publications, Lda.)
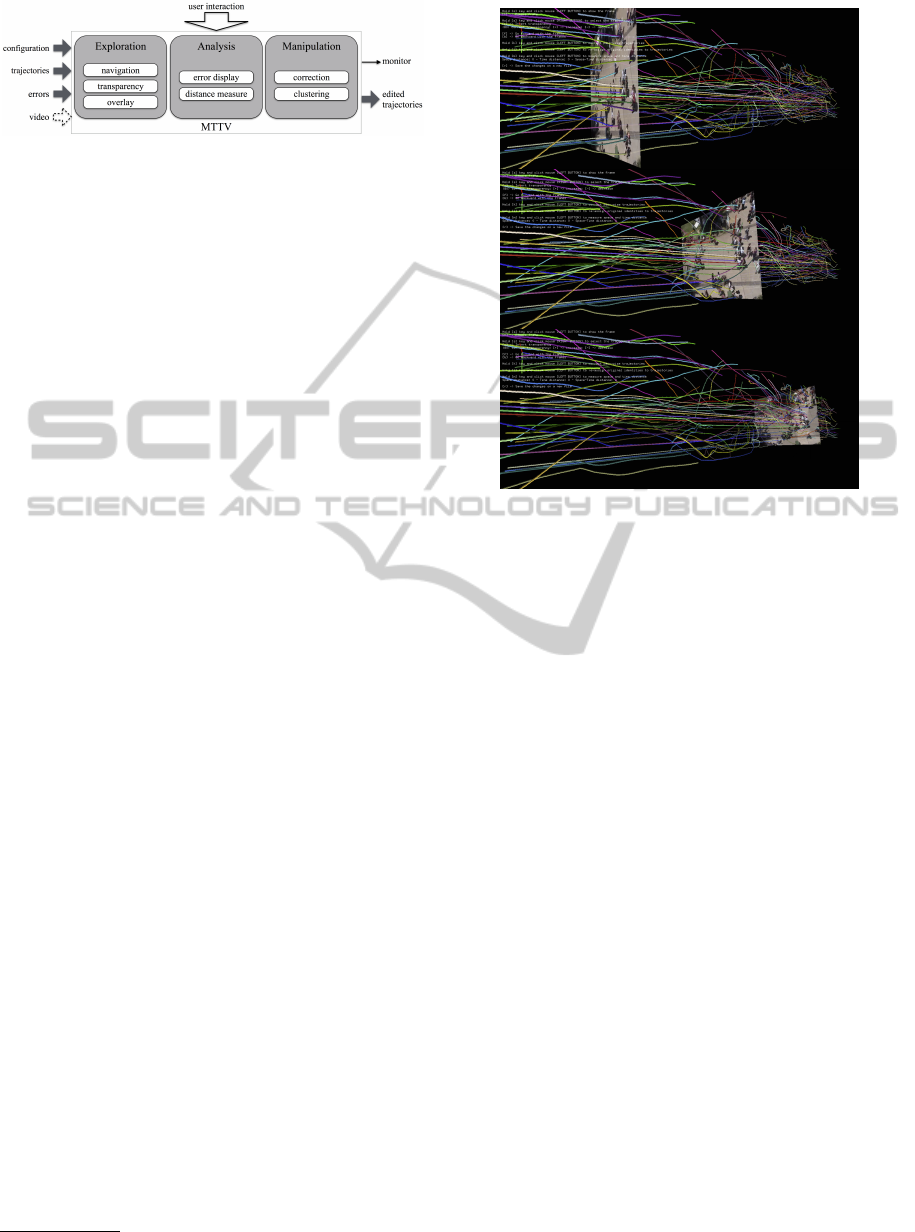
Figure 1: Flow diagram of the multi-target trajectory visual-
ization software (MTTV). Each operation includes different
functionalities, for example, trajectories can be analyzed by
displaying and correcting errors, and measuring distances
among trajectory points. Three files (i.e. configuration, tra-
jectories and errors) plus a video sequence are given as in-
put. MTTV allows correction of errors and the resulting tra-
jectories with new identities can be saved in a file of edited
trajectories.
bitrary shape and color. Importantly, the user can
manually correct these errors. The corrected trajec-
tory data can then be saved for later visualization and
analysis. MTTV is developed in C++ using open-
Frameworks
1
that eases the interoperability between
openGL and openCV. The source code is available at
http://www.eecs.qmul.ac.uk/%7Eandrea/mttv.html.
The Graphical User Interface (GUI) of MTTV
consists of a window containing the 3D trajectory
points (Figure 3a). Each trajectory is represented with
a unique color. On the top-left corner of the window
there is the list of commands (key-buttons) for en-
abling/disabling graphical features. In order to have
a visualization of the image location of the trajectory
points, the current, previous and next frame with re-
spect to that overlaid on the trajectories are shown.
The trajectory points at these time instants are over-
laid on the frames. The user can explore the trajec-
tories by translating, rotating and zooming to change
the viewpoint, focus on specific areas of the scene and
observe the trajectory over time. It is also possible to
enable transparency, to overlay video frames, to mea-
sure distances between points and to reassign identi-
ties to trajectories.
2 EXPLORATION
MTTV receives as input a configuration file that con-
tains the list of files to be loaded (i.e. video, trajectory
file, error file), the frame range and analysis modality
(i.e. on/off ). Each row of the trajectory file is com-
posed of four elements: target identity, horizontal and
vertical coordinates, and frame number. The coordi-
nates and frame number are given according to the
video format reference. The error file contains the list
of errors to be plotted as markers. The error file can
1
http://openframeworks.cc/, accessed: Dec 2014.
Figure 2: Visualization of 2D trajectories over time with
overlaid video frames. Frames can be navigated forward
and backward while exploring the 3D space.
be generated by the user using an evaluation software
(Nawaz et al., 2014b). The header of this file specifies
types and labels of error, colors and types of markers.
The list of errors has the same format as the trajectory
file.
Generally, an observer can only focus his/her
attention on five independently moving objects
(Pylyshyn, 2003). For this reason, we embedded in
MTTV the possibility to set transparencies for the tra-
jectories the user does not want to focus on (Figure 4).
This option can be used to present results in reports
where only a subset of trajectories of interest are high-
lighted. In Figure 4b only one trajectory is left with
full color (light-blue), thus highlighting the behavior
of interest.
3 MANIPULATION
Trajectories can be manipulated by assigning their
identities to other trajectories. For example, the iden-
tity of a trajectory can be assigned to a group of trajec-
tories if a user aims to generate clusters of trajectories
with same identity. MTTV can draw (overlay) the er-
ror points that are given as input (Figure 3b - green
cube). A user can correct tracking errors by reassign-
ing the identities to the affected trajectories.
MTTV allows the user to transfer the identity of a
trajectory to another trajectory. If this process is re-
IVAPP2015-InternationalConferenceonInformationVisualizationTheoryandApplications
158
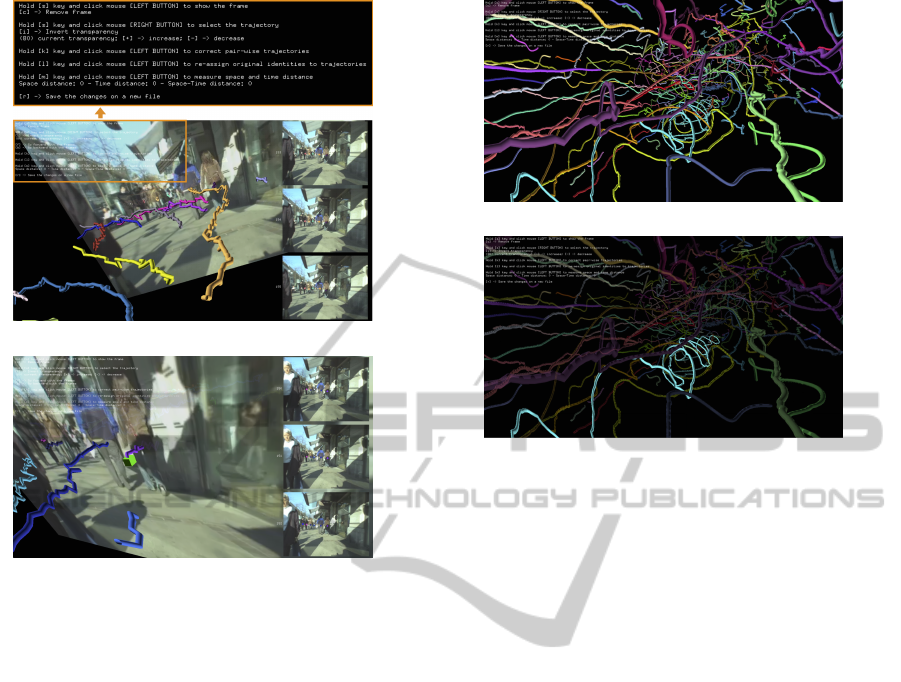
(a)
(b)
Figure 3: Interface of the visualization software. (a) A
user can overlay of a video frame at a certain time instant.
The top-left corner contains the legend of the commands
(a zoom with the commands is shown on top of the inter-
face). The right-hand side shows current, previous and next
frames with respect to that overlaid on the trajectories. (b)
Errors can be visualized by enabling the analysis modality.
peated, it is possible to form a cluster (Figure 5 and
6). This type of annotation can be used, for exam-
ple, to evaluate clustering algorithms (Zhang et al.,
2009). Moreover, Figure 5 shows an example of an-
notation that can be used for the evaluation of meth-
ods aimed at detecting groups of people traveling to-
gether (Sochman and Hogg, 2011; Solera et al., 2013;
Bazzani et al., 2014).
Figure 6a shows an example of a set of trajecto-
ries extracted over time and normalized so that they
all start at the same time instant (t=0). These trajec-
tories were extracted from a traffic dataset and used
to assess the performance of a clustering algorithm
(Nawaz et al., 2014a). Trajectories that were given
the same identity by a team of annotators were consid-
ered belonging to the same cluster. Trajectories that
were not associated to any clusters were considered
outliers during the annotation process. It is possible
to save the results of the manipulated trajectories in a
text file (edited trajectories - Figure 1) with the same
format as the input trajectory file (Sec. 2).
(a)
(b)
Figure 4: Example of high-density trajectories visualized
(a) without and (b) with transparency enabled on a subset
of trajectories. The transparency level can be chosen by the
user and ranges in the interval [0 255]. (b) The light-blue
trajectory is highlighted, whereas the others are set trans-
parent with a transparency value of 80.
4 ANALYSIS
Common errors in multi-target tracking are track
fragmentation and identity switches (Wu and Neva-
tia, 2006; Zhang et al., 2015; Yang and Nevatia,
2014; Milan et al., 2014). A track fragmentation
occurs when a trajectory is interrupted. An identity
switch occurs when an estimated trajectory changes
its matched ground-truth identity. The analysis of
these errors is often carried out by comparing evalua-
tion scores in order to judge the method with best per-
formance (Yang and Nevatia, 2012). However, some-
times errors can be of a different nature and compet-
ing methods can be robust to different tracking chal-
lenges. MTTV visualizes the spatio-temporal occur-
rence of errors in order to help the user to identify and
assess the causes of the errors, and to show whether
the errors of different trackers are of the same type.
MTTV shows the spatio-temporal occurrences of
errors using markers when the analysis modality is en-
abled (Figure 7). The shape and color of markers can
be defined in the header of the input error file. The
user can input a file with a list of error points to be
highlighted on the top of the trajectories in order to
associate the errors and the spatio-temporal informa-
tion of their occurrence. A detailed analysis of the er-
MTTV-AnInteractiveTrajectoryVisualizationandAnalysisTool
159
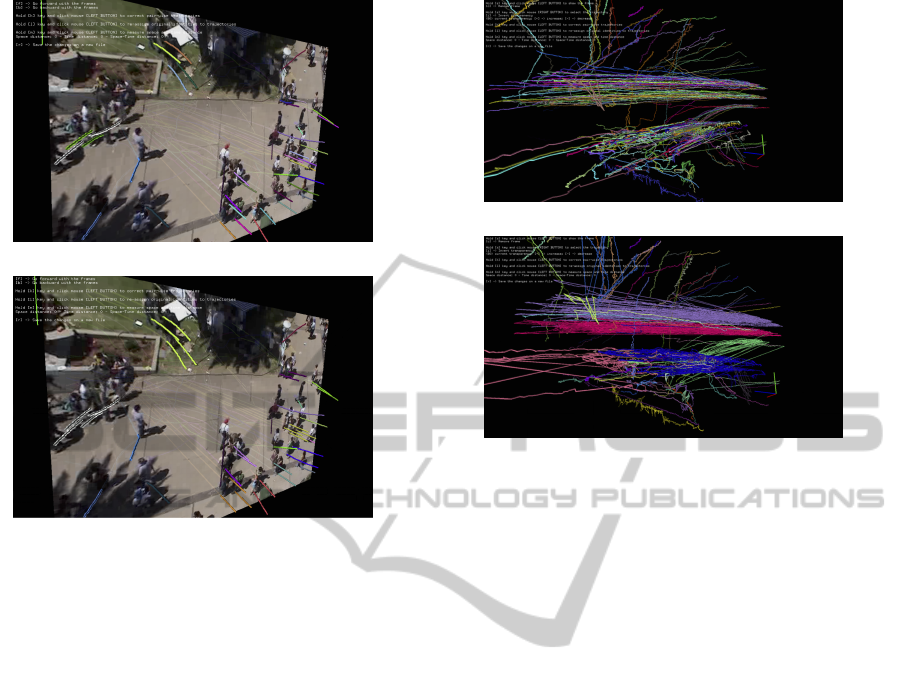
(a)
(b)
Figure 5: Samples representing (a) trajectories with a dif-
ferent identity (color) associated to each person and (b)
clusters of trajectories (with same color) indicating people
within the same group.
rors can be further carried out by overlying the video
frame in the location of the marker and navigating the
video forwards and backwards.
When two events/errors have been localized, it
is possible to measure their spatio-temporal distance.
Separate measures of time (one dimension) and space
(two dimensions) are also provided.
Figure 7 shows an example of tracking result with
the green cubes indicating where the estimated tracks
have undergone an identity change. In Figure 7a there
are three identity changes (green cubes), of which two
are due to track fragmentation (center and bottom of
the figure) and one is due to identity swap (top of the
figure). In Figure 7a the identity change highlighted
with the white ellipse is analyzed by superimposing
the frames. From Figure 7b we can observe that the
target is correctly tracked and after a few frames (Fig-
ure 7c) the tracker loses the target, and a new identity
is assigned.
When a track fragmentation or identity switch is
identified, a user can assign the correct identity to the
affected trajectory (Figure 8).
(a)
(b)
Figure 6: Trajectory clustering (annotation) can be achieved
by propagating the identity of a trajectory to the trajecto-
ries with same motion patterns. (a) Temporally normalized
trajectories that start at same time instant (t = 0) and (b)
clustered trajectories by annotators.
5 CONCLUSIONS
We presented a new visualization software (MTTV)
to measure, understand, analyze and manipulate tra-
jectories. We showed how to navigate the video to
assess the results. MTTV can help, for example, the
study of isolated target behaviors (e.g. insects (Cou-
villon et al., 2012)) and the presentation of tracking
results or trajectory patterns.
Because the openFrameworks toolkit aims at
facilitating interoperability between openGL and
openCV, the development of interactive visualization
features, for example using Kinect will be made easy.
Algorithms for data analysis provided by openCV
(e.g. clustering) can be embedded in MTTV and the
visualization can be used for a rapid feedback on the
results.
One of the limitations of MTTV is the absence
of the velocity direction information as proposed by
(Buschmann et al., 2014). The implementation of this
visualization feature is part of our future work. More-
over, by making the code available open source, we
hope that researchers will benefit from this visualizer
and contribute to its further development.
IVAPP2015-InternationalConferenceonInformationVisualizationTheoryandApplications
160
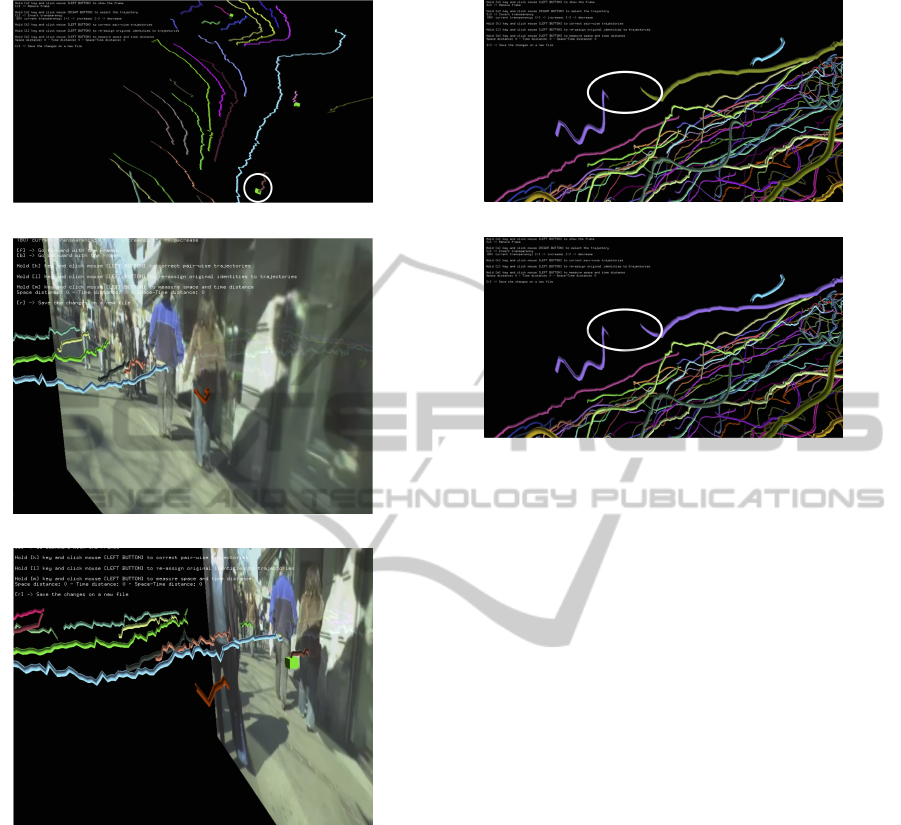
(a)
(b)
(c)
Figure 7: Tracking errors can be plotted in the 3D space
and analyzed by superimposing the video frame. (a) Errors
(e.g. identity changes) are plotted using green cubes. The
white ellipse highlights an example of track fragmentation
that is analyzed by (b) superimposing and (c) navigating
through the video. (b) The target is correctly tracked and (c)
after being lost it is reinitialized with a new identity. This
reinitialization leads to an identity change shown with the
green cube.
ACKNOWLEDGEMENTS
This work was supported in part by the Artemis JU
and the UK Technology Strategy Board through COP-
CAMS Project under Grant 332913.
(a)
(b)
Figure 8: Fragmented trajectories can be corrected by trans-
ferring the identity (same color) of one trajectory to another.
(a) The target estimated with the purple trajectory was lost
and reinitialized with the green trajectory. This is because
the target went outside the scene and when it re-entered the
tracker assigned a new identity to it. (b) The purple iden-
tity is transferred to the trajectory that initially had green
identity.
REFERENCES
Bazzani, L., Zanotto, M., Cristani, M., and Murino, V.
(2014). Joint individual-group modeling for tracking.
IEEE Trans. on Pattern Analysis and Machine Intelli-
gence, DOI: 10.1109/TPAMI.2014.2353641.
Beheiry, M. E. and Dahan, M. (2013). ViSP: representing
single-particle localizations in three dimensions. Na-
ture Methods, 10(8):689–690.
Buschmann, S., Trapp, M., Luhne, P., and Dollner, J.
(2014). Hardware-accelerated attribute mapping for
interactive visualization of complex 3D trajectories. In
Proc. of International Conference on Information Vi-
sualization Theory and Applications, pages 355–363,
Lisbon, Portugal.
Couvillon, M., Phillipps, H., Schurch, R., and Ratnieks, F.
(2012). Working against gravity: horizontal honeybee
waggle runs have greater angular scatter than vertical
waggle runs. Biology Letters, 8(4):1–4.
Fasciano, T., Dornhaus, A., and Shin, M. (2014). Ant track-
ing with occlusion tunnels. In Proc. of Winter Confer-
ence on Applications of Computer Vision, pages 947–
952, Steamboat Springs, CO, USA.
Helbing, D., Farkas, I., and Vicsek, T. (2000). Simu-
lating dynamical features of escape panic. Nature,
407(9):487–490.
Hoferlin, M., Hoferlin, B., and Weiskopf, D. (2009). Video
MTTV-AnInteractiveTrajectoryVisualizationandAnalysisTool
161

visual analytics of tracked moving objects. In Proc.
of Workshop on Behaviour Monitoring and Interpre-
tation, pages 59–64, Ghent, BEL.
Hurter, C., Tissoires, B., and Conversy, S. (2009). From-
DaDy: Spreading aircraft trajectories across views to
support iterative queries. IEEE Trans. on Visualization
and Computer Graphics, 15(6):1017–1024.
Joshi, A. and Rheingans, P. (2005). Illustration-inspired
techniques for visualizing time-varying data. In Proc.
of Visualization, pages 679–686, Minneapolis, MN,
USA.
Khan, Z., Balch, T., and Dellaert, F. (2005). MCMC-based
particle filtering for tracking a variable number of in-
teracting targets. IEEE Trans. on Pattern Analysis and
Machine Intelligence, 27(11):1805–1819.
Kimura, T., Ohashi, M., Crailsheim, K., Schmickl, T.,
Okada, R., Radspieler, G., and Ikeno, H. (2014). De-
velopment of a new method to track multiple honey
bees with complex behaviors on a flat laboratory
arena. Plos One, 9(1):1–12.
Li, K. et al. (2008). Cell population tracking and lineage
construction with spatiotemporal context. Medical
Image Analysis, 12(5):546–566.
Li, Y., Huang, C., and Nevatia, R. (2009). Learning to asso-
ciate: hybridboosted multi-target tracker for crowded
scene. In Proc. of Computer Vision and Pattern
Recognition, pages 2953–2960, Miami, FL, USA.
Milan, A., Gade, R., Dick, A., Moeslund, T., and Reid, I.
(2014). Improving global multi-target tracking with
local updates. In Proc. of European Conference on
Computer Vision Workshops, Zurich, CH.
Nawaz, T., Cavallaro, A., and Rinner, B. (2014a). Trajec-
tory clustering for motion pattern extraction in aerial
videos. In Proc. of International Conference on Image
Processing, Paris, FR.
Nawaz, T., Poiesi, F., and Cavallaro, A. (2014b). Measures
of effective video tracking. Trans. on Image Process-
ing, 23(1):376–388.
Park, C., Woehl, T., Evans, J., and Browning, N. (2014).
Minimum cost multi-way data association for op-
timizing multitarget tracking of interacting objects.
IEEE Trans. on Pattern Analysis and Machine Intel-
ligence, DOI: 10.1109/TPAMI.2014.2346202.
Poiesi, F. and Cavallaro, A. (2014). Tracking multiple
high-density homogeneous targets. IEEE Trans. on
Circuits and Systems for Video Technology, DOI:
10.1109/TCSVT.2014.2344509.
Pylyshyn, Z. (2003). Seeing and Visualizing: It’s not what
you think (Life and Mind). Bradford Book.
Ross, D., Lim, J., Lin, R.-S., and Yang, M.-H. (2008). In-
cremental learning for robust visual tracking. Interna-
tional Journal on Computer Vision, 77(1-3):125–141.
SanMiguel, J., Cavallaro, A., and Martinez, J. (2012).
Adaptive on-line performance evaluation of video
trackers. IEEE Trans. on Image Processing,
21(5):2812–2823.
Shitrit, H. et al. (2014). Multi-commodity network flow
for tracking multiple people. IEEE Trans. on Pattern
Analysis and Machine Intelligence, 36(8):1614–1627.
Sochman, J. and Hogg, D. (2011). Who knows who - in-
verting the Social Force Model for finding groups. In
Proc. of Internation Conference on Computer Vision
Workshops, pages 830–837, Barcelona, Spain.
Solera, F., Calderara, S., and Cucchiara, R. (2013). Struc-
tured learning for detection of social groups in crowd.
In Proc. of Advanced Video and Signal-Based Surveil-
lance, pages 7–12, Krakow, Poland.
Tominski, C., Schumann, H., Andrienko, G., and An-
drienko, N. (2012). Stacking-based visualization of
trajectory attribute data. IEEE Trans. on Visualization
and Computer Graphics, 18(12):2565–2574.
Veeraraghavan, A., Chellappa, R., and Srinivasan, M.
(2008). Shape-and-behavior encoded tracking of bee
dances. IEEE Trans. on Pattern Analysis and Machine
Intelligence, 30(3):463–476.
Whitehorn, L., Hawkes, F., and Dublon, I. (2013). Super-
plot3D: an open source GUI tool for 3D trajectory vi-
sualisation and elementary processing. Source code
for biology and medicine, 8(19):1–4.
Wong, B. (2012). Points of view: visualization biological
data. Nature Methods, 9(12):1131.
Wu, B. and Nevatia, R. (2006). Tracking of multiple, par-
tially occluded humans based static body part detec-
tion. In Proc. of Computer Vision and Pattern Recog-
nition, pages 951–958, New York, USA.
Yang, B. and Nevatia, R. (2012). An online learned CRF
model for multi-target tracking. In Proc. of Com-
puter Vision and Pattern Recognition, pages 2034–
2041, Providence, RI.
Yang, B. and Nevatia, R. (2014). Multi-target tracking by
online learning a CRF model of appearance and mo-
tion patterns. International Journal on Computer Vi-
sion, 107(2):203–217.
Yin, F., Makris, D., and Velastin, S. (2007). Performance
evaluation of object tracking algorithms. In WPETS,
Rio de Janeiro, Brazil.
Zhang, S., Wang, J., Wang, Z., Gong, Y., and Liu, Y. (2015).
Multi-target tracking by learning local-to-global tra-
jectory models. Pattern Recognition, 48(2):580–590.
Zhang, T., Hanqing, L., and Li, S. (2009). Learning seman-
tic scene models by object classification and trajectory
clustering. In Proc. of Computer Vision and Pattern
Recognition, pages 1940–1947, Miami, FL, USA.
IVAPP2015-InternationalConferenceonInformationVisualizationTheoryandApplications
162
