
Visualization of Music at Arm’s Length
João Tiago Gomes, Maria Beatriz Carmo and Ana Paula Cláudio
LabMAg, Faculdade de Ciências, Universidade de Lisboa, Lisboa, Portugal
Keywords: Natural Interaction, Leap Motion, Visualization, Musical Composition.
Abstract: This paper presents an interactive application to compose music. It aims to give anyone the possibility of
creating music from various sounds that can be composed on top of each other to create music of increased
complexity. The musical composition is accompanied by a 3D visualization that is intended to serve not
only as a guide to the user’s composing process but also as a visualization of the music being created. A
user study was conducted to assess the composition process, the interaction with a Leap Motion device and
the correspondence between sound and visualization.
1 INTRODUCTION
Lev Sergeevich Termen patented in 1928 an
electronic musical instrument called Theremin. The
musician controlled this instrument without any
actual physical contact. The instrument has two
antennas that control the pitch (or frequency) and the
amplitude (or volume) of the sound. Each antenna is
controlled with one hand and the musician brings his
hands closer to the antennas in order to control the
sound the instrument produces.
In 2012 the Leap Motion device was announced.
This device tracks the position of the user’s fingers,
hands and forearms very accurately (1/100 of a
millimetre) in a semi hemispheric space of about one
meter. The Leap Motion device made it possible to
mimic the interaction with a Theremin.
Besides playing an instrument, several musicians
create music in real time assembling sounds
produced wheter by voice or by instruments. Several
contemporary musicians have been following this
approach for some time. This is only possible using
recent technology (hardware and/or software). This
trend is not specific to a musical style. Nowadays
there are artists from several musical styles that use
this process to produce music.
The goal of this work was to develop an
application with three components: first of all, a
musical component that would enable the user to
play several sounds and compose them as he wishes;
in second place, to use the Leap Motion device to
interact and create music, trying to keep this
interaction as natural as possible; and finally, to
visualize music by clearly identifying the various
sounds used in the composition. These three
modules, although separate, have to work together in
order to provide a good user experience. This is even
more relevant with a new form of interation that is
not the keyboard and mouse. By using the Leap
Motion device we have to take into account new
problems and challenges that do not exist in
traditional interfaces that have been studied for a
long time.
After presenting related work in section 2, the
components of the application are explained in
section 3. The results of a user study are presented in
section 4 and in section 5 are shared the main
conclusions and future work is pointed out.
2 RELATED WORK
In this section we focus on projects developed in the
musical area to compose music with an incremental
process and on web applications for music
visualization.
Musical Process
The work of several contemporary artists was
analysed (DubFX, Zöe Keating, Tom Thum e Jarle
Bernhoft). These artists produce music all by
themselves by playing and combining several
instruments and sounds. First of all the artist has at
his disposal pieces of equipment (hardware) and/or
software that allows him to record several tracks.
The artist starts by recording a single track, whether
his own voice or an instrument. After this, the sound
454
Tiago Gomes J., Beatriz Carmo M. and Paula Cláudio A..
Visualization of Music at Arm’s Length.
DOI: 10.5220/0005312604540461
In Proceedings of the 10th International Conference on Computer Graphics Theory and Applications (GRAPP-2015), pages 454-461
ISBN: 978-989-758-087-1
Copyright
c
2015 SCITEPRESS (Science and Technology Publications, Lda.)

that was just recorded starts playing immediately in
an infinite loop. Next, the artist records another
sound in a different track, while the previous one is
playing. This process is repeated several times in
order to overlap the several tracks to create more
complex music.
Real Time Music Visualization
Several applications have the ability to present
music visualization in real-time. They are able to use
information about the sound frequency at a given
moment and use that information to create the
visualization in real time. The most common
example of this is a simple bar equalizer that is
present in some musical devices, such as stereos.
Some applications only possess a single 3D
visualization, like Loop Waveform Visualizer (Loop,
2012), Music Colour Particles (Color Particles), and
Cube Visualizer (Cube Visualizer), whereas others
have several. These more simple applications make
use of already known musical visualizations, for
example a sound wave, and transform it in a 3D
version. While A Dive in Music (Dive) has more
than 20 visualizations, all very complex and
involving always particle emitters.
Pre Processed Music Visualization
The clear advantage of pre-processed music
visualization when compared to real time
visualizations is that the end result can be much
more rich in graphic terms because much more
processing power can be used to generate such
visualizations. This processing power can be
devoted purely to image rendering or distributed also
to sound analysis. For example, when comparing the
previous example A Dive in Music with Ljósið
(Ljósið), it is clear the difference between the
particle quality in each example and in the overall
graphic impact that this quality causes on the user.
Another example of pre-processed applications is
one from Christopher Garcia (Garcia, 2011). This
author uses a two-step process to create a musical
visualization. First, he analyses the music and writes
information to a file that is then used to serve as
input to create the visualization itself.
Visualization and Creation of Music
Some applications offer the user the possibility of
creating music and visualising it at the same. In this
case, the applications are mainly focused on the
creation instead of the visualization, which means
that the interactivity plays a key role.
Several applications were analysed, either with
3D or 2D visualizations, but they were all very
similar: ToneMatrix (ToneMatrix), Beat Petite
(BeatPetite) and ToneCraft (Tone Craft). In these
applications it is possible to play different sounds at
different moments in time. The metronome that
counts the time and regulates the moments when
notes are played has a significant role in these
applications. When the bar comes to an end it
returns to the beginning and therefore loops
infinitely. In each of the applications it is possible to
play a total of sixteen notes in each bar (wherein the
application’s metronome is in an infinite loop).
The ToneMatrix application, besides using a
metronome and repetition as stated before, it uses a
slight delay between beats. This delay coupled with
the repetition of the metronome gives music
produced by this application a jazz tempo.
3 VISUALIZATION OF MUSIC AT
ARM’S LENGTH
We developed an application to create music
combining predefined sounds. This application has
three main components: a) audio, that manages
playing and recording various sounds and provides a
mechanism to keep track of time in a precise way; b)
user interaction, both by using the Leap Motion
device to play and compose the various sounds and
through a graphical interface to also compose the
several sounds; c) visualization of the created music.
This was accomplished using the javascript
language, HTML5, CSS3 and Web Audio API and
was built for the Google Chrome browser. The final
application can be available on the web, not
requiring any additional download: the user only
needs to own a Leap Motion device.
3.1 Audio
The audio component was the most challenging. It
has two different roles. One is the ability to count
time in an exact and reliable way. The other one is to
make available several sounds to be played, organize
several tracks and be able to handle the process of
playing and recording each track.
Taking into account the technology used to
develop this application, it was difficult to
accomplish all these requirements and avoid any
major delays in terms of sound synchronization and
performance.
3.1.1 Audio Graph
The web audio component was made using the Web
Audio API whose main paradigm to handle audio
consists of a graph of several linked nodes that route
VisualizationofMusicatArm'sLength
455
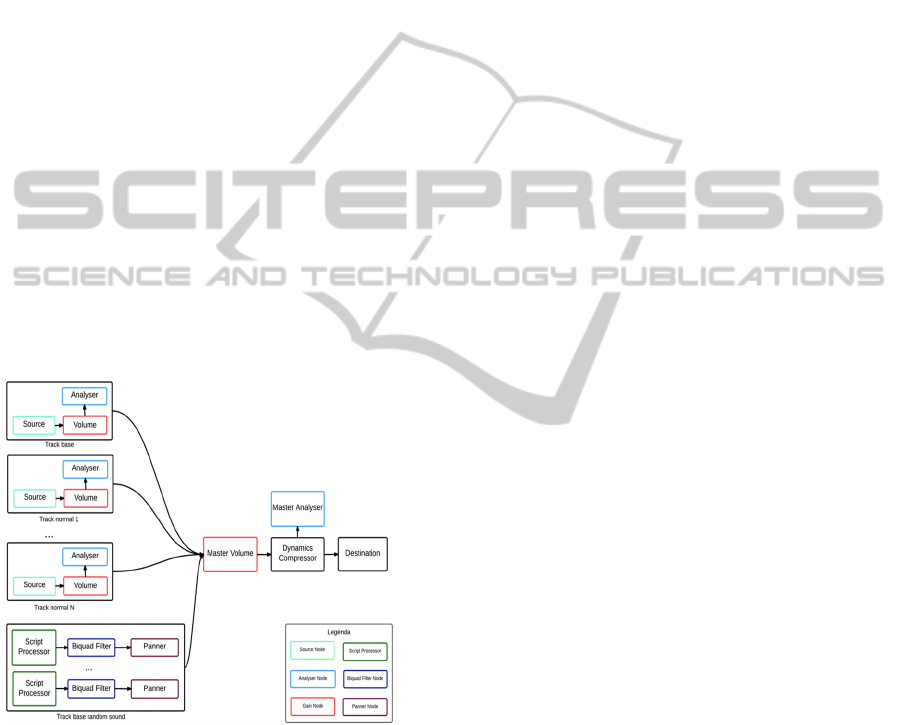
the audio from its sources to its destination, as
shown in Fig. 1.
The entire graph is constructed in the
initialization moment. This means that all the nodes
are created and their relationships are established.
After this initialization phase, several properties of
each node are manipulated, for example, changing
the sound level of a track.
The graph can be divided in two groups: the
nodes that are common to every track in the
application (right side of the graph) and the tracks
themselves. Regarding the tracks, we considered two
types: the base tracks and the normal tracks.
The common section is composed of four nodes:
a Gain Node, named Master Volume, which controls
the overall sound of the application; a Dynamics
Compressor that prevents sound distortion and to
achieve this it boosts lower sounds and decreases
higher ones; an Analyser Node, called Master
Analyser, to analyse the sound that passes through it
and pass that information up to the developer. The
Destination Node, located at the right end of the
graph, is the one that eventually every other node is
going to connect to, whether directly or indirectly.
This node represents the computer’s audio exit,
usually the speakers.
Figure 1: Audio routing graph.
There are two base tracks: one has a sound of a
drum base and the other one has a synth sound that
produces a continuous and surrounding sound. The
base track that possesses the base drum sound has
three nodes: a Gain Node, called Volume, which
controls its volume; an Analyser Node, simply
called Analyser, which sends information about this
track’s frequency levels to be used to generate the
visualization of this track; and a Source Node that
emits the sound.
The remaining base track that contains the synth
sound is more complex. It was adapted from an
existing library. It produces sound by using up to 20
random sound generators. Each one of these random
sound generators uses a Script Node Processor to
generate sound in a random fashion. The sound
passes through a Biquad Filter Node that is
configured to the BANDPASS mode and limits the
range of frequencies that pass through this filter.
Finally a Panner Node is used to make the sound
that passes through it sound like its coming from a
different direction every 0.5 seconds. This produces
a random sensation in the user.
Each one of these random sound generators has
a specific frequency that serves as input to the
Biquad Filter Node, so each generator plays a
specific frequency that is randomly selected from a
restricted set of frequencies. This makes that final
sound is enjoyable.
Finally, the normal tracks are also composed by
three nodes, as the base drum base track is. There
are currently five normal tracks but can easily be
added more.
3.1.2 Metronome, Marking Time and
Performance
Marking time correctly and building an exact
metronome was crucial. Performance was therefore
a critical part of the application, keep in mind that
the application’s visualization, audio component and
interaction with the Leap Motion device are all in
real-time. Taking into account that the application
runs in a web browser, it has a handicap because of
the browser’s clock precision.
Based on the number of BPM (Beats Per Minute)
and of notes that the user can play in each bar, a
millisecond interval is defined. This is the interval of
time that separates each beat; each time this interval
of time has passed the metronome “awakens” and
knows that has to perform a series of actions; those
actions in javascript translate into a callback
function. This function is responsible for: start
recording a track; end recording a track; update the
counter that is responsible for knowing when to stop
recording a track; play sound if the user wants to
play the sound of a specific track; play the sounds of
the base tracks; in case there is a track with a
recorded sound and if it is time to play it, in fact play
it; lastly, get the correct counting of notes.
As was mentioned before, there is a slight delay
of a few milliseconds in the browser’s clock. This
makes the metronome “awakening” not the same
throughout time. Also, the cumulative effect of all
GRAPP2015-InternationalConferenceonComputerGraphicsTheoryandApplications
456
individual delays causes even more problems on
terms of performance.
A strategy to solve this problem was to schedule
the next call of the next “awakening” not to the
expected value but to adjust it so that it takes into
account the previous delay. Thus, the cumulative
error of each callback is eliminated, remaining only
the error of single calls.
This technique reduces to acceptable levels the
clock delay between callback calls. However, inside
the callback function, the operations must be
executed in sequence to avoid audio discrepancies.
Therefore a critical zone was created were
operations are executed consecutively. These
operations are prepared previously.
Threads were tested in this audio component but
they proved inefficient because of the
communication delay between the main thread and
the secondary thread.
3.1.3 Tracks
The application has several tracks and each one
plays a specific sound. When the application
initializes, the various sounds are loaded from .wav
files. Each sound is of a single instrument or part of
instrument (drum sounds for the most part). As
stated before there are two types of tracks, base
tracks and normal tracks.
The difference between them is the level of
control the user has over them. The base tracks are
played automatically from the start of the application
to the end. The normal tracks are controlled by the
user, specifically through a Leap Motion device.
Each track sound was chosen taking into account
how it sounded by itself and together with other
sounds, but most importantly because of its duration.
As has been explained before, there is a time interval
between callback calls and the duration of each
sound cannot exceed that interval because sounds
cannot overlap.
3.1.4 Recording Sound
Several approaches were tested to record sound. The
first one was to record sound using an existing
library that uses javascript nodes and threads to
accomplish that task. However, the result did not
have the needed precision to start recording and end
recording at an exact moment, because of the latency
that javascript nodes and threads have when used
with the Web Audio API.
Another solution was used: record the moment
when the sound was played instead of the sound
itself. That is, when the application is in recording
mode, it knows that is recording a given track and
knows when a sound is played. Hence, if a sound is
played, it is stored in a boolean vector as true, if a
sound is not played then the value is set as false.
3.2 Interaction
The user’s interaction with the application is made
in two complementary ways: through the use of a
Leap Motion device to play sounds and by using the
graphical interface to control the several tracks.
3.2.1 Interaction with the Leap Motion
The user interaction with the application regarding
music composition is made through a Leap Motion
device. The user is capable of controlling rhythm
sounds, meaning that these sounds do not prolong in
time: they are played and shortly after turn to
silence. A counterexample is a violin sound where
the player can prolong the sound for some time. As
the rhythm sounds end rapidly it was decided to give
the user the ability to control two parameters: first,
the moment when the sound is played (this moment
can be one of sixteen pre-established moments that
can be played) and also the volume of the sound.
Once a track is selected and therefore a sound is
also selected, a user can play that sound. The user’s
left hand controls the moment the sound is played.
Optionally, the user can use his right hand to control
the volume of the sound that is being played. To
identify hand positions boundary planes were
defined, both horizontal and vertical. So, a vertical
plane parallel to the yy and zz axis was placed at the
middle of the scene and it separates the zone of
action of each hand (Fig. 2).
For the left hand were defined 4 vertical zones,
each one corresponding to a specific action: the
higher one prevents any sound from being played
(z1); the next zone plays the sound at a normal rate
(the same rate of the metronome) (z2); below this
one, sound is played at double rate (twice the speed
of the metronome) (z3); and finally, the bottom zone
Figure2: Screenshot of the application where the different
action zones are visible.
VisualizationofMusicatArm'sLength
457

plays the sound at a rate four times the metronome
(z4). The speed at which the sound is played is
directly related with the speed of the metronome as
well as the number of notes that can be played and
the moments at which they can be played also.
In table 1 the cells noted with "x" correspond to
the moments when sound is reproduced according
with the zone where the left hand is.
The right hand of the user controls the volume of
the sound that is being played. For this hand,
boundary planes were also defined to separate
different zones of action: the higher zone matches
the higher volume (80%), the lower zone matches
the quieter volume (10%) and in between a
proportion was made between the position of the
user’s hand and the volume itself. The extreme
zones occupy both 25% of the space available and
the intermediate zone occupies the remaining 50%.
Fig. 2 shows the virtual hands and the boundary
planes. As no track is selected, the boundary planes
are coloured with a neutral colour as well as the
virtual hands. When a track is selected, both the
virtual hands and the boundary planes change colour
to give feedback about what is happening on screen.
3.2.2 Graphical Interface to Control Music
and Track Time
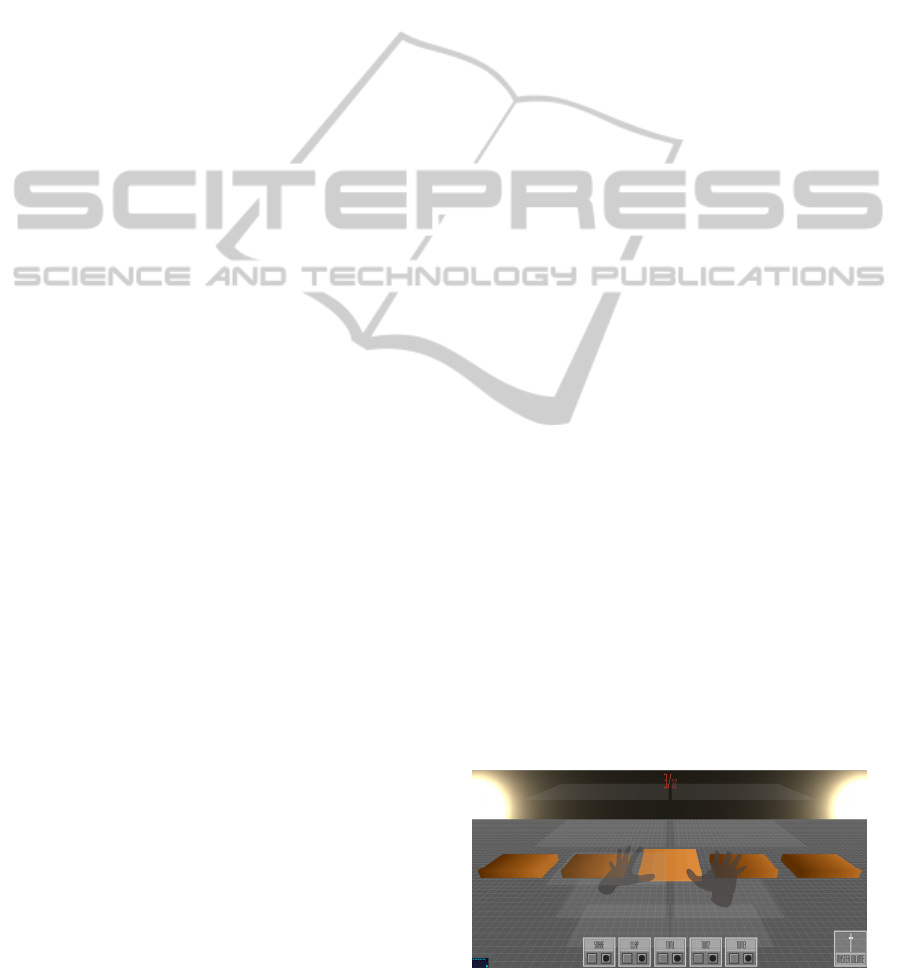
The graphical interface (Fig. 3) is composed of three
main areas: the track zone, the master volume zone
and the time zone.
In the lower right side of the screen there is a
slider labelled as Master Volume that controls the
volume of the entire application, that is, the volume
of the Master Volume node in the audio graph.
In the bottom centre of the screen are 5
rectangular areas that represent each one of the
normal tracks. By selecting one track the user can
play the sound associated with that track. Each track
area has two buttons: one to record and one to either
pause or play, depending on the current state of that
track.
By pressing the record button the top half of the
track area turns orange to indicate that the
application is preparing to record (the actual
recording happens at the beginning of the bar, the
user can guide himself by the numbers that keep
track of time that will be explained ahead). When
the track actually begins to record, the area turns red.
Once the recording is finished, it turns green to
indicate that the track is now playing in loop. Then
the user can choose to either pause that track, and
the track area turns brown, or record again erasing
the previous recording.
Finally, in the top centre of the screen there are
two numbers in the X/X format. The left one counts
the tempo of the metronome, from one to four, and
is synchronized with it. The second number, the one
on the right goes from one to sixteen and represents
the number of notes the user can play with his left
hand when his hand is in the zone z4 (table 1). The
second number is related with the first because it
divides each tempo in four. This means that when
the first number has the value one, the second
number has the value one and then becomes two,
then three and finally four, as the second number
turns to five, the first becomes two and so on.
3.3 Visualization
One of the goals of this application was to match the
sound heard by the user with the visualization of that
sound. As mentioned before, the application has two
types of tracks: base and normal tracks. To visualize
the base track that reproduces the sound of a drum, a
vertical plan was placed at the back of the 3D scene
containing two circles, positioned in the left and
right lower corners of the plan (Fig.3). These circles
grow in size as they react to the sound of the base
track and resemble a pulsing light. This visualization
is initiated as soon as the application begins.
The normal tracks can be manipulated by the
user. To each track corresponds a block, composed
of several parallelepiped. All the blocks are aligned
horizontally (Fig. 3). These blocks are animated and
move when the corresponding track plays sound. To
identify if a track is playing, three types of
animations were defined: one to the extreme blocks,
one to the middle block and one to the second and
fourth blocks (Fig. 4).
Table 1: For each action zone is displayed the moment when the sound is reproduced.
z1
z2
xx xx
z3
x x x x x x x x
z4
x x x x x xxxx x x x x x x x
Zone vs
time
1 2 3 4 5 6 7 8 9 10 11 12 13 14 15 16
GRAPP2015-InternationalConferenceonComputerGraphicsTheoryandApplications
458
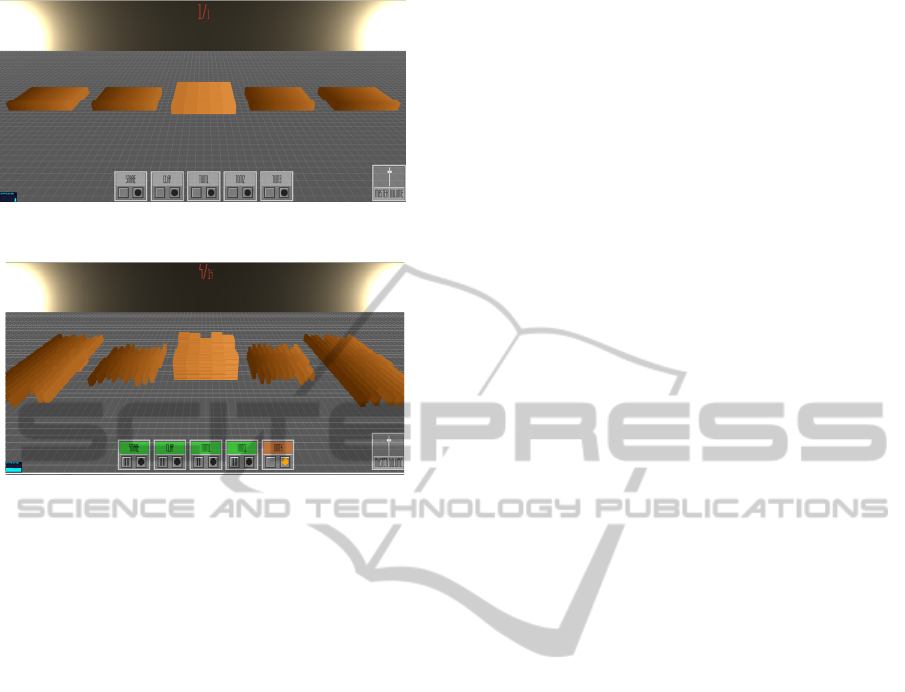
Figure 3: The normal tracks are not playing.
Figure 4: The normal tracks are playing.
The blocks on the extremes left and right are
composed of 20 parallelepipeds with the largest
dimension parallel to the zz axis and perform a scale
transformation along the same axis. The middle
block consists on a set of 5x5 parallelepipeds and
performs a scale transformation in the yy axis.
Finally, the remaining two sets are also composed of
20 parallelepipeds with the largest dimension
parallel to the zz axis and perform a translation along
this axis in an uneven way, in other words, if the
first parallelepiped translates positively in the zz
axis, then the second parallelepiped translates
negatively, and so forth. The animations of the
blocks use a random factor to affect their size.
4 USER STUDY
4.1 Methodology
A user study was performed involving two sets of
users: experts and common users. The experts were
divided in two groups, music experts and interaction
experts. For each participant, an interview was
conducted in the following way: first of all a brief
explanation of how the application worked was
given, after that the participant experienced the
application freely and finally he answered questions
posed by the interviewer. The questions aimed to get
feedback about the usability and quality of the
application but also to gather opinions about future
improvements that can be made.
The questions had three different formats:
• Rating questions where a one to five scale was
used and the user was asked to classify a feature
of the application.
• Choice questions where two alternate answers
were presented and the user was asked to choose
one of them.
• Semi-open choice questions where the user was
asked to choose an alternative and was invited to
suggest alternatives.
The interviews took in average 30 minutes with
common users and about 1 hour with experts. The
set of questions was the same, but the open choice
questions were answered with different levels of
detail.
4.2 User Profile
The tests were performed on a universe of 23 users
aged between 17 and 50 (average 28). In order to
define each user profile, it was asked the user’s age
and gender, if he usually plays computer/console
games; if he knows how to play an instrument; and
finally, his dominant hand (right hand, left hand or
both). 78% had some kind of experience in playing
with computer/console and 77% of the participants
knew how to play at least one instrument.
Due to their background and training some of the
participants were considered experts in the musical
or interaction areas. The musical experts know how
to play an instrument and have also in depth musical
knowledge or are professional musicians or know
how to work in musical production. The interaction
experts, because of their job or academic career,
handle and build user interfaces on a regular basis.
Four people were considered musical experts and
two were considered interaction experts.
4.3 Result Analysis
Not all interviews were performed in a computer
that offered the best user experience. Taking this
into account, a rating was given to each computer
where each interview was performed and the results
were analysed with this in mind. However, this was
not as problematic as was expected, firstly because
only four interviews were conducted in a poor
computer; secondly because even in these cases
there was only a reduced number of questions that
escaped the norm of answers. Finally, the answers
that escaped the norm are duly referred in the
analysis.
VisualizationofMusicatArm'sLength
459

Audio
The interviewed users were happy with the choice of
rhythm sounds that were present in the application
(100% greater than or equal to rating 4 and 52%
with rating 5). When asked if they would like to
experiment sounds that were not only rhythmic, the
result was unanimous, 100% said yes.
Beyond sounds that could be controlled by the
user questions were made regarding the base track.
The assumption at first was that it would help the
composition process for someone that was not very
experienced in an application of this type. This
assumption was confirmed by the answers given
with 78% saying that the beat sound always present
was a plus because it gives some sort of foundation
to work upon. 18% of the answers were in the
opposite way and a user suggested that this should
be something that the user could turn on and off at
will. It is worth mentioning that from the negative
responses (only four), two were given by experts.
This is important because experts tend to be more
creative when using the application and do not need
this artificial “crutch”. The next question was about
the beat speed, specifically BPM speed (it was set to
90 BPM, i.e., beats per minute). For this answer the
scale was: 1 – speed much slower, 2 – speed slower,
3 – ideal speed, 4 – faster speed, 5 – much faster
speed. So the assumption here was that the results
would be expected closer to the number 3 instead of
5. This assumption was confirmed with 75% of users
giving rating 3 to this question. The remaining gave
an answer that was not in the questionnaire, they
answered the speed should be adjustable. Two of
these answers were given by experts.
Finally, the last feature tested was the recording
process. With 78% of the users giving a rating of 4
or higher this was the least successful aspect of this
section. Despite some initial confusion by the users
they were able to understand how all worked and did
not find it to complex. In a general way the audio
response was positive.
Interaction
The main purpose of these questions about
interaction was to know users’ opinion about playing
sounds with their hands and the activities assigned
with each hand.
About the 3D position of the user’s hands,
specifically the number of action zones and
precision, it was asked whether 4 zones is the ideal
number of zones or if another number is more
appropriate. 61% of users said that 4 zones were
ideal, 13% chose 3 and 26% said that 5 or even 6
zones was preferable.
84% of users gave rating 4 or higher when asked
if it was easy to identify the zone in which their
hands were. There was an answer with rating 1 but it
was mainly due to the poor hardware of the
computer in which the test was performed.
About the choice of colours of the plans (green
and grey), 79% of users gave a rating 4 or 5.
Concerning the colours of the virtual hands (red and
blue) 86% of users gave rating 5.
Concerning the use of the right hand to control
the volume of the sound, as it does presently, or if it
should control another parameter, for example, a
sound effect like a distortion or something similar,
70% of users said that another parameter was
probably best.
Regarding switching the activities of each hand,
the answers to this question were analysed having in
mind the dominant hand of the user. Only 3 left-
handed participants were found and any findings
based on this universe of people are fragile.
Nonetheless, when all users are considered, 22% of
them would rather switch hand activities. However
if only right-handed people are considered this
percentage increases to 25%. Left-handed people
unanimously consider that the ideal is not switching
hands’ activities. This means that 34% of the
participants prefer to use the dominant hand to
compose music. However, it is worth mentioning
that most users said that it did not matter which hand
was assigned for each type of activity.
Visualization
The goal of the set of questions about visualization
was to know if the visualizations that were chosen
are adequate and if they were easily linked to the
corresponding sounds.
In the question about the clear matching of sound
with visualization, 70% of users gave a rating of 4
(easy) while the remaining 30% gave the maximum
rating of 5 (very easy).
Next it was asked how easy it was to identify the
visualization of the base track. 65% of users gave a
rating of 5. There were also ratings 1 and 3, but in
the case of the rating 1, the study was conducted in a
computer with poor performance. Some users did
not realise that the pulsating light at the end of the
scene matched the base track beat sound.
Regardless of track visualizations, users were
asked if the scene as a whole was enjoyable from a
graphical standpoint. 65% gave a rating of 4 and
31% gave 5.
Regarding the use of parallelepipeds (blocks) for
the visualization of normal tracks, 43% gave a rating
of 3 and 48% gave 4. It was also asked if they had
any alternative in mind for the visualizations. Most
GRAPP2015-InternationalConferenceonComputerGraphicsTheoryandApplications
460

suggestions were other geometrical choices as cubes
or prisms.
Lastly, it was asked if each block should have an
individual colour or, on the other hand, if they
should remain as they were. 78% of users preferred
individual colours. Some participants stated that,
besides colour, the order in which blocks are
presented facilitate their identification, therefore the
choice of colour is not so important.
5 CONCLUSIONS AND FUTURE
WORK
We presented an interactive Web application to
compose music from rhythmic sounds in real-time.
It integrates 3 main components: audio, to play and
record several sounds; interaction, using the Leap
Motion device to command music composition; and
visualization of the music that is played.
A user study was conducted involving common
users as well as experts to assess usability and obtain
user feedback. The interest shown on the innovative
nature of the application suggests an increasing
interest about new forms of interaction by the users,
especially of musical nature. Many of the users
revealed a great enthusiasm in future developments
and suggested the implementation of new features.
The main innovation of this application is to
combine the components of audio, visualization and
interaction, providing a natural interaction to
compose music with a Leap Motion device.
As future work it would be interesting to
combine more sounds and not only rhythmic sounds.
For example, sounds with notes as a xylophone
(discrete sound) or as a violin (continuous sound).
Using sounds like these ones will bring new
challenges, both in musical composition and in
interaction issues.
To improve interaction it would be interesting to
explore the new features of the more recent Leap
Motion driver. One of the new features is to identify
if the user’s hand is closed. This gesture can
command stopping playing a sound, eliminating the
need to use an action zone for this purpose.
ACKNOWLEDGEMENTS
We thank the Portuguese Foundation for Science
and Technology (FCT) and the R&D unity LabMAg
for the financial support given to this work under the
strategic project Pest OE/EEI/UI0434/2014.
REFERENCES
Airspace, Leap Motion Store – Airspace
https://airspace.leapmotion.com/
BeatPetite http://beatpetite.com/.
Bernhof http://bernhoft.org/.
Biquad Filter, The Biquad Filter Node Interface
http://webaudio.github.io/web-audio-api/#the-
biquadfilternode-interface.
Color Particles, Music Colour Particles. jabtunes.
http://jabtunes.com/labs/arabesque/.
Cube Visualizer.
http://shoffing.com/pages/projects/cubevis/.
Dive, A dive in Music.
http://do.adive.in/music/.
Dub FX http://dubfx.net/.
Leap, Leap Motion https://www.leapmotion.com/
Ljósið, Ólafur Arnalds - Ljósið (Official Music Video)
http://vimeo.com/6284199.
Loop, Loop Waveform Visualizer. Air Tight
Interactive.http://www.airtightinteractive.com/2012/01
/loop-waveform-visualizer/
Garcia, C. M., 2011, Study on the Procedural Generation
of Visualization from Musical Input Using Generative
Art Techniques. Master Thesis Texas A&M
University.
Panner, Panner Node Interface.
http://webaudio.github.io/web-audio-api/#the-pannernode-
interface.
Theremin, Ssergejewitsch, Theremin Leo. Theremin
Signaling Apparatus. US1658953 A USA, 14
Feb1928. Grant.
Tom Thum, Beatbox brilliance: Tom Thum at
TEDxSydney
http://www.youtube.com/watch?v=GNZBSZD16cY&
feature=youtu.be&t=8m12s.
Tone Craft.
http://labs.dinahmoe.com/#tonecraft.
ToneMatrix, ToneMatrix. AudioTool.
http://tonematrix.audiotool.com/.
Web Audio API.
http://webaudio.github.io/web-audio-api.
ZoeKeating, Zoe Keating - 'Lost' [HD] Sound Quality,
ABC Radio National. Youtube. http://www.youtube.
com/watch?v=sG9H5E2JN3s.
VisualizationofMusicatArm'sLength
461
