
The Visualization of Drama Hierarchies
Vincenzo Lombardo
1
and Antonio Pizzo
2
1
Dipartimento di Informatica and CIRMA, Universit
`
a di Torino, corso Svizzera 185, Torino, Italy
2
Dipartimento di Studi Umanistici and CIRMA, Universit
`
a di Torino, corso Svizzera 185, Torino, Italy
Keywords:
Hierarchy Visualization, Drama, Sequence.
Abstract:
Drama, the art that displays characters performing live actions in telling a story, is pervasive in cultures and
media. The study of drama often resorts to hierarchical structures to explain the sequences of incidents that
occur. Hierarchies provide an explanation of why incidents are in the sequence or cluster elements into sub-
sequences that form a meaningful structure. This paper addresses the visualization of drama hierarchies. The
paper inspects the peculiar features of drama hierarchies and proposes a visualization built upon the metaphors
of tree mapping and timeline, respectively. The visualizations are preliminarily applied in tasks of analysis
and interpretation in supporting teaching and research of drama scholars.
1 INTRODUCTION
It often happens, in science and humanities, that phe-
nomena occur as sequences that are spanned by some
hierarchical structure. This means that the sequence
is the left–to–right collection of the leaves of the hier-
archical structure, although the sequence exists on its
own. In this paper, we address the hierarchic structure
of drama linear incidents, as formulated with differ-
ent goals by (Freytag, 2004), (Lavandier, 1994), and
(Lombardo and Pizzo, 2013). As we will see, drama
consists of units, that are mini dramas, and these in
turn consist of more and more reduced dramas until
the elementary advancement of the plot through some
specific incident.
Sequences (often timelines) and hierarchies have
received much attention in the visualization litera-
ture. Timeline has been one of the most addressed
visual metaphors (see the book (Aigner et al., 2011)
for a survey (http://survey.timeviz.net, visited Decem-
ber 2014); trees have been the object of several ap-
proaches of information visualization (Schulz, 2011).
Node-link, nested squares or circles, horizontal and
vertical adjacency, indented–list, and matrix represen-
tations are well known in the literature, each with spe-
cific advantages and disadvantages, depending on the
task at hand. For example, containment (or nested)
approaches have the advantage of a bounded space
but leave no room for node content visualization.
However, the theme of introducing in the same vi-
sualization space both hierarchies and sequences, as it
is the case for drama, has been neglected. This type of
visualization poses a number of challenges that need
a customization of the approaches above: both the
(unique) sequence and the (multiple) hierarchies have
an existence of their own, respectively, with elements
in the sequence and elements in the hierarchy aligned
along some dimension; also, for purposes of theory
incompleteness, it can happen that some elements of
the sequence are not spanned by any element in the
hierarchy and that some element predicted by the hi-
erarchy is not mapped onto any element in the se-
quence; finally, we have that multiple hierarchies can
span the same sequence, providing alternative expla-
nations. All these issues are of interest for the scholar
and the teacher of drama.
In this paper, we address the issue of visualizing
both the sequence and the hierarchies that span it in
the same visual space, applied to the specific case of
drama hierarchies. We introduce the generic chal-
lenges of such a combined visualization. We take
as input a formal representation of dramatic media
objects, that encodes the sequence of incidents of a
drama as well as a number of hierarchies that pro-
vide an explanation of the dramatic facts, and we de-
velop an algorithm for the representation of both the
incident sequence and the structure hierarchies in the
same visual space. Finally, we address the effective-
ness of the visualization in research and teaching of
drama in specific phenomena of interest.
163
Lombardo V. and Pizzo A..
The Visualization of Drama Hierarchies.
DOI: 10.5220/0005314801630170
In Proceedings of the 6th International Conference on Information Visualization Theory and Applications (IVAPP-2015), pages 163-170
ISBN: 978-989-758-088-8
Copyright
c
2015 SCITEPRESS (Science and Technology Publications, Lda.)

2 INCIDENT SEQUENCE AND
DRAMA HIERARCHIES
Storytelling is a pervasive activity across all cultures
and ages, especially in its dramatic form (Mamet,
1998). In western culture, storytelling has taken many
different forms, from fairytales to TV fiction, surviv-
ing the transformations occurred to media. Esslin
(Esslin, 1987) defines “dramatic media” those that
display characters performing live actions, such as
theatre, cinema and videogames. The notion of
“story” is widely acknowledged as the construction
of an incident sequence that, abstracting from the the-
atrical or cinematographic properties, is motivated by
the cause–effect chain (Rimmon-Kenan, 1983); this
chain results from a complex interplay among agents,
events, and environments, well known in playwriting
techniques (Egri, 1946). Drama is a specific form of
storytelling made prevalently by character’s actions
after a deliberation process. Thus, drama is normally
perceived as a sequence of actions and events, and
the audience have to make sense out of this sequence.
In other words, we see a list of actions without the
description length that is available in a novel; never-
theless, we are engaged in a complex cognitive activ-
ity to reconstruct the plot and the sense behind those
actions and events. It is this sequence of incidents,
that is released by a playwright, possibly organized
into parts, that are called scenes, that are variable for
size or importance or both. Normally drama are di-
vided in acts and scenes: the former born out of the
need of set changes, the latter born out of the need
of character’s entrances and exits. This organization
has been kept as standard also when those needs no
longer hold, and still shapes most of contemporary
drama. Thus, a scene is considered a part of an act,
and the sequence of scenes also contributes to define
the rhythm of the play. In order to account for this
sequence and to visualize the length of the drama, in
our running example we measure the single elements
in our timeline by counting the number of verses of
the text.
Drama can be summarized as a group of specific
features, that can be defined more or less precisely.
These features refer to the identifiable elements in
Shakespeare’s Romeo and Juliet as well as in Tom
Stoppard’s Rosencrantz and Guildenstern Are Dead,
in HBO’s Sopranos and even in some reality show,
such as CBS’s Survivors, and, finally, in some fa-
mous videogame such as Rockstar Games’ L.A. Noir
or Ubisoft’s Assassin Creeds’ series. Drama schol-
ars have developed a number of approaches to dra-
matic texts and theatrical plays (Carlson, 1984). The
“technical point of view” relies on the so–called con-
structivist approach, which departs from the linguis-
tic and literary forms to focus on the constitutive el-
ements of drama. So, focussing on how the plot de-
velops and is structurally organized, how characters
are involved in the actions, what conflicts take place,
drama studies acknowledge the existence of hierar-
chies that span the sequence of incidents. Within
this framework, in particular, the analyses of La-
vandier (Lavandier, 1994), Ryngaert (Ryngaert and
Bergez, 2008), Hatcher (Hatcher, 1996), and Spencer
(Spencer, 2002) contribute by distilling the dramatic
elements that the author has to handle in order to pro-
duce a well formed play.
As a running example we refer to Shakespeare’s
drama Hamlet. This well known drama tells the story
of the Prince of Denmark, who is contemplative and
thoughtful by nature, facing the murder of his father
(the former King) by the usurper (the King’s brother
Claudius). Hamlet devotes himself to avenging his
father’s death, and decides to fool Elsinor’s Court by
acting mad. This madness makes him able to reveal
the corruption of the court and the guilt of his uncle,
who he kills in the final scene of the drama. Going
in depth in the plot, for the plan hierarchy case we
address the so–called “nunnery” scene in the Third
Act. In this scene, Ophelia is sent to Hamlet by Polo-
nius (her father, Lord Chamberlain) and Claudius (the
King) to confirm the assumption that Hamlet’s mad-
ness is caused by his rejected love. According to the
two conspirers, Ophelia should induce him to talk
about his inner feelings. At the same time, Hamlet
tries to convince Ophelia that the court is corrupted
and she should go to a nunnery. In the middle of
the scene Hamlet puts Ophelia on a test to verify her
honesty. Because he guesses (correctly) that the two
conspirers are hidden behind the curtain, he asks the
girl to reveal where her father Polonius is. She de-
cides to lie and replies that he is at home. As a conse-
quence, Hamlet becomes very angry in realizing that
even Ophelia is corrupted and there is no hope to re-
deem the court.
The case of incident sequence spanned by drama
hierarchies poses a number of issues to be accounted
for in visualization. Now we review such issues.
2.1 Representation and Processing
Issues of Drama Hierarchies
The representation issues to be accounted for when
we need to visualize drama hierarchies that span an
incident sequence in drama are the following.
The first issue is that the sequence and the hierar-
chies have both an existence on their own; they should
be both visualized in the same space with their own
IVAPP2015-InternationalConferenceonInformationVisualizationTheoryandApplications
164

features. Sequence features a total linear order of el-
ements; so, the visualization system should represent
such an order of the incidents in a story plot. Hier-
archical structures do not necessarily pose an order
on the leaves; so the several approaches to tree lay-
out can, but not necessarily, include such an order in
the visualization; the relevant relation is dominance
over the hierarchy nodes. In our cases of interest (hi-
erarchies that span a sequence), such trees are also
projective and the leaves of the tree are left–to–right
ordered.
The second issue is the spanning relation between
the hierarchical structure and the sequence. The hier-
archy, being the result of a top–down derivation pro-
cess (as, e.g., in the case of a generative grammar) or
a clustering (e.g., email stream structuring), consists
of internal nodes, that we call non terminal symbols
(NT, as it happens in grammars), and leaves, that we
call terminal symbols (t). The hierarchy spans the se-
quence, or portions of it: this means that the leaves or
terminals of the hierarchy, map the elements of the se-
quence to some extent. The elements of the sequence
that are spanned by the leaves of the hierarchy should
be aligned in the visual representation; so, the hierar-
chy sheds some light on the formation or motivation
of the sequence portions that are mapped. For exam-
ple, in the case of drama we can see in what step of
the story we are in a certain sequence (later, we see
that it happens that multiple type of hierarchies span
a sequence of incidents, with multiple meanings).
The third issue concerns the fact that the hierarchy
projects new elements onto the sequence. In the do-
main of drama, these new elements are null elements,
e.g., unimplemented characters’ intentions in drama,
that reveal what element, predicted from the hierar-
chy, is actually omitted in the sequence (which is
perfectly legal as a naturally occurring phenomenon,
anyway).
The fourth, final representation issue concerns the
possibility that multiple hierarchical structures span
the same sequence. This can happen for different rea-
sons. In drama studies, as we will see below, the se-
quence of the incidents develops from the projections
of the intentions of the characters; since each charac-
ter develops her/his intentions hierarchically, we have
again a forest of trees that span the same sequence;
however, in this case, the visualization does not ad-
dress several theories, but the contribution of each
character to the plot. In all these cases, the visual-
ization system must be able to distinguish the several
sources.
In addition to these four representation issues,
there exists one processing issue: the visualization
system should also work with incomplete informa-
tion; partial sequences and hierarchies allow the
users (researchers, scholars, enthusiasts) to work with
rough and partial interpretations that can be refined
and fixed as the theory improves. So, for example,
the scholar
In the remainder of this section, now we introduce
one specific type of drama hierarchy that spans the
incident sequence.
2.2 The Hierarchies of Characters’
Intentions
The character–centered representation of drama facts
(see (Lombardo and Pizzo, 2013)) introduces the in-
terpretation of incidents motivated by characters’ in-
tentions, i.e. plans that aim at realizing characters’
goals. Some incidents, usually a minority, can be un-
intentional events, so event that are not directly mo-
tivated by some character’s deliberation. Following
the BDI model of agent (Rao and Georgeff, 1995),
the formation of goals depends upon the beliefs of the
characters about the state of the world and about the
other characters’ mental states. Goals and beliefs are
mental states of a character.
The library of plans, organized in one or more hi-
erarchies associated with individual characters, link
goals and actions. Plans feature a tripartite struc-
ture: Preconditions, which are the states that enable
the application of the plan; Action or list of Subplans,
which are the actions to be performed to achieve some
goal; Effects, which are the states that hold after the
plan has been carried out successfully. There are base
plans, which consist of a single basic action, and re-
cursive plans, which consist of an ordered list of sub-
plans. Preconditions and effects can be mental states,
and state of affairs that hold in the story world for
the actions and plans to be executed. Higher plans
are recursively defined as sequences of (sub)plans
(again bordered by states). In our running example
of the “nunnery” scene, Hamlet and Ophelia feature
conflicting goals: Hamlet, who initially believes that
Ophelia is honest (a belief, i.e. a mental state), in-
tends to convince her to go to a nunnery to escape the
court corruption; Ophelia, who respects her father’s
authority (a value, again a mental state), intends to
induce Hamlet to talk about his love feelings (which
should be the cause of his madness). Recursively,
these plans consist of subplans: according to the anal-
ysis in (Lombardo and Pizzo, 2013), Ophelia’s plan
to induce Hamlet to talk consists of starting by wait-
ing to meet him in some room, then greeting him as
he enters the room, then returning him the gifts he
gave her in the past (in order to stimulate in him the
reflection about his love for her), and then “presum-
TheVisualizationofDramaHierarchies
165

ably” keeping the topic of conversation around love
until he overtly states that his madness is caused by
her rejected love. We say “presumably” because this
plan fails, because Hamlet refuses the returned gifts
(and we do not know how it could have continued);
so, Ophelia re–plans to explicitly introduce the topic
of the conversation (Hamlet’s madness). On the other
hand, Hamlet’s plan is convince Ophelia that the court
is corrupted and then advise her to go to a nunnery.
Also Hamlet’s plan fails because Hamlet realizes that
someone, probably Polonius, is hidden behind some
curtain in the room and, so, he re-plans to put at test
Ophelia’s honesty before going back to his previous
plan of advising her a nunnery. As we know, this does
not happen, and Hamlet gives up his plan definitely.
Each high–level plan roots a plan hierarchy. The
larger the hierarchy, the longer the span of the hier-
archy onto the sequence; the higher and longer the
number of hierarchies, the more present the charac-
ter in the drama. In case two plan hierarchies, of two
different characters, hinge on the same sequence por-
tion (sometimes even spanning the same incidents)
we have a dramatic conflict, usually solved with the
success of one character and the failure of the other.
For example, the climax of the “nunnery” scene is
when Hamlet, who wants to ascertain Ophelia’s hon-
esty, asks her a rhetorical question (“Where is your
father?”), knowing the right answer (that he is in the
room), hoping that she replies honestly, and Ophelia
lies (“At home, my Lord.”), trading honesty for loy-
alty to her father. This conflict should be visualized,
to help the drama analysis.
The whole approach works by matching the ac-
tions reported in the plans with the incidents in the
sequence; in this way, each plan spans some portion
of the sequence through the alignment of actions in
the plan with actions in the sequence. However, we
can notice that each plan also introduces precondition
and effect states, to border the actions or the subplans
(which recursively are implemented through actions)
on the left and the right, respectively. The incidents
of the sequence are viewed as operators that carry
on the story development from one state to the next
one; states are projected from the plan structure onto
the sequence, augmenting the representation connect-
ing the motivations (goals and plans intended by the
characters) to the actions actually carried out. So, if
we want to visualize the story advancements through
the states that hold during the drama development, we
augment the sequence with states, as extra elements in
the sequence. Finally, it happens that some incidents
in the timeline are not the result of a planned delib-
eration of some character or the hierarchies of plans
are incomplete with respect to the sequence: in both
these cases, the visualization should mark such mis-
alignments between the hierarchies and the sequence.
3 RELATED WORK
Sequences and hierarchies have been receiving many
solutions in the visualization literature (Heer et al.,
2010) (Liu et al., 2014), with specific metaphors for
time (Aigner et al., 2011) and trees (Schulz, 2011).
The case of multiple trees spanning the same set of
basic elements (usually the leaves of a tree) has been
the object of several approaches of information visu-
alization (see the survey in (Graham and Kennedy,
2010) on single and multiple trees). Some work (Card
et al., 2006) has also addressed the problem of stitch-
ing together hierarchical structure and time into one
visualization space, in order to help an analyst under-
stand how very large hierarchies change through time;
the goal is to enable the analyst to detect patterns of
relationships. However, this approach addresses the
evolution of a hierarchy in time rather than what hier-
archies span within some timeline.
The visualization of story relations has at-
tracted the attention of visual artists and amateurs
to provide unique maps for orientation. This
is particularly useful for stories with intricate
plots that are not immediate to grasp (see, e.g.,
the visualization of two Nolan’s films Memento,
2000, http://visual.ly/memento-scene-timeline,
visited December 2014, and Inception, 2010,
http://visual.ly/inception-timeline-visualisation, vis-
ited December 2014), but also to trace the overall
involvement of characters, visualized as horizontal
chronological lines that converge and diverge, il-
lustrating their mutual interactions as well as their
relationship in time with places and/or collective
events (see, e.g., the movie narrative charts at
http://store.xkcd.com/collections/posters/products/
movie-narrative-charts-poster, visited December
2014). The latter visual design was then automatized
through some algorithmic approaches in (Tanahashi
and Ma, 2012) and (Liu et al., 2013), with issues of
symmetry and compactness, and consequent impact
on readability of features with respect to the manual
version. Liu et al.’s work has also introduced the
issue of hierarchic information on places, which has
some loose connection with the hierarchic structures
visualized in our approach. Again, a multi-level sto-
ryline visualization method is undertaken by (Chen
et al., 2012), which organizes and synthesizes some
representative information, that includes locations,
objects, and characters, to produce a bi–dimensional
layout for movie summaries. The automatic op-
IVAPP2015-InternationalConferenceonInformationVisualizationTheoryandApplications
166
erations of clusterization and classification in the
video sequence remind of the sequence elements
in our representation, while the bi–dimensional
video–based layout could be a suitable presentation
method for the hierarchies addressed here.
On a more productive side, a number of visual
interfaces are provided with software tools that have
been developed to assist the creation and production
of dramas. For example, the writing assistant Dra-
matica Pro (http://www.writersstore.com/dramatica-
pro-story-development-software/, visited December
2014) visualizes the building blocks of a plot struc-
ture, with diagrams for plot progression and story
points, that helps the writer in controlling and bal-
ancing the tension within the story development. The
connections fleshed out are useful to connect the sev-
eral professionals of the production, while leaving un-
explored the possibilities of addressing the more mo-
tivational features of the drama.
4 THE VISUALIZATION OF
DRAMATIC FACTS
The features of the problem that the visualization sys-
tem takes as input, are:
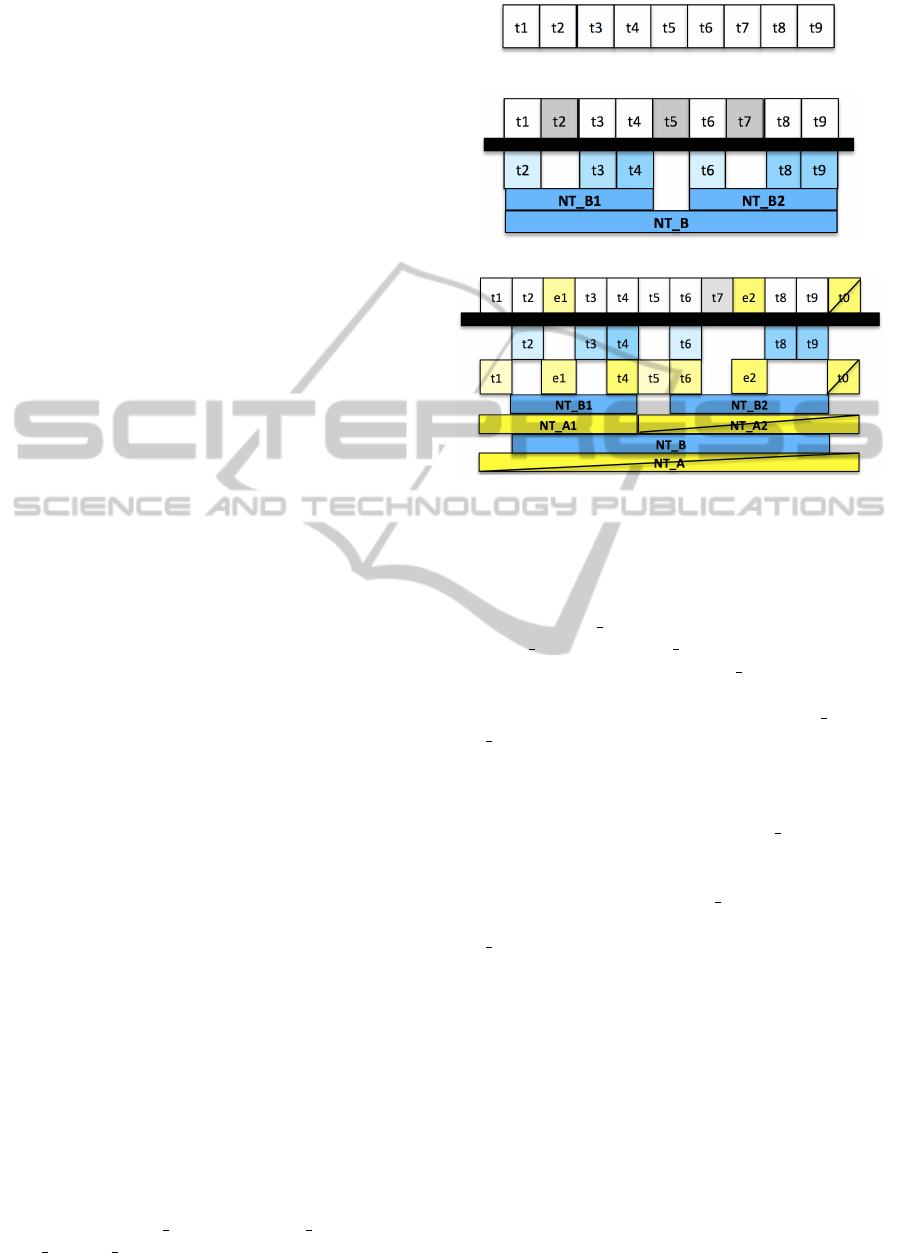
• a sequence of elements, called terminal symbols,
with the precedence relation over the elements
(see Figure 1(a));
• a number of hierarchies, based on some domi-
nance relation, such that some leaves span ele-
ments of the sequence, as exemplified by Figure
1(b), with only one hierarchy, and Figure 1(c),
with two hierarchies;
• a dimension of the possible role differences for
the hierarchy elements.
These individuals and relations are annotated
manually by the scholar, the enthusiast, or the student
through a graphic interface (Lombardo and Pizzo,
2014). The internal encoding is a computational on-
tology, that is also able to perform automatic reason-
ing about the classification of elements and the ap-
praisal of emotions by the characters.
Figure 1 provides a generic layout, with differ-
ent meanings that can be assigned to the visual el-
ements, depending on the type of hierarchy visual-
ized. Since multiple hierarchies can span the same
portion of the sequence and that the hierarchies op-
erate concurrently, the visualization will address sin-
gle dominance relationships, that can be represented
interspersed. So, NT B dominates NT B1 followed
by NT B2; NT B1, in turn, dominates t2, t3 and t4,
(a)
(b)
(c)
Figure 1: What to visualize: (a) sequence of elements;
(b) hierarchy spanning a sequence (c) multiple hierarchies
spanning a sequence.
in this order; NT B2 dominates t6, t8, t9, in this or-
der. NT A dominates NT A1 (which dominates t1,
e1, and t4, in this order) and NT A2 (which domi-
nates t5, t6, e2, and t0, in this order). Notice that e1
and e2 are extra elements predicted by the NT A1 and
NT A2, respectively), that are not present in the orig-
inal sequence. For example, states of the plans are
projected onto the sequence. t7 is a sequence element
with no hierarchy item that spans it (so, it is grey in
the visual design). t0, predicted by NT A2, does not
occur in the sequence, but, differently from the extra
elements should be present on its own; the lack of this
sequence element causes the NT A2 hierarchy item to
be not completely derived, and this is propagated onto
NT
A too. For example, this happens with a subplan
failing or an action missing, which causes the failure
of all the ancestor plans.
The visualization algorithmic schema proceeds
bottom–up from the sequence up to the high levels
of the hierarchies: after the extraction of the prece-
dence (sequence) and dominance (hierarchy) relations
from the data sets, we compute the original sequence
positions on a line; this horizontal line accounts for
the elements of the sequence. Then, we extract the
spanning relations of hierarchy nodes onto sequence
elements and, for the leaves, the exact matches; for
each match, we compute the possible augmentations
of the sequence with null elements (that are predicted
TheVisualizationofDramaHierarchies
167

in the hierarchy but are not present in the sequence,
for various reasons, see above). Finally, we compute
the positions of the elements in the hierarchies, real-
izing the correct alignments, given span and matches,
and assign a different color to items in the hierarchy,
given some distinctive role in visualization. The ele-
ments of the hierarchies are inserted onto horizontal
layers that are superimposed one on top of another.
The characters’ intentions motivate the incidents
occurring in the sequence. These are represented by
hierarchical plans arranged on trees; plans that com-
mit to short–term goals are components (i.e., children
in tree terminology) of plans that commit to longer–
term goals. The visualization of the characters’ inten-
tions in a drama is of great importance for scholars
and professionals, and is one of the most important
differences between drama analysis and literary crit-
icism. The visualization module addresses the rep-
resentation of multiple trees of characters’ intentions
(or plans). Figure 2 shows the visualization of the
nunnery scene of Hamlet. In this case, the colors
identify the character who intend the plans visualized
in the schema. As we can see, though four agents
are involved in the nunnery scene (Hamlet, Ophelia,
Polonius, Claudius), only Hamlet and Ophelia intend
plans, that is are engines of the drama.
The timeline of incidents, at the top of the figure,
consists of actual incidents (in green), states projected
from plans (in red), null incidents (in grey, green text)
null states (in grey, white text). The latter two are pro-
jected from plans that failed (see the barred rectangles
below in the figure).
Each plan is visualized as a horizontal rectan-
gle, with actions, subplans and (precondition or ef-
fect) states as daughters; each subplan is aligned with
the plan rewrites it, until the basic actions and states
aligned with subelements in the sequence. Domi-
nance relations are represented by different layers.
Plans closer to the sequence consist of an action bor-
dered by precondition and effect states, respectively;
plans higher in the hierarchy consists of a sequence
of subplans bordered again by precondition and ef-
fect states. All actions and states are mapped onto the
timeline (dotted lines in the figure). Each incident or
state is represented by a vertical box; boxes filled with
white color and barred diagonally indicates elements
that have not been realized in the timeline, thus the
plan failed.
These representations have been designed of large
sizes for printing and contain large text for visualiza-
tion in most cases. Some space can be optimized to
visualize some more global features of the drama.
5 EFFECTIVENESS OF THE
VISUALIZATION
Now we address the use of the visualization in an ex-
perience of teaching drama to students. In the last
decades, the focus of drama courses has switched
from literary to structural and actional qualities. This
means that the text is more and more intended both
as an incident design (either on stage or on screen)
and as a network of relations over characters’ inten-
tions. For example, McKee (McKee, 1997) guides the
author through the scene splitting into beats accord-
ing to the characters’ goals and value changes. This
leads to a larger use of visualization systems to clearly
stress the structural elements in the dramatic text, and
to map the connection with the performance, i.e., to
show the continuity between event design and event
performance.
Our visualization helps the class to understand
how the text of the dramatic medium is bound to
the character’s deliberation, and thus how to read the
characters’ behaviors. While characters’ behavior
has driven some visualizations in terms of tracking the
existence (the lifespan) of the agent within the flow
of the story (e.g. (Tanahashi and Ma, 2012) and (Liu
et al., 2013)), in our visualization this existence is for-
mally described as a cognitive process (i.e. plans) and
is therefore rooted on a formal approach to the spe-
cific elements of the drama. For example, the more
successful the mappings, the more the narrative text
of the dramatic medium is bound to characters’ delib-
eration (i.e. the performance is consistent with the
play). Nevertheless, a character’s plan can also be
used to trace the story flow of the single character in
the plot. In fact, if we collapse all the plans and sub-
plans of a single character on one line, we can map
her/his evolution within the drama and his interlink
with the others, in terms that are consistent with (Liu
et al., 2013).
The visualization illustrated so far has proven ef-
fective in visualizing three phenomena that are fre-
quently addressed by drama scholars in research and
teaching.
In drama, it is important that the character’s plans
show some consistency with the incidents that occur
in the sequence of events. This is the fundamental
feature that gives to the audience the perception of
a logical sequencing of action, thus helps to create
the believability of the story in terms of consistent
list of incidents within the units. In our visualiza-
tion, the timeline is grounded on the perceived be-
haviors of the agents involved. In other words, it
is graphically clear that all the states (red) and ac-
tions (green) in the timeline are connected with the
IVAPP2015-InternationalConferenceonInformationVisualizationTheoryandApplications
168
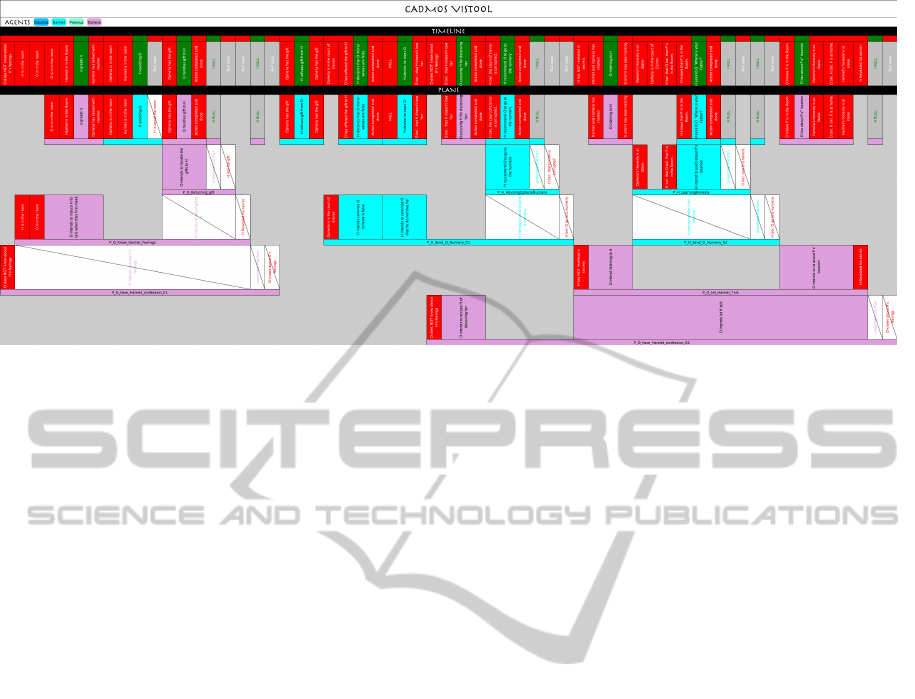
Figure 2: Screenshot of the visualization - excerpt of Hamlet “nunnery” scene.
elements on the character’s plan; i.e. the list of in-
cidents in the plot are grounded onto some delibera-
tive processes. The visualization attribute at Ophelia
the higher level of plans, thus showing that she holds
the overarching goal in the scene. Opposite, Ham-
let hold a lower level of plans thus showing that he
is mainly reactive to a situation designed by others.
Characters’ deliberations are complex processes and
vary according the drama. In our visualization, the
“nunnery” scene shows clearly that the timeline con-
tains a relevant number of states compared to actions;
in fact, the scene is described mainly by the precon-
ditions and effects of character’s plans rather then by
the actions performed. Thus the scene can be consid-
ered charged with a high level of psychology because,
in this case, the meaning of the actions resided mainly
into the cognitive state of the characters, and therefore
on the meaning that the audience can attribute to them
(the process known as interpretation). More states are
need to describe a drama, more the drama is based on
the psychology of the characters rather that on their
actions.
Normally the units listed in the timeline (in the
timeline’s area below the black stripe marked as
“timeline”) are the results of the synchronous occur-
rence of two agents’ plans (such as the ones by Ham-
let and Ophelia in the “nunnery” scene). We adopt a
visualization that shows a layer of parallel plans that
map onto the same chunk of the timeline. When the
two plans have a similar goal, they both aim at the
same effect: thus, they map the same final state onto
the timeline, and are described as a shared plan. Our
visualization can also pile up different plans with op-
posite goals. When this occurs, very often it means
that only one plan will achieve its goal and thus only
one state is mapped onto the timeline. In Figure 2, we
see that plans (in the plan’s area below the black stripe
marked as “plan”) of the two characters (marked with
a color code on the top left) span the same chunk
of timeline. Some of the states planned as effects
(right side of the plans) are achieved, thus are mapped
onto the timeline: this is graphically shown as two
equivalent boxes in the plans area and onto timeline
(the corresponding state holds). Others states are not
achieved, thus are not mapped: this is graphically
shown as barred box in the plan area and a “null” box
onto the timeline (state does not hold). When the vi-
sualization shows this pattern, it means that there is
a conflict between the characters. Hence the visual-
ization provides a clear image of the orchestration of
conflicts and their execution.
In drama, character’s plan failure is normally eval-
uated through an emotional appraisal and is the rea-
son for the character’s re–deliberation. For example,
in the “nunnery” scene, the failure of the Hamlet’s
plan is a clear indication of the emotional characters’
change. This is normally one of the key figures into
the emotional engagement of the audience. The se-
quence of plans in Figure 2 represents the character
changes as a sequence of characters’ planning and
re–planning, thus stress the emotional charge of the
drama. This is particular evident in the case of Ophe-
lia: as we have seen, she has the higher level of plans
but this is composed by two main plans (bottom of the
visualization) separated by a gap filled by a Hamlet’s
plan. This shows that Ophelia has to execute some
sort of re–planning, given the failure of the first (bot-
tom left), so to regain the lead of the scene with an-
other overarching plan (bottom right). Moreover, all
along the scene we see that there is a large number
of failed plans (shown also as null cells into the time-
line); hence, the visualization accounts for the com-
plexity of the interchange among characters (more
failed plans equals to more complex interchange).
TheVisualizationofDramaHierarchies
169

Other significant features should be added to the
visualization, namely the Dramatic Arc and a dy-
namic/interactive construction of the mapping. This
is left for future work.
6 CONCLUSION
We have proposed a visual design and algorithmic
schema for the visualization of drama hierarchies.
In particular, we have addressed the visualization of
multiple hierarchies spanning the incident sequence,
with multiplicity expressed through different plan hi-
erarchies that span different portions of the timeline
because of failures and replanning activity, different
characters’ hierarchies, with individual plans in con-
flict that span the same portion of the timeline. Fi-
nally, we have discussed the types of phenomena that
are pointed out by the visualization system. The sys-
tem relies on an ontology of drama and builds upon
the unrestricted manual annotation provided by media
students. It was tested on the analysis and exposition
of the case of a classic drama and a relevant scene
from Hamlet.
Our approach is more analytic than existing ones
with respect to addressing the basic constituents of
a story; for example, some of the visualizations pro-
posed elsewhere could be derived from our visual-
ization as well as be embedded in other methods.
Though tested to the research and didactics of drama
structure, our system can be applied to the analysis of
other types of stories that are not drama or being ap-
plied to drama production for checking the status of
screenwriting.
REFERENCES
Aigner, W., Miksch, S., Schumann, H., and Tominski, C.
(2011). Visualization of Time-Oriented Data. Human-
Computer Interaction Series. Springer.
Card, S. K., Suh, B., Pendleton, B., Heer, J., and Bodnar,
J. W. (2006). Timetree: Exploring time changing hi-
erarchies. In IEEE Visual Analytics Science & Tech-
nology (VAST), pages 3–10.
Carlson, M. (1984). Theories of the theatre : a histori-
cal and critical survey from the Greeks to the present.
Cornell University Press, Ithaca.
Chen, T., Lu, A., and Hu, S.-M. (2012). Visual storylines:
Semantic visualization of movie sequence. Computers
& Graphics, 36(4):241 – 249. Applications of Geom-
etry Processing.
Egri, L. (1946). The Art of Dramatic Writing. Simon and
Schuster, New York.
Esslin, M. (1988 (1987)). The Field of Drama. Methuen,
London.
Freytag, G. (2004). Technique of the Drama: An Exposition
of Dramatic Composition and Art. University Press of
the Pacific.
Graham, M. and Kennedy, J. B. (2010). A survey of
multiple tree visualisation. Information Visualization,
9(4):235–252.
Hatcher, J. (1996). The Art and Craft of Playwriting. Story
Press, Cincinnati, Ohio.
Heer, J., Bostock, M., and Ogievetsky, V. (2010). A tour
through the visualization zoo. Queue, 8(5):20:20–
20:30.
Lavandier, Y. (1994). La dramaturgie. Le clown et l’enfant,
Cergy.
Liu, S., Cui, W., Wu, Y., and Liu, M. (2014). A survey on
information visualization: recent advances and chal-
lenges. The Visual Computer, pages 1–21.
Liu, S., Wu, Y., Wei, E., Liu, M., and Liu, Y. (2013).
Storyflow: Tracking the evolution of stories. IEEE
Transactions on Visualization and Computer Graph-
ics, 19(12):2436–2445.
Lombardo, V. and Pizzo, A. (2013). Ontologies for the
metadata annotation of stories. In Digital Heritage
International Congress (DigitalHeritage), 2013, vol-
ume 2, pages 153–160, Marseille, France. ACM,
IEEE.
Lombardo, V. and Pizzo, A. (2014). Multimedia tool suite
for the visualization of drama heritage metadata. Mul-
timedia Tools and Applications, Published Online 27
june 2014:1–32.
Mamet, D. (1998). Three Uses of the Knife: On the Nature
and Purpose of Drama. The Columbia Lectures on
American Culture. Columbia University Press.
McKee, R. (1997). Story. Harper Collins, New York.
Rao, A. and Georgeff, M. (1995). BDI agents: From theory
to practice. In Proceedings of the First International
Conference on Multi-Agent Systems (ICMAS’95).
Rimmon-Kenan, S. (1983). Narrative Fiction: Contempo-
rary Poetics. Routledge.
Ryngaert, J. and Bergez, D. (2008). Introduction
`
a l’analyse
du th
´
e
ˆ
atre. Collection Cursus. S
´
erie Litt
´
erature. Ar-
mand Colin.
Schulz, H. (2011). Treevis. net: A tree visualization ref-
erence. Computer Graphics and Applications, IEEE,
31(6):11–15.
Spencer, S. (2002). The Playwright’s Guidebook: An In-
sightful Primer on the Art of Dramatic Writing. Faber
& Faber.
Tanahashi, Y. and Ma, K.-L. (2012). Design considera-
tions for optimizing storyline visualizations. IEEE
Transactions on Visualization and Computer Graph-
ics, 18(12):2679–2688.
IVAPP2015-InternationalConferenceonInformationVisualizationTheoryandApplications
170
