AColDPS
Robust and Unsupervised Automatic Color Document Processing System
Louisa Kessi
1,2
, Frank Lebourgeois
1,2,
Christophe Garcia
1,2
and Jean Duong
1.2
1
Université de Lyon, CNRS, Lyon, France
2
INSA-Lyon, LIRIS, UMR5205, F-69621, Lyon, France
Keywords: Document Image Analysis, Color Processing, Business Document, Mathematical Morphology, Color
Morphology.
Abstract: This paper presents the first fully automatic color analysis system suited for business documents. Our pixel-
based approach uses mainly color morphology and does not require any training, manual assistance, prior
knowledge or model. We developed a robust color segmentation system adapted for invoices and forms
with significant color complexity and dithered background. The system achieves several operations to
segment automatically color images, separate text from noise and graphics and provides color information
about text color. The contribution of our work is Tree-fold. Firstly, it is the usage of color morphology to
simultaneously segment both text and inverted text. Our system processes inverted and non-inverted text
automatically using conditional color dilation and erosion, even in cases where there are overlaps between
the two. Secondly, it is the extraction of geodesic measures using morphological convolution in order to
separate text, noise and graphical elements. Thirdly, we develop a method to disconnect characters touching
or overlapping graphical elements. Our system can separate characters that touch straight lines, split
overlapped characters with different colors and separate characters from graphics if they have different
colors. A color analysis stage automatically calculates the number of character colors. The proposed system
is generic enough to process a wide range of images of digitized business documents from different origins.
It outperforms the classical approach that uses binarization of greyscale images.
1 INTRODUCTION
Color document processing is an active research area
with significant applications. In recent years, there
has been an increasing need for systems which are
able to convert pre-printed color documents into
digital format automatically. Most of the time, the
color image is converted into a greyscale image.
However, the performance decreases when the
segmentation fails. Nowadays, companies have to
deal with huge volumes of administrative color
documents such as invoices, forms, and letters and
so on. Indeed, some companies can have to cope
with dithering documents, complex color
background and linear color variations, which
amounts to not knowing if text is darker or lighter
compared to the background, highlighting regions,
corrective red overload on black text and not
uniform color text/graphics overlapping. Indeed,
some dithered documents may not lead to a correct
automatic analysis. Smoothing most often permits to
reduce dithering significantly but can also seriously
damage the text. Therefore, the color information is
significant. Then, a color-based segmentation could
improve the process.
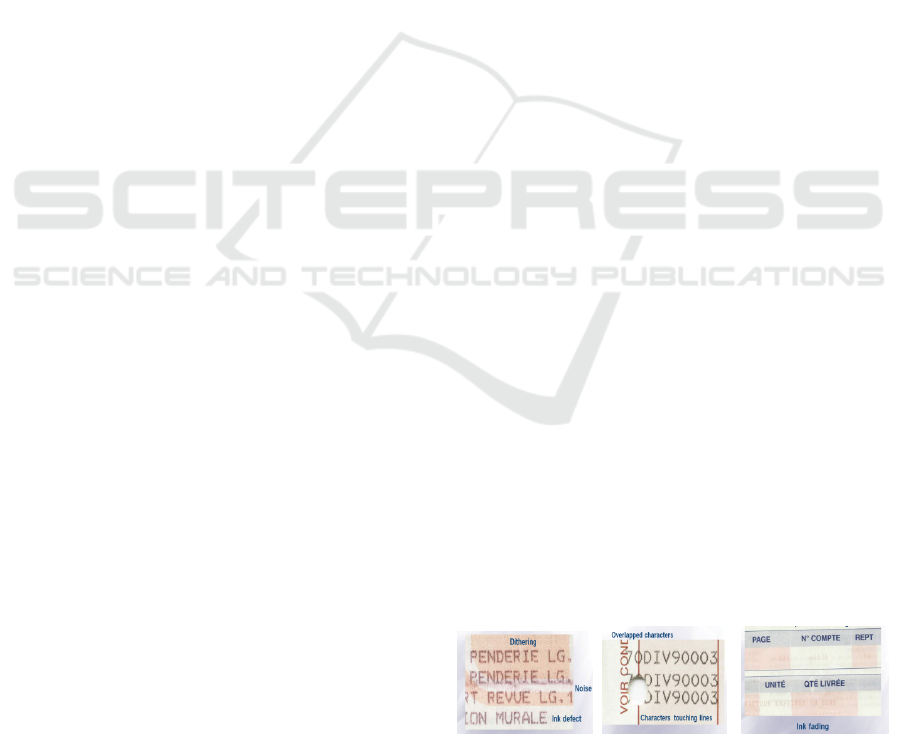
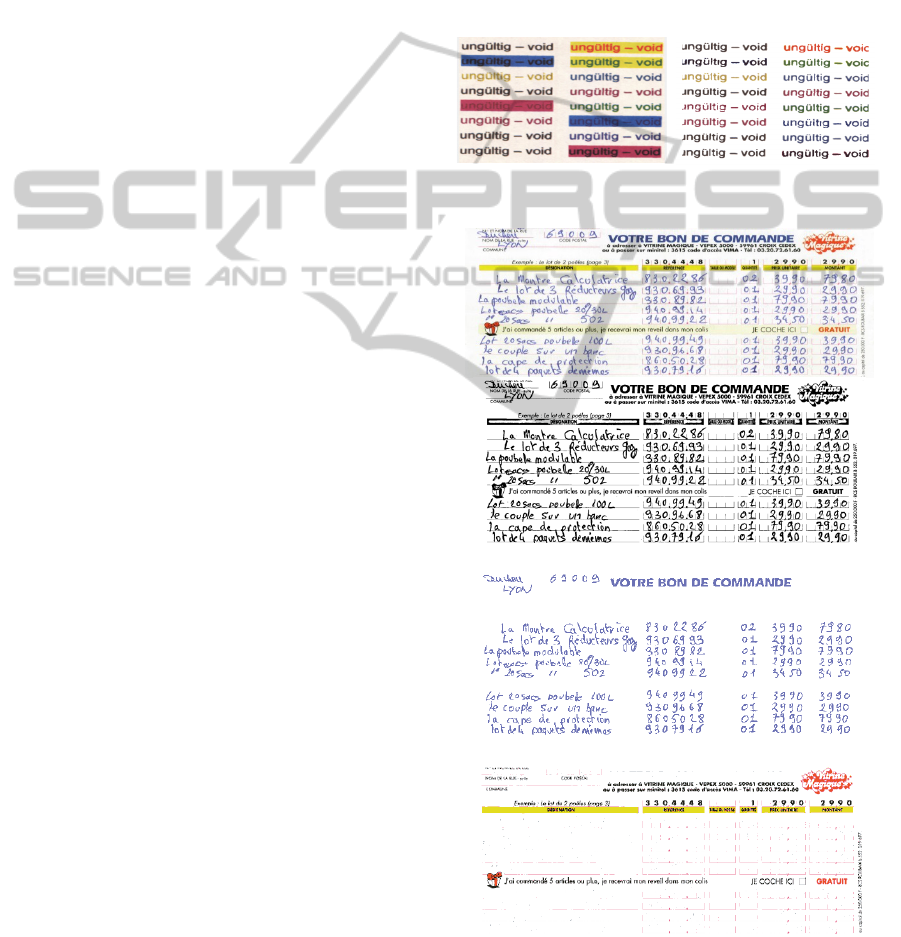
Figure 1: Issues some examples of several difficulties
presented in color business document.
1.1 Related Work
As far as the authors know, there are only few works
about the use of the color for document analysis.
The only referenced work for color documents come
from (Bottou, 2001) for the DjVu compression. In
the work of
(Karatzas et al., 2007), (Y. Peng et al.,
2007) and
(Jung et al., 2004) localization of colored
text is described. OCR of colored characters is
174
Kessi L., Lebourgeois F., Garcia C. and Duong J..
AColDPS - Robust and Unsupervised Automatic Color Document Processing System.
DOI: 10.5220/0005315801740185
In Proceedings of the 10th International Conference on Computer Vision Theory and Applications (VISAPP-2015), pages 174-185
ISBN: 978-989-758-089-5
Copyright
c
2015 SCITEPRESS (Science and Technology Publications, Lda.)
presented in (Badekas et al., 2006). Most of the
research on color documents considers the
classification as an essential pre-processing step to
any analysis. This facilitates the extraction of the
connected components by a simple growing region.
The work focuses mostly on-pixel classification
approaches to reduce the number of colors found.
The pixel classification consists of assigning each
pixel of the image to the color class layer according
to its colorimetric appearance. In this context,
(Ouji et al., 2011) introduce a new pseudo-saturation
measure to separate color layers and monochrome
layer. The author segments text colors and
background by selecting maxima in the hue
histogram. However, this global analysis of the
image cannot make the difference between text
colors and background color. Moreover it works
only for cleaned images. This method is not
operating for business document images.
(Ait Younes et al., 2005) describe the color thanks to
fuzzy sets in order to classify images based on
dominant colors. However, they dealing with a fixed
number of colors which is not optimized for
documents containing just a few colors.(Carel et al.,
2013) propose a hierarchical clustering based
approach to extract dominant color masks of
administrative documents. Moreover, this approach
was evaluated on a relatively small base. Therefore,
they need to provide more extensive quantitative
analysis of the process both in terms of its
effectiveness and computational requirements.
On the other hand, this method requires user
interaction for setting threshold parameters order to
decide what a dominant color is or not. This
approach works only for a specific category of
images and is very sensitive for noises. This paper
addresses the most challenging problem of color
morphology. We use this theory to develop the first
robust unsupervised Automatic Color Document
Processing System pixel-based approach.
1.2 Motivation
In this paper, we present an automatic system which
segments color characters from business documents
and especially from forms and invoices. Our
objective is achieved if all color characters are
correctly segmented from the background, using an
automatic procedure without any information
provided by the user. Contrary to previous works,
we develop the first full data-driven pixel-based
approach which doesn't need any priori information
such as the number of text colors or any training or
manual assistance. The paper is organized as
follows. Section 2 presents the color morphology
fundamentals and in Section 3 there is a detailed
description of our approach. Results are discussed in
Section 4. In Section 5 conclusions are drawn.
2 COLOR MATHEMATICAL
MORPHOLOGY
The theory of Mathematical Morphology (Serra,
1982) consists of quantitatively describing the
geometric structures present in the image, and offers
a wide range of tools (Soille, 2004). Motivated by
the recent researches on extension of morphological
operations to color images(Chanussot et al. 1998),
we have decided to employ color mathematical
morphology tools to achieve color document images
segmentation in a flexible and fast manner.
Our system uses the morphological convolution (1)
and the lexicographic order to encode color vectors
into a scalar.The morphological convolution
transforms a binary image I into an image I
G
by
taking the largest or smallest value of I + V on the
domain of definition Dv of a neighborhood V.
I
G
(x) =Min or Max { I(x+k)+V(k) } kD
V
xX
(1)
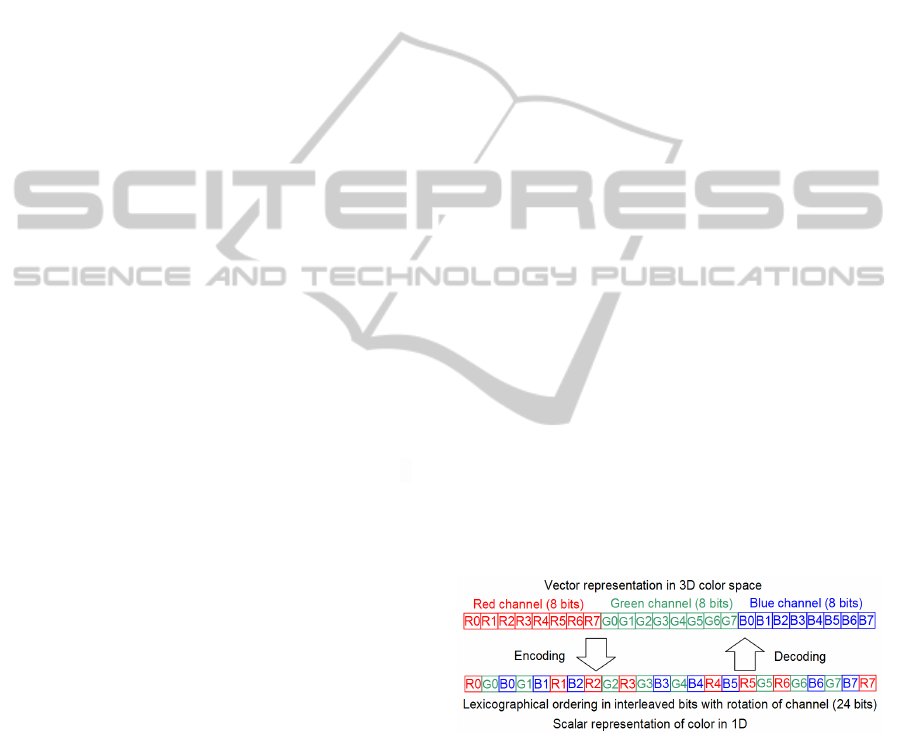
By using the interleaved bits, color morphology in 3
dimensional spaces can be substituted efficiently by
a scalar classical morphology (Chanussot et al.1998)
popularized by (Aptoula et al., 2009) show that the
scalar morphology by using the encoding scheme
illustrated in Figure 2 avoids pseudo colors
apparition. We reduce the dissymmetry between
color components by rotating the sequence of RGB.
Figure 2: Color coding in scalar by using interleaved bit
and rotation of the sequence of RGB.
3 OUR PROPOSITION
Figure 3 illustrates the main steps of the proposed
system. Each step will be detailed in the next
sections following the organisation of the paper.
AColDPS-RobustandUnsupervisedAutomaticColorDocumentProcessingSystem
175
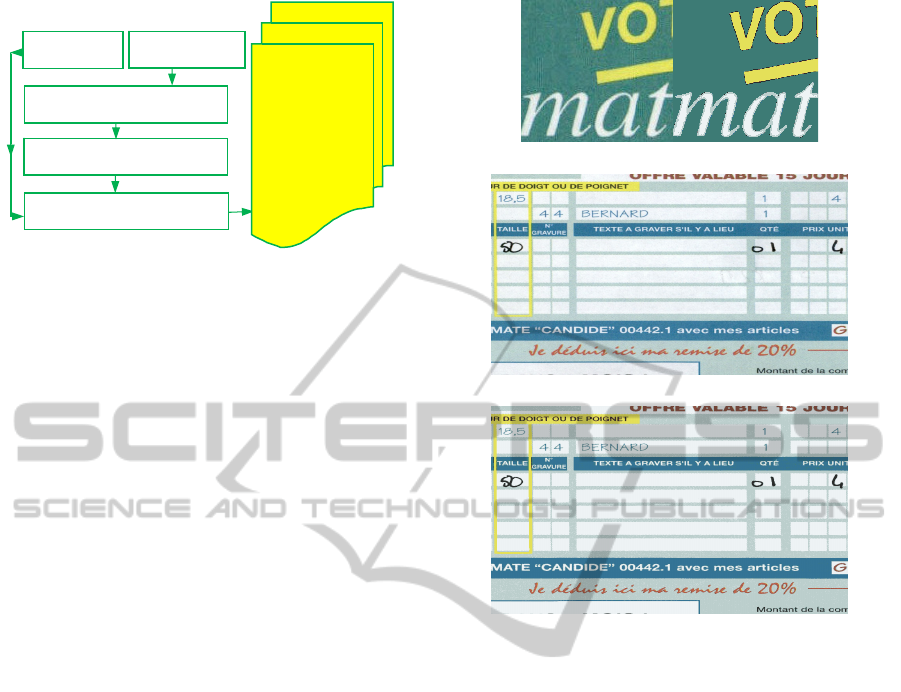
Figure 3: illustrates the overall scheme of AColDPS.
3.1 Color Clustering
The spatial MeanShift originally introduced by
(Comaniciu et al., 2002) demonstrates that a density-
based clustering is efficient for color clustering and
reduces the complexity of the original MeanShift
algorithm by introducing the spatial coordinates into
the color vector. Applied to color documents, the
spatial Mean Shift requires a complex fusion step to
restore the continuity of the characters. The Fast
Integral MeanShift proposed by (Lebourgeois et al.,
2013), reduces the complexity of the original
MeanShift from O(N²) to O(N). The global
MeanShift can be used now on large datasets and
especially on color images of documents in high
resolution. AColDPS uses the Fast Integral
MeanShift to reduce the number of colors of an
image of 2492 x 3558 in 300 dpi to a very reduced
number of colors in less than 3 sec. This clustering is
robust to large change of the colors of the characters.
3.2 Segmentation of Thin Colored
Objects by using Color Morphology
This step consists to generate a binary image of thin
colored objects. It differs from the classical
binarization of the luminance by an adaptive
thresholding approach. For images which use colors
having almost the same luminance, the thresholding
of the luminance fails. We use the mathematical
morphology because it can extract objects according
to geometrical measures. Thin objects can be
segmented by a classical Top-Hat transform. The
closing of an image I is the dilation followed by an
erosion of the image with the same structural
element (2). It enlarges the lighter foreground and
removes the thin objects which are darker than the
background (figure 5c). The radius of the structural
element B measures the thickness of the object to
remove. The Black-Top-Hat (3) of an image I
a) Color transition detected by the Mean Shift
b) Original Image I 73727 different colors
c) Fast Integral MeanShift image with 22colors
Figure 4: Fast Integral Mean Shift application.
consists of make the difference between the closing
image and the original image I, in order to highlight
all thin colored objects which are darker than the
background in luminance (figure 5d).
If we assume that all characters use colors which
are darker than the background, in luminance, a
Black-Top-Hat is efficient to extract all colored
characters from any colored background. By using
the interleaved bits order explained in
(Chanussot et al., 1998) the multidimensional
morphology in (RGB) color space can be substituted
efficiently by a scalar classical morphology.
Closing(I) = Erode
B
(Dilate
B
(I))
(2)
Black-Top-Hat(I) = Closing(I)-I
(3)
To extract all colored characters even with fading
ink, we apply an adaptive thresholding like Sauvola
thresholding. In our case, we use the variable
adaptive thresholding windows (Gaceb et al., 2013)
which compute the best window size of the Sauvola
thresholding for each pixel by using integral images
(figure 5e).
Color clustering
Color Morphology
Text graphic and noise
separation
Separate text touching graphics
Colored texts segmentation
Several images
containing only
characters having
the same color
without noise and
overlapped
graphics to send
to the OCR
VISAPP2015-InternationalConferenceonComputerVisionTheoryandApplications
176
a) Original Image I
b) Dilation(I)
c) Closing(I) = Erode(Dilate(I))
d) Black-Top-Hat(I) = Closing(I)-I
e) Adaptive Threshold of the Black-Top-Hat(I) by (Gaceb, 2013)
Figure 5: Black-Top-Hat Color Morphology operation.
The difference between our thresholding and the
classical Sauvola with fixed window size is
noticeable on dithered images or images having
noise and large objects. However, Sauvola
thresholding can be used without significant loss of
performance in the case of the segmentation of the
Black-Top-Hat images because the size of objects
cannot exceed twice the size of the structural
elements. In this case the variable window size of
the Sauvola thresholding (Gaceb et al., 2013)
manages to reduce noise from the images.
In the domain of business documents, we cannot
assume that text is darker than the background in
luminance. Invoices and forms present inverted text
which is brighter than the background. This inverted
text is important for the recognition of business
documents because it generally represents the
labelling of a column or a row in a table. To extract
inverted text, we must apply a White-Top-Hat which
is the dual operation of the Black-Top-Hat
transform. The opening of the image (4) deletes thin
bright objects from darker background. The
difference between the original image and the
opening image (5) highlights the thin objects
brighter than the background.
Opening(I) = Dilate
B
(Erode
B
(I)) (4)
White-Top-Hat(I) = I-Opening (I) (5)
However, we cannot combine the Black-Top-Hat
and the White-Top-Hat results at pixel-level. The
duality of these two morphological operations makes
impossible the separation between inverted and non-
inverted text. In the Black-Top-Hat, inverted text
becomes white over black background and in White-
Top-Hat it appears black over white background.
There is no simple binary operation which separate
inverted and not inverted text. The local dominant
colors bring a solution to segment simultaneously
inverted and non-inverted text by morphology. This
operation allows to measure the color of the
background whether the text is inverted or not. The
precision of the dominant color image is not
important. In order to make a precise adjustment to
the original image we dilate or erode the dominant
color image with the original image. Among all
possible existing methods, to compute the dominant
color we have chosen the median filtering with a
large radius since its complexity has been seriously
reduced and can be calculated in constant time
(Perreault, 2007) whatever the size of the window.
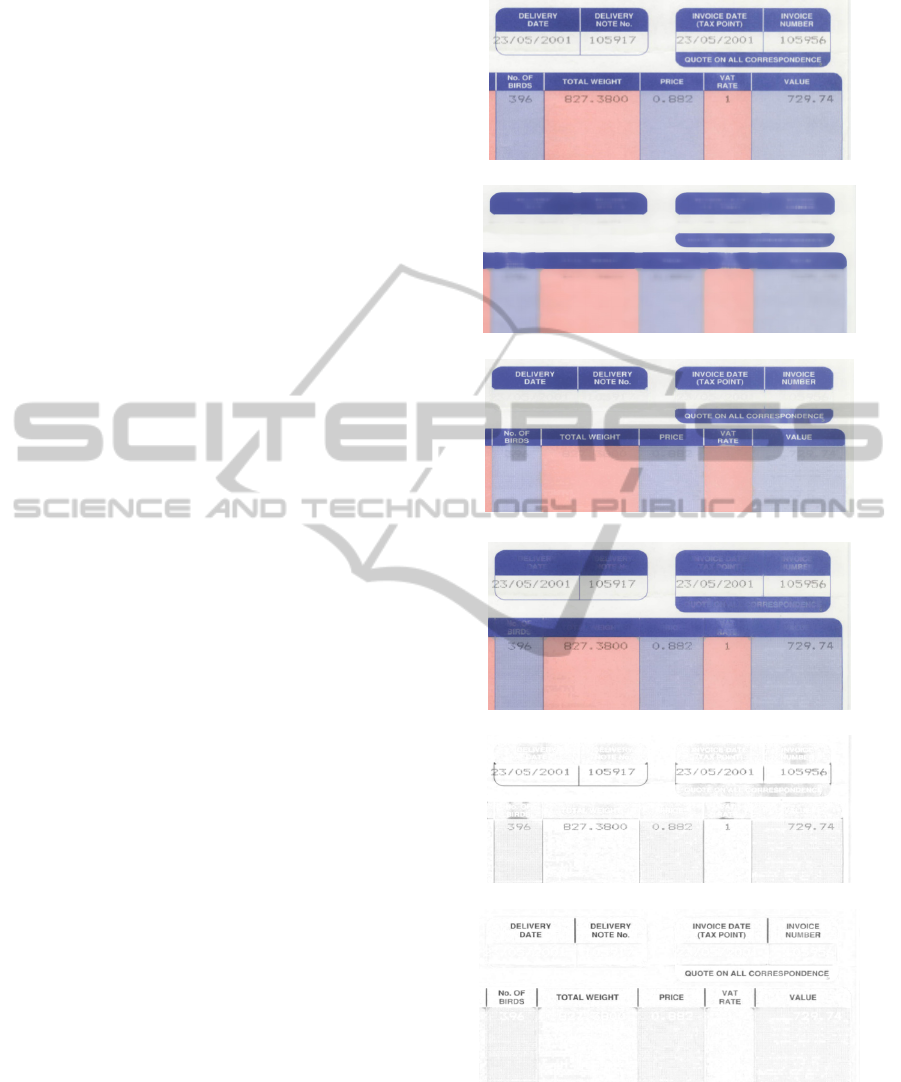
Figure 6b shows the result of the median with radius
15 or a window size of 30 on image in figure 6a. The
dominant color image is a coarse representation
which we refine by applying a conditional erosion
and dilation with the original image.
In classical morphology theory for binary image,
the conditional dilation CD
B
M
(X) of a subset X by a
structural element B conditioned to a mask M is
equal to the intersection between the Dilated of X
with the binary mask M (6). Accordingly, the
conditional erosion CE
B
M
(X) of a subset X by a
structural element B conditioned to a mask M is
equal to the intersection between the complementary
of the erosion of X with the binary mask M (5).
CD
B
M
(X) = Dilate (X) M
(6)
CE
B
M
(X) = (Erode (X))
c
M
(7)
Applied to greyscale images or to scalar color
images by using interleaved bits of the three color
channels, the conditional dilation CD
B
M
(X) of a
scalar image X under condition of a scalar image M
is equal to the minimum of the dilation of X and the
image M (8). By symmetry, the conditional erosion
CE
B
M
(X) is obtained by the maximum between M
and the erosion of X (9).
CD
B
M
(X) =min( Dilate (X) , M) (8)
AColDPS-RobustandUnsupervisedAutomaticColorDocumentProcessingSystem
177
CE
B
M
(X) =max( Erode (X) , M) (9)
We detect and segment separately both inverted and
non-inverted text by using the conditional dilation
(11) and the conditional erosion of the dominant
color image (12) restricted by the original image I,
respectively.
DominantLocalColor(I) Median(I)
(10)
CD
B
I
(Median(I))=min(Dilate(Median(I)) , I)
(11)
CE
B
I
(Median(I))=max(Erode(Median(I)) ,I) (12)
CE
B
I
(Median(I)) erases all not inverted texts which
are darker in luminance than the background (Figure
6c). Accordingly, CD
B
I
(Median(I)) deletes all
inverted texts which are brighter than the
background (figure 6d). To extract the not inverted
text, we define Positive(I) by taking the difference
between CE
B
I
(Median (I)) and the original image I
(10).Accordingly, to segment inverted texts, we
define Negative(I) by taking the difference between
the original image I and CD
B
I
(Median (I))(11).
Positive(I)= CE
B
I
(Median(I)) – I
(13)
Negative(I)=I - CD
B
I
(Median(I)) (14)
Figure 6e and figure 6f show the positive and the
negative parts of thin colored objects, respectively.
Both positive and negative images contain a strong
dithering of the background in the blue column
(Figure 6h). The final result is obtained by taking the
min of the adaptive thresholding of the positive and
the negative image (figure 6g). The radius of the
median in order to find the local dominant colors
depends on the size of the text to segment.
The window size of the median operator must be
larger than the maximum text height. For color
images with resolution of 300 dpi of resolution, the
maximal height of text does not exceed 25 pixels.
The size of the window for the median filtering must
be larger than this value. In order to have more
margin, we chose a window size larger than 30 or a
radius larger than 15.
Figure 8a and 8b show that AColDPS can
process successive inclusion of color frames without
heuristics. The dithering part of the blue column is
also segmented like all thin objects such as
characters and thin graphical objects. Invoices and
forms frequently use dithered background colors that
need cleaning. In the next step, we propose a
straightforward process to remove both large graphic
objects and noise without connected components
extraction by using morphological geodesic
operations.
a) Original image I
b) Median(I) filtering in constant time (perreault, 2007)
c) CE
B
I
(Median(I))=max(Erode(Median(I)) , I)
d) CE
B
I
(Median(I))=max(Erode(Median(I)) , I)
e)Positive(I)= CE
B
I
(Median(I))- I shows not inverted texts
f)I - CD
B
I
(Median(I)) shows inverted texts
Figure 6: The succession of operations to segment color
images containing inverted and not inverted texts (cont.).
VISAPP2015-InternationalConferenceonComputerVisionTheoryandApplications
178
g) Min(Threshold(Positive(I)),Threshold(Negative(I)))
h) Zoom to show the dithering effects in the blue column
Figure 6: The succession of operations to segment color
images containing inverted and not inverted texts.
3.3 Separation of Text from Graphics,
Image Noise and Dithered
Background
This step does not use any connected components
extraction or analysis. It is only based on
morphological convolution for geodesic measures
described in section 2 applied on the binary image
obtained by the previous step.
a) Despeckle
To save computational time, we apply a despeckle to
quickly remove noise and dithered background. We
apply a two pas distance transform in the 8-
connectivity neighbourhood of the binary image.
The maximal value of the distance transform is
reached along the medial axis (Chassery, 1991) and
measure the minimum geodesic distance from each
pixel to the contours of the object. The maximal
value inside each object measures the maximal
thickness of that object. To propagate the maximal
thickness value inside each object, we repeat until
the morphological convolution of dilation with a null
mask M0 is stable. All pixels inside each object will
take the same value equal to the maximal thickness
of that object. The despeckle consists to erase in one
pass, all objects having a maximal thickness of
ThicknessMin threshold. It is similar to threshold
the resulting image with a
ThicknessMin
threshold. Figure 7 shows a despeckle of document
figure 6 with
ThicknessMin=2.
Figure 7: Results of the Despeckle by morphology.
b) Separation between
Graphics/Text/Dithered Parts
The geodesic measure of width and height is not the
measure of the bounding box surrounding the object,
but the measure of the width and height inside the
object. The geodesic measures bring more pertinent
information than classical spatial measures.
Moreover, the noise removal based on geodesic
width and height has nothing to do with the
morphological despeckle described previously based
on the objects thickness. The Objects' thickness and
geodesic width and height are complementary
information for noise and dithered background
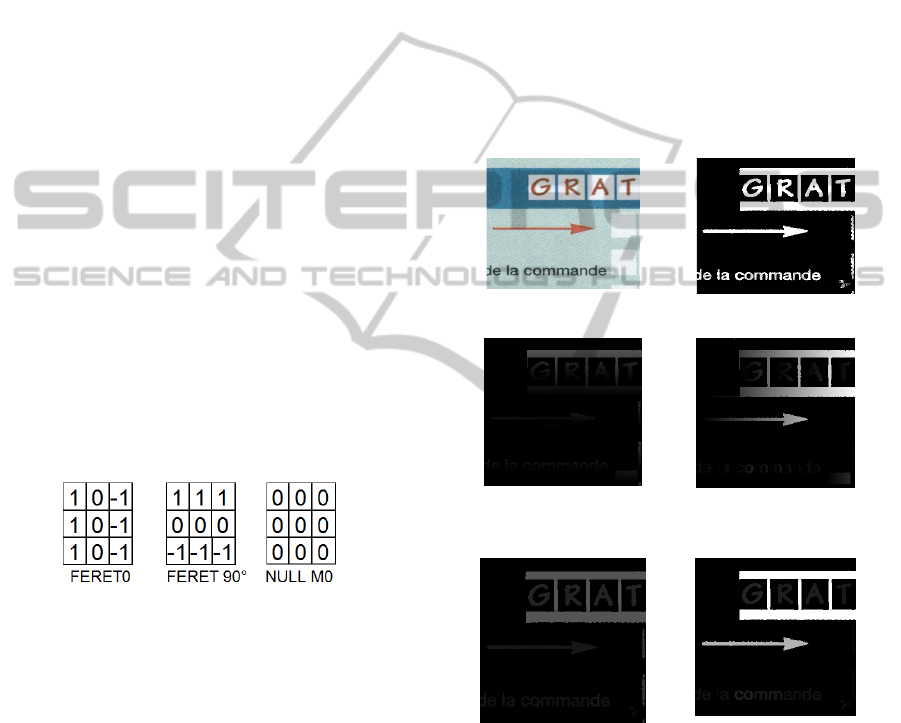
removal. Our separation is based on the geodesic
width and height of binary objects calculated by
morphological convolution. We repeat the
morphological convolution of dilation with the Feret
mask
FERET90 and FERET0 for 90° and 0°
direction on the binary image, respectively, until
there is no change. It provides two images
GeodesicHeight / GeodesicWidth with value 1 on
the bottom/left outermost points of each objects and
the geodesic width and height on the top/right
outermost points of each objects (figure 8c,8d),
respectively. To propagate the maximal geodesic
width and height values inside each object, we
repeat until the morphological convolution of
dilation with a null mask
NULL M0is stable.
All pixels inside each object contain the geodesic
width and height of the object (figure 8e, 8f). These
images will be useful for despeckle, noise and
dithered part removal, suppression of graphics and
AColDPS-RobustandUnsupervisedAutomaticColorDocumentProcessingSystem
179
the separation of characters connected to graphics
described in the next step.
To remove noises and speckles generated by the
dithered backgrounds, we shift pixel
(x,y) from the
binary image to the image
SpecklesImage if both
GeodesicHeight/ GeodesicWidth images have a
value strictly inferior to
HeightMin and WidthMin
pixels respectively. All objects from the binary
image having a geodesic height and width which do
not exceed
HeightMax and WidthMax
respectively, are shifted in the image TextsImage
because they have the size to be potentially
characters. All the other objects are classified into
the image
GraphicsImage if the geodesic width or
heights exceed
WidthMax or HeightMax,
respectively. They represent large objects that we
consider as graphics (Algorithm 1).
Algorithm 1: separation between graphics/text/dithering.
if ((GeodesicHeight(x, y)>0) &&
(GeodesicWidth(x,y)>0))
{
if ((GeodesicHeight(x, y)<HeightMin)&&
(GeodesicWidth(x, y) <WidthMin))
Shift pixel(x, y) in SpecklesImage
else
if ((GeodesicHeight(x, y)<=HeightMax)&&
(GeodesicWidth(x, y) <=WidthMax))
Shift pixel(x, y) in TextsImage
else
Shift pixel(x,y) in GraphicsImage
}
We choose to set HeightMin and WidthMin to the
value
3 in order to keep and thin characters like 'I' or
'1'. For printing documents, we set
WidthMax and
HeightMax to value 64 for 300dpi images, because
characters cannot exceed this size. For ligatured
manuscripts we set
WidthMax and HeightMax to
value 512 and 128 respectively, in order to shift
correctly handwritten words in the image
TextsImage.
We keep the graphical information into a binary
image for further analysis to localise frames and
detect tables in future work. Tables or frames
bordered by dot lines or dashed lines cannot be
separated from the text image because the geodesic
width or height are similar to the size of characters.
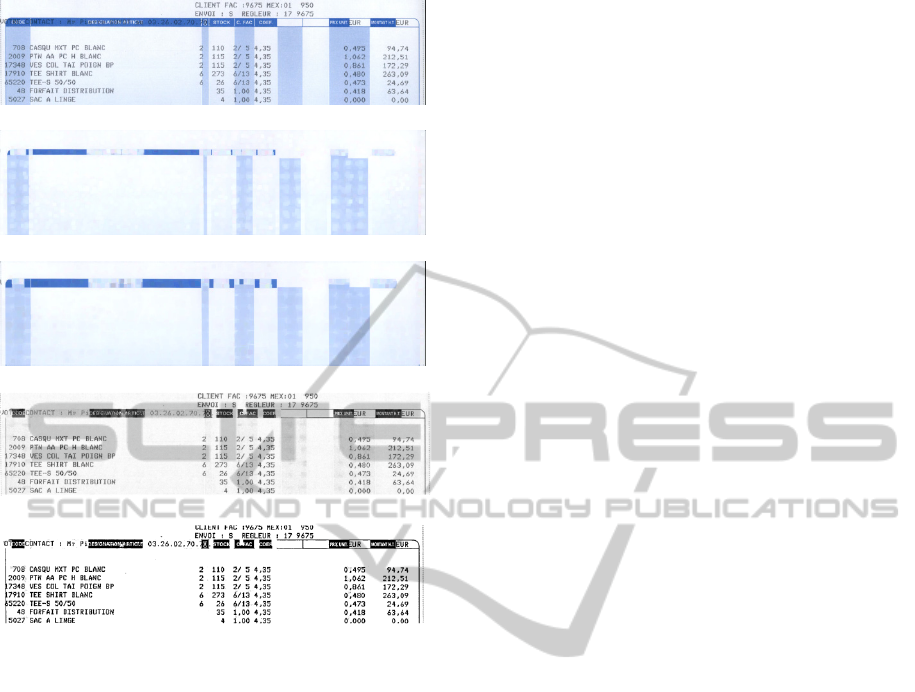
Figure 9 illustrates the separation between
speckles, text and graphics. Figure 9a shows the
difficulties of color printed invoices with complex
color background. Figure 9b shows the large amount
of speckles (noise and dots from dithering part)
deleted from the binary image. Figure 9c displays
the graphics elements and large objects. We notice
that small vertical lines from tables in columns are
not classified into graphics because their heights do
not exceed
HeightMax.
The horizontal dot line and other small
components from the graphical background are
classified to the image TextsImage instead of
GraphicsImage because their geodesic widths are
under the limit
WidthMax. These errors have no
consequences, because during the layout analysis,
these random elements from the image
TextsImage
will be rejected because they are not aligned enough
to build a text line.
a) Original image I b) binary mask obtained by the
color segmentation step
c) GeodesicHeight d) GeodesicWidth
Obtained by morphological convolution of dilation
withFERET0and FERET90
e) GeodesicHeight f) GeodesicWidth
After propagation of maximal values by morphological
convolution of dilation with
NULL M0 mask.
Figure 8: Results of the geodesic transform by
morphological convolution.
We design the system to be sure that all the
characters are correctly classified into the image
TextsImage. But for characters connected to the
graphical elements, these characters are found in the
GraphicsImage. The next step aims to separate
characters connected to graphics.
VISAPP2015-InternationalConferenceonComputerVisionTheoryandApplications
180
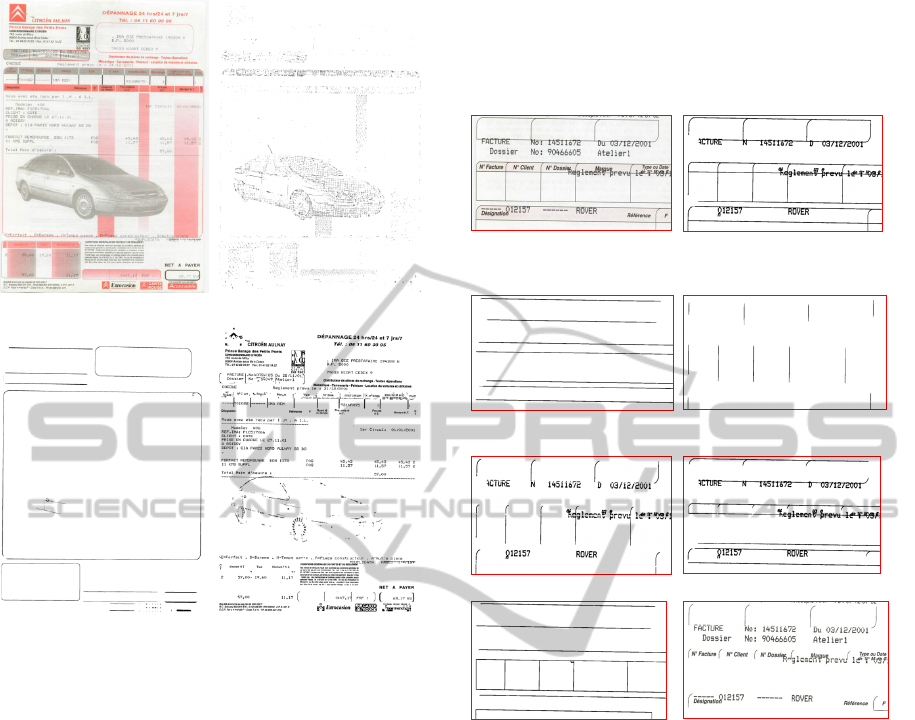
a) Original Image I b) SpecklesImage
c) GraphicsImage d) TextsImage
Figure 9: separation between noise/graphics/text.
3.4 Separation of Characters
Connected to Graphics
Figure 10 illustrates frequent cases for invoices with
printing text which overlap lines surrounding frames
or tables. When colors cannot separate characters
and graphics, the image
GraphicsImage contains
textual element which touch graphics (Figure 10b).
We can achieve a coarse separation between
characters and graphics by using elementary
morphological operation with the existing
information provided by the system. The binary
morphological closing of
GraphicsImage, with an
horizontal / vertical element Bh / Bv respectively,
removes all characters that touch graphics both
vertically / horizontally (figure 10c,10d). We define
H_Text (15) and V_Text(16) by the difference
between the horizontal / vertical closing of
GraphicsImage with the image GraphicsImage
itself, respectively. Images H_Text/V_Text show
characters disconnected with horizontal / vertical
lines (Figure 10e, 10f), respectively.
X= GraphicsImage
H_Text=HorizontalClosing
Bh
( X )
c
X
(15)
X= GraphicsImage
V_Text=VerticalClosing
Bv
( X )
c
X
(16)
a) Original Image with
overlapped characters touching
graphics
b) GraphicsImage
c) Horizontal Closing of
GraphicsImage
d) Vertical Closing of
GraphicsImage
e) H_Text (7) f) V_Text (8)
g) GraphicsImage after split h) Text separated from graphics
Figure 10: Separation of characters connected to graphics.
The size of the horizontal and vertical structural
elements Bh and Bv must be fixed to the minimal
width and height of characters to separate from the
graphics, respectively. Typically we use
WidthMax
and HeightMax for the size of the horizontal and
vertical structural elements respectively.
The reconstruction of characters after splitting
them from a graphic line is possible but we do not
achieve this restoration. This character
reconstruction will be detailed in future work. Our
proposed morphological operation works perfectly
well for text touching straight lines only, and is also
tolerant to image skew (figure 10h).
3.5 Color Fusion and Selection
This step consists of combining the color
information from the MeanShift clustering and the
color segmentation by morphology to merge outlier
AColDPS-RobustandUnsupervisedAutomaticColorDocumentProcessingSystem
181

colors classes to the main color classes. This step
also ranks the text color layer by frequency and
selects the main text colors. We have already
illustrated (figure 4) that the MeanShift produces
classes of outliers colors due to the existing color
transitions along characters contour. As the
Meanshift is applied only in the colorimetric space,
for each pixel independently to the other
neighbouring pixels, these color outliers cannot be
avoided. We have tested several pre-processing
algorithms such as the edge preserving smoothing
(
Nikolaou,2009) or other choc filters to suppress the
color transitions along contours. However, this kind
of pre-processing is time consuming and cannot be
used for real time applications.
We have developed a straightforward merging
process which takes into account the spatial co-
occurrence of colors classes in the segmented image
by the MeanShift. We use
TextsImage to compute
statistics about the connectivity of colors classes
found by the MeanShift. We only focus on text color
because the color of the background is useless for
our application. In the image
TextsImage, we
compute the 2D spatial co-occurrence
H2D (i,j)
equal to the number of class color
i connected
spatially to class color
j in all the inside characters of
the image
TextsImage. We use a 8-connectivity to
count correctly in one pass
H2D(i,j).We compute
H1D(i) the number of occurrence of the class color
from
H2D(i,j). C(i,j)=H2D(i,j)/H1D(j)
measures the degree of connectivity between the
class color
i with the class colorj. Color Outliers
share a high connectivity with main colors of
characters.
Algorithm 2 merges color class
i to color class j
if the connectivity
C(i,j) exceeds Cmin=0.25 and
if
C(i,j) and H1D(j)are maximal and the
colorimetric distance is minimal. To keep the color
coherency, we merge small class to large class and
not the inverse.
After merging the color classes in
ColorClass,
we repeat algorithm 2 until there is no more
changes. The iterations are necessary to merge
successively layers of colors around characters
contours. To select the right number of different text
color, we rank the text color classes in descending
order of frequency. There is a gap between two
consecutive ranked color classes of the decreasing
curve of frequencies. We set the number of text
colors in the middle of the larger gap between
successive color classes.
Algorithm 2: Color Fusion.
for all pixel (x,y)
if (TextsImage(x,y)==0) // if character
{
i=ColorClass(x,y) // from MeanShift
if (TextsImage(x-1,y)==0)
{ j=ColorClass(x-1,y) H2D(i,j)++ }
if (TextsImage(x,y-1)==0)
{ j=ColorClass(x,y-1) H2D(i,j)++ }
if (TextsImage(x-1,y-1)==0)
{j=ColorClass(x-1,y-1) H2D(i,j)++}
}
forcolor class i
forcolor class j >i
if C(i,j)>cmin
mergei to j if
{
* H1D(i)<H1D(j)
* C(i,j) is maximal
* H1D(j) is maximal
* ColorDistance(i,j) minimal
}
3.6 Algorithmic Optimization
Several hundreds of thousands of documents are
automatically processed daily by the company.
We must reduce the algorithmic complexity of each
step of the AColDPS system. The overall processing
for each image must not exceed few seconds without
parallelization. The objective consists of computing
an image in less than a second with parallelisation.
The color clustering is already optimized with a
complexity of a O(N) by using the Fast Integral
MeanShift based on integral cubes (Lebourgeois et
al., 2013). The adpative thresholding of the color
morphology results is also already optimized with
integral images (Gaceb et al., 2013). Median filter is
also computed in constant time by using partial
histograms correspondence of sliding windows
between two successive windows (Perreault, 2007).
We have speeded-up the median filtering by
applying it on a low resolution image for a degraded
result. However, the median result is just a coarse
representation of the local dominant color we use as
seeds for a conditional dilation or erosion. The
quality of the median result is not taken into account
during the process. For the morphological color
operation of dilation and erosion, integral images
cannot be used with min and max operators, only
summation of functions can be computed. To
optimize the color morphological operations of
dilation and erosion, we use the same idea from
(Perreault, 2007). Instead of computing the
statistical histogram to calculate the median values,
we compute the local maxima and minima of a
sliding window by using an horizontal raw vector
which stores the maximal/minimal values of each
VISAPP2015-InternationalConferenceonComputerVisionTheoryandApplications
182
column of the windows. When the window slides
from a pixel to another, we just shift the values in
the row vector and compute the maxima/minima of
the new column that we compare to the
maxima/minima of the row horizontal vector only
once.
Color segmentation and the clustering process
run in much reduced time and depend only on the
number of pixels to process. The color fusion and
selection step depends on the number of colors
found by the fast integral MeanShift. As the number
of clusters is reduced, the number of operations are
not time consuming. The computational time for the
separation between text from graphics and noise is
not predictable. The morphological convolution like
all geodesic transformation is repeated until there is
not change. The number of iterations depends on the
complexity of shapes and the alignment of dots for
the dithered image. The more the image contains
complex graphics and noise or dithered background,
the more time this step will take. The time of the
processing is maximal for complex shapes like
Peano curves or other space-filling curve. For a
300dpi image 1640 x 2332, it takes less than 3 sec.
for color clustering, 6 sec. for color image
segmentation by morphology and colors fusion and
selection on one core without parallelization. The
separation of text from graphics, image noise and
dithered background can take less than a second for
simple and clean image to several seconds for
complex images with dithered background. All the
algorithms are sequential and can be easily
parallelized.
4 RESULTS
4.1 Global Performances
We first illustrate the performances of the color
automatic segmentation on a test image provided by
the private company Janich&KlassComputertechnik
GmbH which has developed the software DpuScan
and its Advanced Color Document Processing
(ACDP) tool, which is widely used in the industry
and distributed worldwide. DpuScan is well-known
to be the best tool to separate text colors in business
documents. But it is achieved manually by selecting
each color background and text color.
Figure 11 shows that AColDPS find text color
automatically and achieve a good segmentation of
this image. We display all color layers of text in the
same image with an artificial white background to
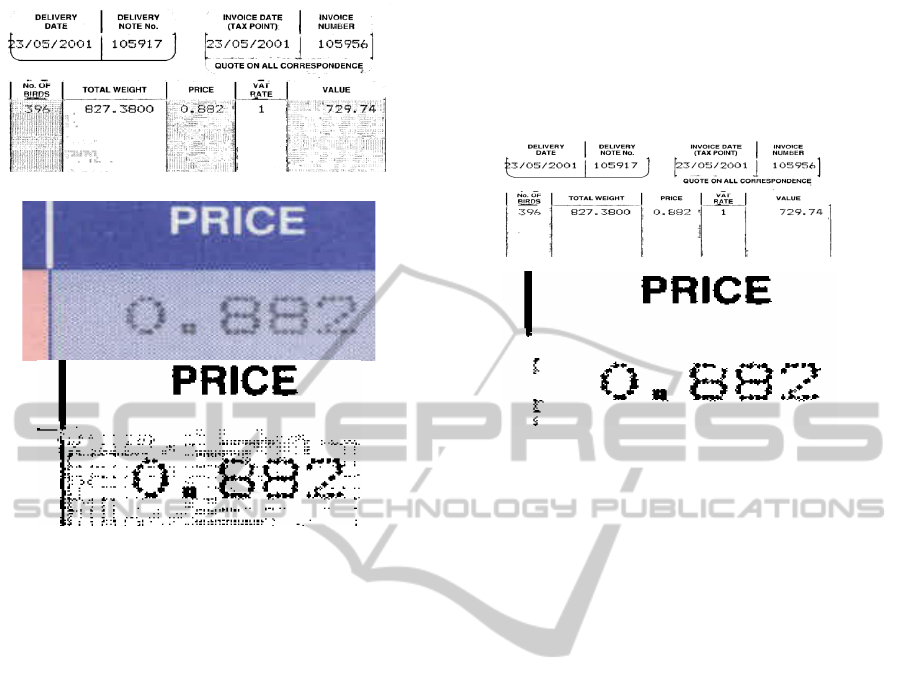
save place. Figure 12 and 13 show the pertinence to
use color information to segment text from complex
pre-printed backgrounds. The thresholding of the
luminance image (figure 12b) make difficult the
separation between handwritten text and the pre-
printed forms. After a color analysis, the added
handwritten text can be easily segmented. Figure 14
zoom on the table headings of the figure 4. It
illustrates the color separation between overlapped
texts in the worst case when inverted text crosses
non inverted text. AColDPS separates correctly the
two layers of text (figure 14).
Figure 11: AColDPS result on DPUscan test image.
a) Binarization of the luminance (Sauvola)
b) Main text colors (handwritten text added to the form)
c) 3 other color layers combined together (the pre-printed form)
Figure 12: Color segmentation outperforms the adaptive
thresholding of the luminance for character segmentation.
AColDPS-RobustandUnsupervisedAutomaticColorDocumentProcessingSystem
183
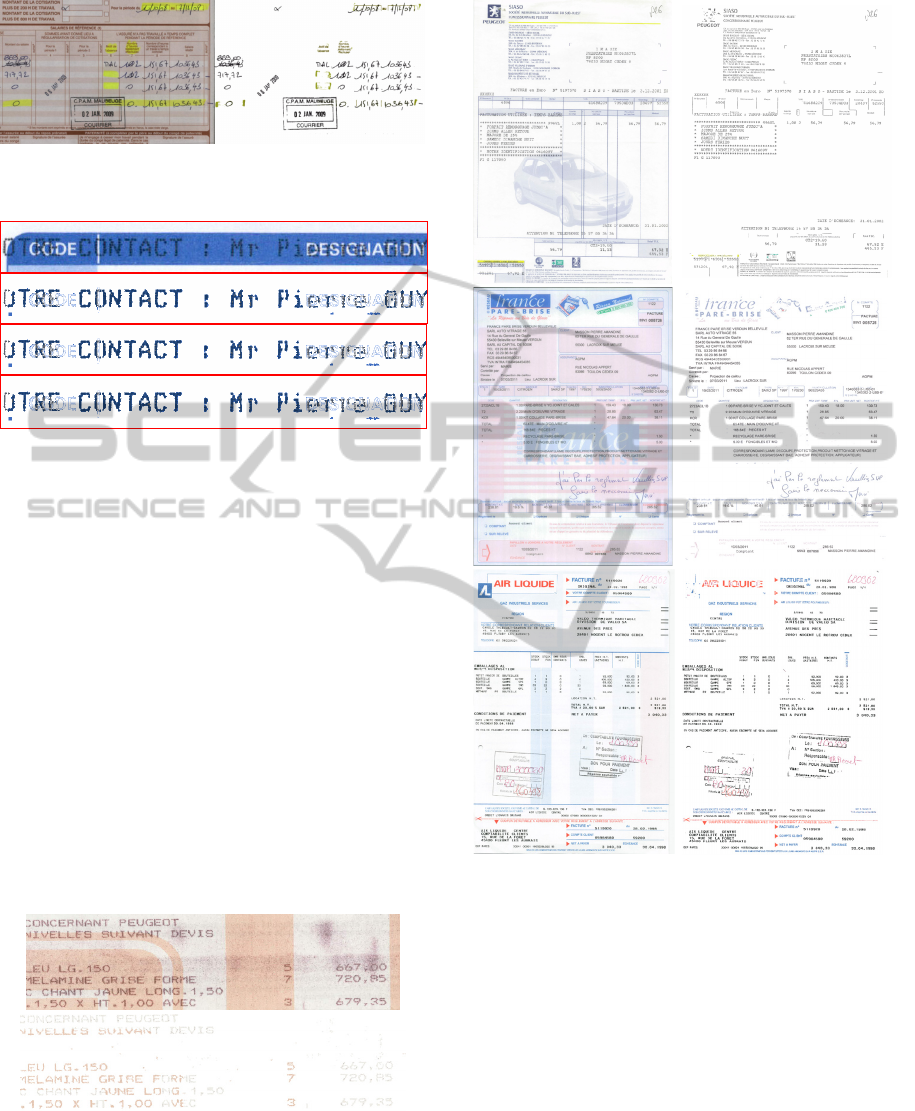
Figure 13: AColDPS separates correctly color handwritten
text and the background even with highlighting regions.
Figure 14: Correct color separations with overlapped
inverted and not inverted texts.
4.2 Evaluation on the Database
We have tested the proposed system on 529 color
images of various invoices and forms in real
situation. Among 529 images we manually found 4
images with some problems of segmentation.
Among these errors, we found 2 images that present
a change of text color, detected by the system,
because of the ink bleed trough of the color
background to the characters of the foreground
(Figure15). 1 images show handwritten texts totally
illegible because of the ink fading. 1 error is due to
the printing of black characters crossing a large
black frame. Most of errors can be explained by the
quality of the document itself. We have achieved
99.25 % of correctly segmented document.
Figure 15: Failure of AColDPS because of color transfer
from the background to the foreground.
Figure 16: Successes of AColDPS.
5 CONCLUSIONS
In this paper, we have presented an unsupervised
fully automatic system for color business document
segmentation. We have developed the first fully
data-driven pixel-based approach that does not need
a priori information, training or manual assistance.
The proposed method has the following advantages:
1) It does not require any connected component
analysis and simplifies the extraction of the layout
and the recognition step undertaken by the OCR;
2) it processes inverted and non-inverted text
automatically, using color morphology, even in
VISAPP2015-InternationalConferenceonComputerVisionTheoryandApplications
184

cases where there are overlaps between the two; 3) it
efficiently removes noise and speckles from dithered
background and automatically suppresses graphical
elements using geodesic measurements; 4) it splits
overlapped characters and separates characters from
graphics if they have different colors. The proposed
Automatic Color Document Processing System has
the potential to be adapted into different business
document images. The system outperformed the
classical approach that uses binarization of the
greyscale image and simplifies both the extraction of
the layout and the recognition performed by the
OCR. In future works, we plan to find a solution to
reconstruct characters crossing graphical elements.
ACKNOWLEDGMENT
This work is granted by ITESOFT for the project DOD.
REFERENCES
L. Bottou, P. Haffner, PG. Howard, Y. LeCun, Djvu:
analyzing and compressing scanned documents for
internet distribution. ICDAR, 2001.
K. Jung, J. Han, Hybrid approach to efficient text
extraction in complex color images, PRL, V. 25, I. 6,
19 April 2004, Pages 679-699.
D. Karatzas, et al., Color text segmentation in web images
based onhuman perception Image and Vision
Computing, Volume 25, Issue 5, 1 May 2007, Pages
564-577.
E. Badekas et al., Text segmentation in color documents,
IJIST, V. 16, I. 6, 2006, Pages: 262–274.
Y. Peng, J. Xiao, Color-based clustering for text detection
and extraction in image, ICM 2007, Pages 847-850.
A. Ouji, et al., Chromatic /achromatic separation in noisy
document images, ICDAR 2011.
A. Aıt Younes et al., Color Image Profiling Using Fuzzy
Sets, TJEECS, 13(3):343-369, 2005.
E. Carel et al., Dominant Color Segmentation of
Administrative Document Images by Hierarchical
Clustering, DocEng 2013.
S. Perreault and Patrick Hebert, Median Filtering in
Constant Time, IEEE Image Processing 2007.
J. Chanussot & P. Lambert, “Total ordering based on
space filling curves for multivalued morphology”,
Proc. ISMM'98, June 1998, pp 51-58.
Jean Serra, Image Analysis and Mathematical
Morphology, Academic Press, London, 1982.
E. Aptoula et al., Multivariate mathematical morphology
applied to color image analysis. In Chapter 10:
Multivariate Image Processing, 2009.
P. Soille, Morphological image analysis: Principles and
applications. In Springer, 2004. 2nd Edition.
Comaniciu et al., 2002, MeanShift: A Robust Approach
toward Feature Space Analysis, PAMI, Vol. 24, No. 5.
Gaceb D., et al., Adaptative Smart-Segmentation Method
for Images of Business Documents, ICDAR 2013, pp.
118-122. .
F. Lebourgeois et al., Fast Integral MeanShift: Application
to Color Segmentation of Document Images, ICDAR.
2013, IEEE ed. Washington, USA. pp. 52-56.
AColDPS-RobustandUnsupervisedAutomaticColorDocumentProcessingSystem
185
