
Automatic Pharynx Segmentation from MRI Data for Obstructive Sleep
Apnea Analysis
Muhammad Laiq Ur Rahman Shahid
1
, Teodora Chitiboi
1,2
, Tatyana Ivanovska
3
, Vladimir
Molchanov
1
, Henry V
¨
olzke
3
, Horst K. Hahn
1,2
and Lars Linsen
1
1
Jacobs University, Bremen, Germany
2
Fraunhofer MEVIS, Bremen, Germany
3
Ernst-Moritz-Arndt-Universit
¨
at Greifswald, Greifswald, Germany
Keywords:
Obstructive Sleep Apnea (OSA), Pharynx Segmentation, Magnetic Resonance Imaging (MRI).
Abstract:
Obstructive sleep apnea (OSA) is a public health problem. Volumetric analysis of the upper airways can help
us to understand the pathogenesis of OSA. A reliable pharynx segmentation is the first step in identifying the
anatomic risk factors for this sleeping disorder. As manual segmentation is a time-consuming and subjective
process, a fully automatic segmentation of pharyngeal structures is required when investigating larger data
bases such as in cohort studies. We develop a context-based automatic algorithm for segmenting pharynx
from magnetic resonance images (MRI). It consists of a pipeline of steps including pre-processing (thresh-
olding, connected component analysis) to extract coarse 3D objects, classification of the objects (involving
object-based image analysis (OBIA), visual feature space analysis, and silhouette coefficient computation) to
segregate pharynx from other structures automatically, and post-processing to refine the shape of the identified
pharynx (including extraction of the oropharynx and propagating results from neighboring slices to slices that
are difficult to delineate). Our technique is fast such that we can apply our algorithm to population-based
epidemiological studies that provide a high amount of data. Our method needs no user interaction to extract
the pharyngeal structure. The approach is quantitatively evaluated on ten datasets resulting in an average of
approximately 90% detected volume fraction and a 90% Dice coefficient, which is in the range of the inter-
observer variation within manual segmentation results.
1 INTRODUCTION
Sleeping disorders such as obstructive sleep apnea
are public health problems affecting, at least, 2-4%
of the middle-aged population (Pack, 2002). Sleep-
disordered breathing (SDB) such as obstructive sleep
apnea not only causes poor sleep quality and daytime
sleepiness, but also has clinical consequences includ-
ing hypertension and increased risk of cardiovascu-
lar disease (CVD) (Shaw et al., 2008). SDB is in-
creasingly considered as a potential therapeutic target
for either primary or secondary prevention of cardio-
vascular disease. Obstructive sleep apnea is defined
as a recurrent cessation of respiration associated with
an upper airway obstruction during sleep (Lowe and
Fleetham, 1991). It is marked by repeated episodes
of upper airway collapse, leading to apnea (cessation
of airflow for greater or equal to 10 seconds) or hy-
popnea (decrease in airflow for greater or equal to 10
seconds) (Berry et al., 2012). The clinical syndrome
of sleep apnea is defined as the presence of abnor-
mal breathing in sleep along with daytime symptoms,
particularly excessive daytime sleepiness. Obstruc-
tive sleep apnea also results in impaired sleep qual-
ity leading to deterioration of memory and judgment,
altered personality, and reduced concentration (Shi
et al., 2006). Patients complain of a range of symp-
toms and may develop physical complications that in-
clude systematic hypertension, right heart failure, and
cardiac arrhythmias (Lowe et al., 1986).
While the clinical symptoms of obstructive sleep
apnea are well recognized, the understanding of its
pathogenesis remains incomplete. It is clear, however,
that upper airway anatomy is important in the patho-
genesis of obstructive sleep apnea. In order to fully
understand upper airway anatomy, we need to exam-
ine the volume of the airway and surrounding upper
airway structures (Ivanovska et al., 2013). To study
upper airway anatomy, it is important to develop a
segmentation technique to extract the anatomy from
599
Shahid M., Chitiboi T., Ivanovska T., Molchanov V., Völzke H., Hahn H. and Linsen L..
Automatic Pharynx Segmentation from MRI Data for Obstructive Sleep Apnea Analysis.
DOI: 10.5220/0005315905990608
In Proceedings of the 10th International Conference on Computer Vision Theory and Applications (VISAPP-2015), pages 599-608
ISBN: 978-989-758-089-5
Copyright
c
2015 SCITEPRESS (Science and Technology Publications, Lda.)

medical images.
Although, the X-ray computed tomography (CT)
is considered to be the gold standard for airways
imaging, its employment in an epidemiological co-
hort or repeated CT scans for research purposes in a
single patient are ethically not justified. Here, mag-
netic resonance imaging as anon-radiation based ex-
amination method gains an increasing popularity in
the clinical and epidemiological setting. MR imaging
offers a good contrast between soft tissue structures
and is utilized to analyse throat tissues (Ivanovska
et al., 2011). Because MRI involves little or no risk
to healthy volunteers, it makes it possible to perform
large-scale studies to understand the role of pharynx
morphology in sleep apnea.
The first step towards this endeavour is to estab-
lish a reliable segmentation of the pharynx from 3D
MR images. As manual segmentation is a labori-
ous, observer-dependent, and time-consuming pro-
cess, full automation of the three-dimensional anal-
ysis of the pharynx is required. In this paper, we
present a fast and fully automatic segmentation ap-
proach for the pharynx from MR images based on
a pipeline of steps. We mainly apply a few pre-
processing steps to extract coarse segmentation of
candidates, extract their properties within a multidi-
mensional feature space, to which we apply a visual
analysis approach to find a reliable classification, and
refine the shape of the identified pharynx in a post-
processing step. The results are analysed and com-
pared against manually established ground truth and
the state of the art. We can show that our automatic
method achieves results within the range of inter-
observer variability.
The rest of the paper is organized as follows: We
give an overview of related work in Section 2. The
material and data used in this study are described in
Section 3. Section 4 describes the working of our seg-
mentation method. The results are analyzed and com-
pared against manually established ground truth and
state-of-the-art techniques in Section 5 while Section
6 concludes the paper.
2 RELATED WORK
Since the X-ray CT is used more commonly for air-
ways imaging, most of the segmentation methods de-
signed for airways are applied to this imaging modal-
ity. Nearly all methods of segmentation and measure-
ment designed for airways published in literature are
developed for X-ray computed tomography and cone-
beam computed tomography images. However, due to
large differences between CT and MR images, those
methods cannot be applied for our purposes.
There are few publications dealing with the spe-
cific challenges of pharynx classification and segmen-
tation from MRI data. Schwab et al. (2003) utilized
volumetric measurements of upper airways to ana-
lyzes anatomic alterations. The measurements were
performed manually. Liu et al. (2003) performed a
study to diagnose upper airway disorders in children
by delineating upper airway and surrounding struc-
tures with magnetic resonance imaging. They pro-
posed a semi-automatic framework for upper airway
segmentation using fuzzy connectedness. Here, T1-
and T2-weighted MR images were acquired and an
operator specified a volume of interest and seeds in
both image volumes manually. The mean processing
time is about four minutes including the operator in-
teraction. The method is based on a local fuzzy rela-
tion on voxels called affinity, which indicates how the
voxels belong together locally within the scene in the
object of interest. Finally, a global fuzzy connected-
ness relation is constructed that decides how the vox-
els dangle together globally in the scene to form the
object. Andrysiak et al. (2001) reported a method
for upper airways analysis in patients with obstruc-
tive sleep apnea by using MRI and performed mea-
surements based on individual slices such as assessing
surfaces of the smallest cross-section of upper airway
lingual, thickness of soft palate, and the smallest dis-
tance between soft palate and throat wall.
Ivanovska et al. (2013) presented a pipeline for
pharynx segmentation with semi-automatic initializa-
tion. The automatic part of the approach consists of
three steps: smoothing, thresholding, and 2D and 3D
connected component analysis. Whereas the two first
steps are rather common, the third step provides a set
of general rules for extraction of the pharyngeal com-
ponent. Their method requires less than one minute
to extract the pharyngeal structures. The approach
is mostly automatic, but uses a small amount of in-
teractions like defining starting and ending slice of
oropharynx and marking the parapharyngeal fat pads
in them.
In conclusion, over the past years we have seen
important advances in upper airway MRI segmenta-
tion, prompted by an increase in the quality and avail-
ability of MR imagery. There has been a little work
towards developing an automatic segmentation tech-
nique. Some researchers tried to tackle this problem,
but it has not yet been completely solved.
3 MATERIALS
The test datasets were acquired in the frame of the
VISAPP2015-InternationalConferenceonComputerVisionTheoryandApplications
600
Study of Health in Pomerania(SHIP) (V
¨
olzke et al.,
2010), a population-based study conducted in North-
east Germany, where more than 2000 participants
aged 20 to 89 years were examined. The test datasets
are axial T1-weighted isotropic head MR images with
spatial resolution of 1mm in each dimension leading
to 176×256 ×176 voxels. These MR images contain
only the upper part of pharyngeal structures. How-
ever, the medical experts considered the images to
contain the most essential information and to be suit-
able to study the obstructive sleep apnea syndrome in
the frame of an epidemiological study.
We randomly select sixteen individual head MRI
datasets for our experiments and tests. To consider
the observer variability and error, two medical ex-
perts provide manually segmented ground truths for
ten datasets under the supervision of an experienced
radiologist.
4 PHARYNX SEGMENTATION
The large intensity variations and low contrast in MRI
make pharynx segmentation more challenging than in
CT images. Also, identifying the pharynx in individ-
ual axial MRI slices poses additional challenges be-
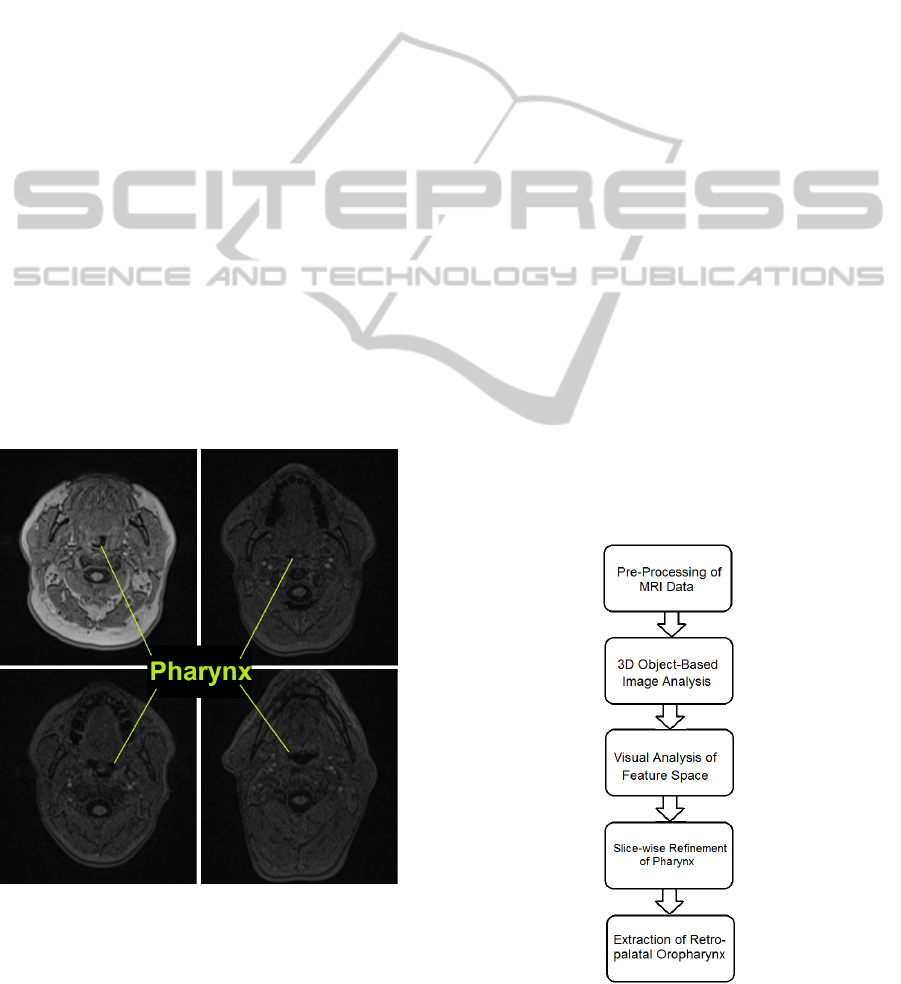
cause of its irregular shape and diverse appearance as
shown in Figure 1, rendering shape-based classifica-
tion a difficult task.
Figure 1: Diverse Appearance of Pharynx in Axial Slices.
State-of-the-art approaches rely on manually
placed markers to perform guided 3D image grow-
ing on a pixel level. However, when operating exclu-
sively on a voxel level, the spatial relation between the
pharynx and other neighbouring anatomical regions
is more difficult to establish. Nevertheless, the local
context could provide useful information for identify-
ing our target structure. Thus, we overcome the limi-
tations of voxel-based processing by analyzing atomic
image regions (called objects) in their local semantic
context. Image regions possess many features that are
not available on a voxel level such as shape, orienta-
tion, intensity statistics, and relative position to other
regions. In our approach, we generate a set of 3D
image regions by over-segmentation, which are then
classified to detect the segments forming the pharynx.
The complete pipeline of our approach is shown
in Figure 2. First, the image is partitioned into coarse
3D regions using thresholding and connected compo-
nent analysis. The features describing the appearance
and orientation of each 3D region are then extracted,
which form a multidimensional feature space. By vi-
sually exploring the feature space we find a combi-
nation of settings of pharynx characteristics, which
distinguishes it from other candidate objects. A clas-
sifier that detects the 3D pharynx samples in the mul-
tidimensional feature space is defined. In a post-
processing, the pharynx region is slice-wise refined.
After removing false surrounding voxels, the segment
of the pharynx which is thought to play a key role
in sleep apnea analysis is automatically extracted us-
ing central differences. Our approach is completely
automatic, requiring no user interaction. The results
were validated on sixteen datasets using two manual
ground truth segmentations. The following subsec-
tions provide the details on the individual steps of the
pipeline.
Figure 2: Complete pipeline.
AutomaticPharynxSegmentationfromMRIDataforObstructiveSleepApneaAnalysis
601
4.1 Pre-processing
In most classification and segmentation problems,
pre-processing plays a vital role. In our ap-
proach, we perform smoothing with a median and an
anisotropic filter followed by clustering using thresh-
olding (Shapiro and Linda, 2002).
First, we apply a median filter of kernel size
3 × 3 × 5 to remove isolated voxels and minimize the
salt and pepper noise (Gonzalez and Woods, 2008).
After this, we smooth the image using the anisotropic
diffusion filter (Perona and Malik, 1990),which can
cope with the low intensity contrast and intensity vari-
ations in MRI sequences, while preserving the bor-
ders intact.
Finally, we apply a coarse intensity clustering to
the image volume to reduce the computational com-
plexity, and extract coarse and homogeneous regions
in each image slice by selecting half of the mean gray
value as threshold value. By thresholding, we select
the darkest regions in the image, as we know that the
pharyngeal air column is one of the darkest classes in
MR images. The thresholding step significantly de-
creases the number of over-segmented objects in the
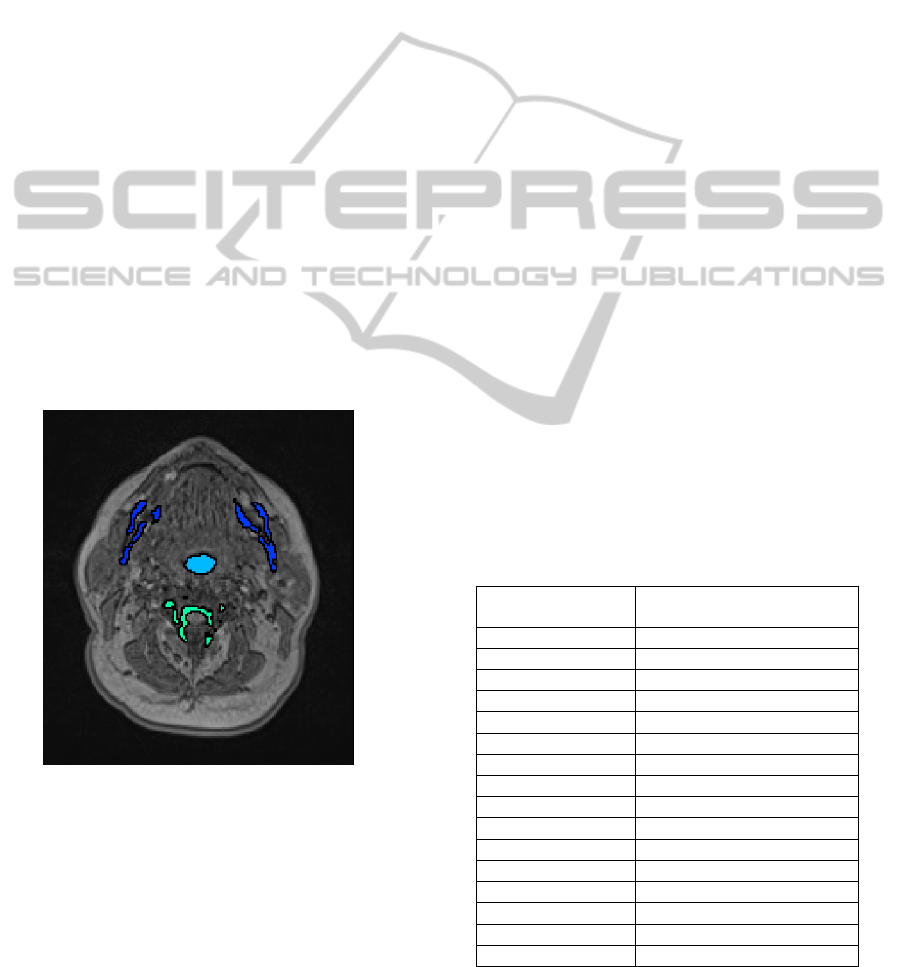
head MR image volume. Figure 3 shows an axial slice
of the MRI dataset, where the dark objects remaining
as candidates for the pharynx are highlighted.
Figure 3: 3D object candidates for the pharynx shown on
axial slice.
At the end of the pre-processing step, we are left
with dark regions on axial slices of the MRI datasets
which includes the pharyngeal air pipe and other dark
regions like vertebrae, teeth, and bone structures.
4.2 Object-based Image Analysis
Having dark regions on axial slices, the next task is to
connect them using connected component analysis in
order to build 3D objects. During connected compo-
nent analysis, we use a 26 neighborhood relationship
in 3D to connect dark region voxels to build 3D coarse
objects in MRI dataset. In the nasopharynx region,
we face a region leakage problem due to low inten-
sity contrast, which makes the pharynx shape more
irregular and random. Thus, we need to exclude the
nasopharynx level from the 3D coarse objects during
connected component analysis, such that we are left
with a more regular and well-defined shape for the
pharynx. We achieve this task by separating the na-
sopharynx region from the oropharynx where the ax-
ial area of the pharynx exceeds a certain limit.
Daniel et al. (2007) mentioned average dimen-
sions of the pharyngeal air column in both genders.
We also measure the area of the pharynx on each ax-
ial slice for our datasets and find the maximum values
which are shown in Table 1. After a complete analy-
sis of the pharynx area on axial slices, we break the
linkage between nasopharynx and oropharynx where
the pharynx has a physical dimension greater than a
threshold value (350 mm
2
) on any axial slice. In ad-
dition to this, the total volume of the visible pharyn-
geal part is 2000 mm
3
to 4000 mm
3
on average in our
datasets. Therefore, we can discard 3D objects which
have a volume less than 400 mm
3
to reduce the num-
ber of 3D coarse objects. This additional step further
decreases the number of remaining 3D objects. Fig-
ure 3 shows that after performing all these tasks, only
few 3D objects are left as pharynx candidates in the
object-based image analysis step, which makes our
algorithm more time efficient.
Table 1: Maximum area of pharynx on any axial slice.
MRI Head Dataset
Maximum Area of Pharynx
on Axial Slice in mm
2
1
283
2
198
3
211
4
252
5
192
6
275
7
255
8
169
9
264
10
303
11
223
12
209
13
204
14
210
15
257
16
235
VISAPP2015-InternationalConferenceonComputerVisionTheoryandApplications
602
4.3 Visual Analysis of Feature Space
After building 3D objects and eliminating the redun-
dant objects, our task is to classify them with re-
spect to some features. Hence, we obtain the de-
scriptive features of atomic image regions using a
generic framework for object-based image analysis
introduced by Homeyer et al. (2010). The image re-
gions are described by a set of features regarding their
shape and intensity statistics.
The intensity features comprise of standard statis-
tics over the 3D image region, including minimum,
maximum, and average values as well as median and
upper and lower quartiles.
Regarding the regions shape, there are many de-
scriptors available in literature as shown in the sur-
vey by Mingqiang et al. (2008). One of the standard
methods to compute shape features is based on central
image moments (Burger and Burge, 2009) of the bi-
nary mask of a region r, where r(x, y) = 1 if the voxel
(x, y) belongs to the region and r(x, y) = 0 otherwise.
The central image moments of the order p, q for a bi-
nary image r(x, y) are defined by
µ
pq
(r) =
∑
x
∑
y
(x − x)
p
(y − y)
q
r(x, y)
where (x, y) represents the coordinates of the cen-
troid and the zero-order moment represents the area
of a binary image. Furthermore, we perform princi-
pal component analysis (Jolliffe, 2005) on the voxel
distribution of the region. The principal eigenvectors
and corresponding eigenvalues λ1 and λ2 can be com-
puted from the covariance matrix of r, which is de-
fined by
cov(r) =
µ
20
(r) µ
11
(r)
µ
11
(r) µ
02
(r)
The principal eigenvectors define the regions ori-
entation, while the ratio of their corresponding eigen-
values measures the regions eccentricity. Using cen-
tral moments, we can derive different shape features.
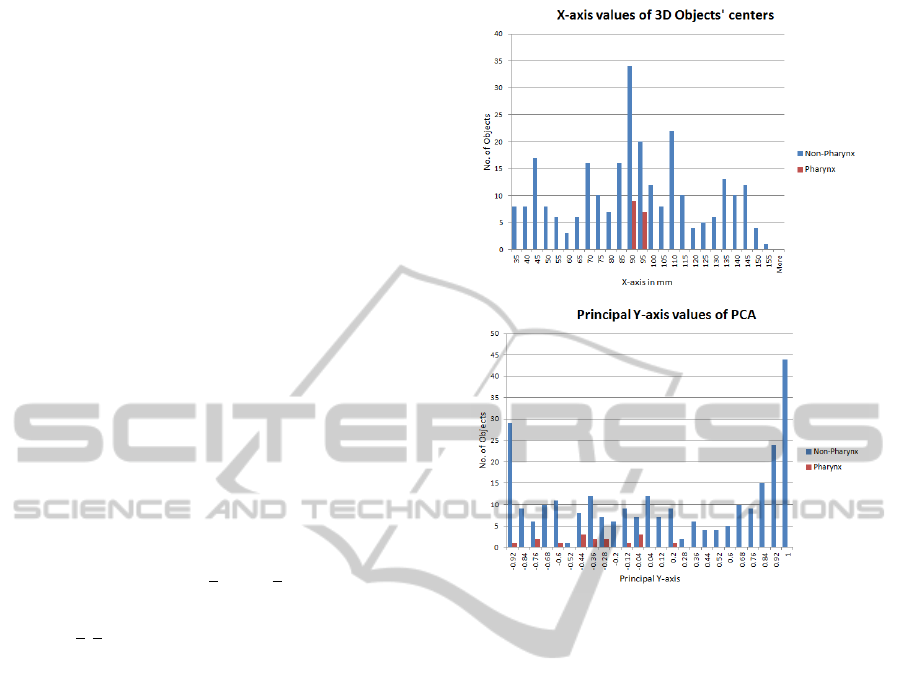
We analysed the histograms of different individual
features for pharynx and other 3D objects. It is clear
from the histograms in Figure 4 that the chosen sin-
gle features do not suffice to distinguish the pharynx
from other objects. The same holds for other features.
Nevertheless, pharynx objects have a narrow range of
values for some specific features which can be used
in a combination with other features to separate them
from other false candidates.
The shape and statistical features form a multi-
dimensional feature space for pharynx description.
Hence, we generate a set of potentially descriptive
Figure 4: Histograms of individual features. Top: X-axis
values of centers of 3D objects. Bottom: Principal Y-axis
values of 3D objects.
features for our 3D coarse objects in our MRI head
datasets. Our next task is to determine which com-
bination of features best distinguishes the subset of
objects that belongs to the pharynx.
After generating a set of possible descriptive fea-
tures for our 3D coarse objects, we visualize the in-
fluence of those features using histograms to find the
most relevant features which segregate pharynx sam-
ples from remaining samples as shown in Figure 4.
It is found that principal eigenvectors and eigenval-
ues have compactness and few variations for pharynx
samples. So, we visually analyse our feature space
and find suitable values of our features to separate
pharynx from other tissues in MRI dataset.
We use star-coordinates widget (Molchanov and
Linsen, 2014) to explore multidimensional feature
space. To visually explore the data distribution, we
apply the dimensionality reduction method such as
linear projection method to map multidimensional
data to a 2D space. Linear projection is the most eco-
nomical method in terms of computational cost and it
doesn’t introduce too much distortion which makes it
most suitable choice for our purpose. The linear pro-
jection of our 5-dimensional feature space onto the
2-dimensional visual space is defined by a projection
AutomaticPharynxSegmentationfromMRIDataforObstructiveSleepApneaAnalysis
603
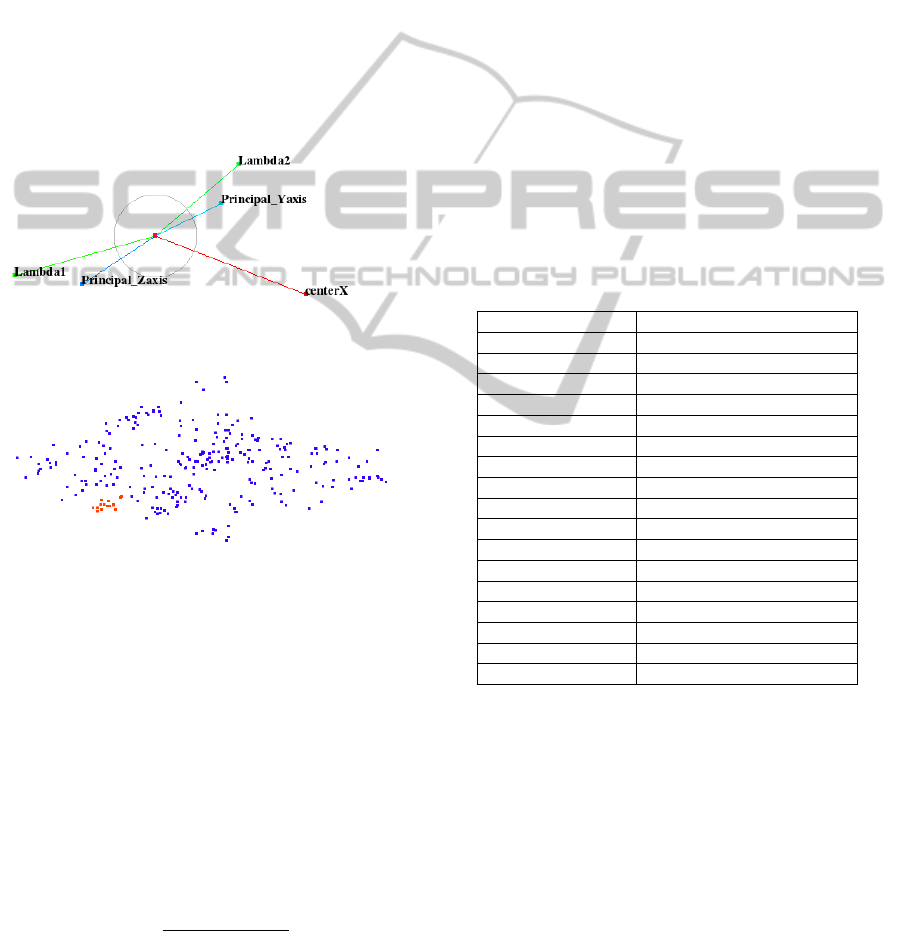
matrix of size 2 × 5. We visualize the columns of our
projection matrix as axes of star-coordinates widget.
We use a training dataset, where we know the ground
truth in the form of manually segmented pharynx re-
gions and find a configuration of the star-coordinates
widget such that samples representing these pharynx
regions are visually decoupled from other regions as
demonstrated in Figure 5. It is very clear that the cho-
sen configuration of the star-coordinates widget cre-
ates a projected space that exhibits an area with only
red samples representing pharynx. We observe that
it suffices to select only five salient features, namely,
PCA descriptors (lambda1, lambda2, principal y-axis,
and principal z-axis) and x-center values (x-axis val-
ues for centers of objects) to create this projected
space as shown in Figure 5.
Figure 5: Top: Star-coordinate widget configuration. Bot-
tom: Red and blue samples represent pharynx and non-
pharynx clusters, respectively, in projected view.
We store the recorded projection matrix for this
projected space from training datasets which serves as
a classifier for test datasets. In order to apply the clas-
sification to test data, we map the new feature data us-
ing the recorded projection matrix. Then, we compute
the silhouette coefficient for each candidate of the test
dataset considering the pharynx cluster of the train-
ing data. The best silhouette coefficient, then, delivers
the region that is supposed to represent the pharynx in
the test data. The silhouette coefficient (Rousseeuw,
1987) is defined by
s(i) =
b(i) − a(i)
max{a(i), b(i)}
where s(i) is the value of the silhouette coefficient
for the ith sample of the test dataset, We use Euclidean
distance as a measure of dissimilarity. We then define
a(i) as the average of the Euclidean distances from
ith sample to all samples of the pharynx cluster in the
training dataset, and b(i) as the average of the Eu-
clidean distances from the ith sample to all samples
of the non-pharynx cluster in the training dataset. All
pharynx and non-pharynx points of training datasets
are shown as red and blue points, respectively, in the
projected space of Figure 5.
On average, the total number of 3D segments in
each dataset is about 18, where only one segment is
classified to represent the pharynx. Detailed informa-
tion can be found in Table 2. To estimate how ac-
curately our pharynx classifier performs in practice,
we use the leave-one-out cross validation technique
for the sixteen datasets. In a single round of cross-
validation, we use our fifteen datasets as training set
and one dataset as testing set. To reduce the variabil-
ity, multiple rounds of cross-validation are performed
using different partitions, and the validation results
are averaged over the rounds.
Table 2: Total number of segments and statistics for phar-
ynx classifier.
MRI Head Dataset Total number of 3D objects
1 11
2 20
3 21
4 15
5 21
6 18
7 20
8 15
9 23
10 12
11 19
12 23
13 15
14 14
15 17
16 19
Average 17.6
The result of the validation was the perfect result
of 100% true positive rate and zero false positives for
pharynx classification, which serves as the basis for
our fully automatic pharynx segmentation algorithm.
In addition to it, we do not need any post-processing
step to decrease the false positive rate which makes
our classifier more efficient and economical in terms
of time and computational complexity.
4.4 Slice-wise Refinement of Pharynx
Since coarse intensity clustering was applied to com-
plete MRI dataset in the pre-processing step to reduce
the computational complexity, a refinement of the 3D
VISAPP2015-InternationalConferenceonComputerVisionTheoryandApplications
604
object representing pharynx is necessary. Due to low
contrast and inhomogeneous intensity over the com-
plete MRI volume, but also because of performing
the segmentation on a lower intensity resolution, the
intermediate results include some false surrounding
voxels. This refinement is performed on a slice-wise
basis in axial direction.
We start the refinement step from the bottom slice
where hypopharynx and oropharynx meet each other.
For each slice, we find the center of gravity of the
pharynx from the corresponding axial slice of the ini-
tial 3D coarse object representing the pharynx. There-
after, we select a region of radius r (where r is equal
to 2.5 times the radius of the oropharynx) around the
center of gravity which is still comparatively much
smaller than the entire axial slice. We select such a
value of r to make sure that our selected area must
consist of different intensity clusters (pharyngeal air
column, wall, and surrounding tissues) which help
MultiOtsu thresholding (Liao et al., 2001) to delineate
pharyngeal air column from the surrounding objects
perfectly. The darkest class in the center of the slice
represents the air column of the pharynx. In few ax-
ial slices of retro-palatal region, two or three disjoint
regions may represent the pharynx. In these slices,
we consider all dark regions lying within the radius
of the pharynx from the center of gravity of the ad-
jacent lower axial slice as a part of the pharynx. We
also update the center of gravity for the current slice.
Thereafter, we perform a morphological closing oper-
ation (Soille, 1999) to fill the remaining holes and cor-
rect the boundary irregularities. After completing all
steps of slice-wise refinement, the 3D pharynx object
is readily extracted for the analysis of the key region
of oropharynx that is believed to play an essential role
in sleep apnea.
4.5 Extraction of Retropalatal
Oropharynx
For obstructive sleep apnea syndrome analysis, we
need to extract the narrowest part of the oropharynx
from the retro-palatal region. Figure 6 shows the com-
plete structure of pharynx in red color for a typical
MRI dataset. However, not every acquired MRI vol-
ume is identically positioned with respect to the pa-
tient, such that the retro-palatal region can be located
at a variable position along the pharynx. Therefore,
we developed an automatic algorithm to identify and
extract the most important segment of the pharynx.
To achieve this task, we compute the central dif-
ferences of anteroposterior length of the pharyngeal
air column and find the axial slice having the maxi-
mum value of central difference. Figure 7 shows the
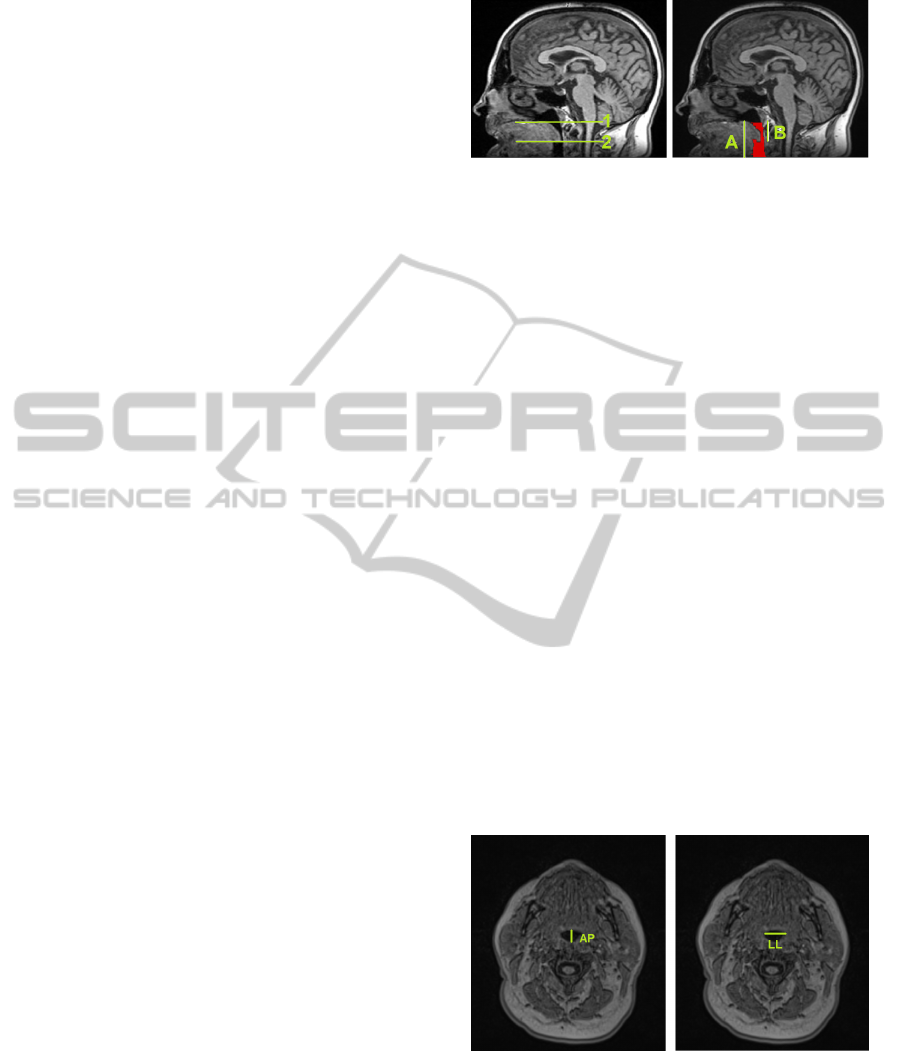
Figure 6: Left: Lines 1 and 2 represent high and low retro-
palatal oropharynx region levels respectively. Right: Line
segments A and B represent the complete pharynx and the
retro-palatal region of oropharynx respectively.
anteroposterior length of the pharyngeal air column.
We notice that the starting low retro-palatal
oropharynx axial slice has the maximum central dif-
ference value due to the presence of soft palate which
is absent in the adjacent lower slice. This fact is
clearly shown in Figure 6. Moreover, we also con-
sider the condition that the anteroposterior length of
the pharyngeal air column should not be greater than
10mm (Daniel et al., 2007) to confirm that we are op-
erating in the low retro-palatal region.
We can also find a selection criterion for the last
slice of high retro-palatal oropharynx region where
it meets the nasopharynx region. When observing
a sudden change in the area of the pharynx, the na-
sopharynx region starts. We stop our process of in-
cluding axial slices as a part of the oropharynx when
the central difference of area becomes greater than 50
mm
2
. In addition to this, we also consider the condi-
tion that the anteroposterior length of the pharyngeal
air column should be greater than 15 mm to confirm
that we are operating in the high retro-palatal region.
By applying these criteria, we extract the retro-palatal
oropharynx region that is relevant to analyze the ob-
structive sleep apnea syndrome.
Figure 7: AP and LL line segments represent Anteropos-
terior and Laterolateral Dimensions of Pharyngeal Air Col-
umn respectively.
5 RESULTS AND COMPARISON
The proposed segmentation pipeline has been tested
AutomaticPharynxSegmentationfromMRIDataforObstructiveSleepApneaAnalysis
605

on ten datasets; each dataset represents a separate sub-
ject. The processing for each dataset with a resolution
176 × 256 × 176 takes less than half of a minute on a
computer with Intel Core i5 2.67 GHz CPU with 4 GB
RAM. The parameter settings have been preselected
and no additional parameter tuning is required. The
segmentation results are evaluated using four mea-
sures: false negative volume fraction (FNVF), false
positive volume fraction (FPVF), true positive volume
fraction (TPVF), and Dice coefficient (DICE). These
metrics are based on voxel ratios. Let C
auto
and C
exp
denote the binary masks produced by our pipeline and
the expert delineation, correspondingly. Then FNVF,
FPVF, TPVF and DICE are defined as follows
FNV F =
|C
exp
−C
auto
|
|C
exp
|
T PV F =
|C
exp
∩C
auto
|
|C
exp
|
FPV F =
|C
auto
−C
exp
|
|C
exp
|
DICE =
2 ∗ |C
exp
∩C
auto
|
|C
exp
| + |C
auto
|
These four metrics are calculated according to the
given formulas and presented in Table 3 so that au-
tomatic segmented results can be compared to the
expert-defined ground truth for ten different datasets.
Higher values of DICE and TPVF fraction represent
better results, whereas lower values of FPVF and
FNVF represent better results. For ideal results, we
would have 100% results in terms of DICE and TPVF
fractions and 0% in terms of FPVF and FNVF frac-
tions. We compare the results to the semi-automatic
pharynx segmentation approach by Ivanovska et al.
(2013).
Table 3: Comparison of all masks against expert1s mask in
terms of four metrics mean values.
Masks
DICE TPVF FNVF FPVF
(%) (%) (%) (%)
Expert2 91.6 93.1 6.9 10.1
Ivanovska 89.4 85.8 14.2 6.3
Automatic 89.0 91.9 8.1 14.6
As it can be seen in Table 3, our approach pro-
duces results with high TPVF (mean value is around
92%) and low FNVF (mean value is close to 8%). The
Dice coefficient is about 89%. However, the false
positive rate is about 15%, which can be partially
explained by the fact that we observed experts error
in delineating pharynx in the expert-defined ground
truth. Therefore, we obtained another ground truth by
manual segmentation of a different medical expert for
the same subjects, in order to understand the amount
and character of variations better. We measure same
quality metrics for our segmentation results against
the second ground truth and present the values in Ta-
ble 4.
We also compare both ground truths against each
other using these four quality metrics and show the
intra-observer variability in Table 3 and Table 4.
Table 4: Comparison of all masks against expert2s mask in
terms of four metrics mean values.
Masks
DICE TPVF FNVF FPVF
(%) (%) (%) (%)
Expert1 91.6 90.4 9.7 6.8
Ivanovska 89.5 86.9 13.1 5.3
Automatic 88.7 93.0 7.0 17.0
The comparison of experts ground truth segmenta-
tions to the automatic results reveals the fact that man-
ual extraction of the pharynx is not much more accu-
rate than the automatic segmentation pipeline. The
human error is due to the voxels on the boundary of
pharyngeal air column which are affected by partial
volume. The ambiguous boundary emphasizes the
subjectivity of the human experts. In addition to this,
pharynx is present only partially in the MRI head vol-
ume, i.e., the pharyngeal parts of each subject differs
in size, which also might cause the variations in re-
sults. The total volume of the visible pharyngeal part
is quite low: on average it accounts to about 2,000
to 4,500 voxels, so minor variations such as 20 to
30 voxels per slice produce significant false positive
or false negative errors. Moreover, our datasets are
subject to strong artefacts in the bottom slices. Fur-
thermore, low contrast and inhomogeneity artefacts of
datasets are main cause of high false positive errors.
A comparison with other existing pharynx seg-
mentation algorithms (other than Ivanovska et al.) is
difficult due to different imaging modalities (X-ray
CT Scan and Cone-beam CT Scans) and inconsis-
tently used quality metrics. For example, Cheng et
al. (2007) proposed a pipeline for upper airways ex-
traction from the CT data, but no accuracy measures
were reported. Liu et al. (2003) described a semi-
automatic framework for MRI data and claimed a
higher accuracy for their approach. However, they
need more user involvement in the processing and
the total processing time is longer. Ivanovska et al.
(2013) also presented a semi-automatic pharynx seg-
mentation technique for MRI datasets, in which seed
points have to be selected manually. We calculated
these qualitative metrics for their technique and val-
ues are presented in Table 3 and Table 4. For easier
comparison of the results, we also show the graphs in
VISAPP2015-InternationalConferenceonComputerVisionTheoryandApplications
606
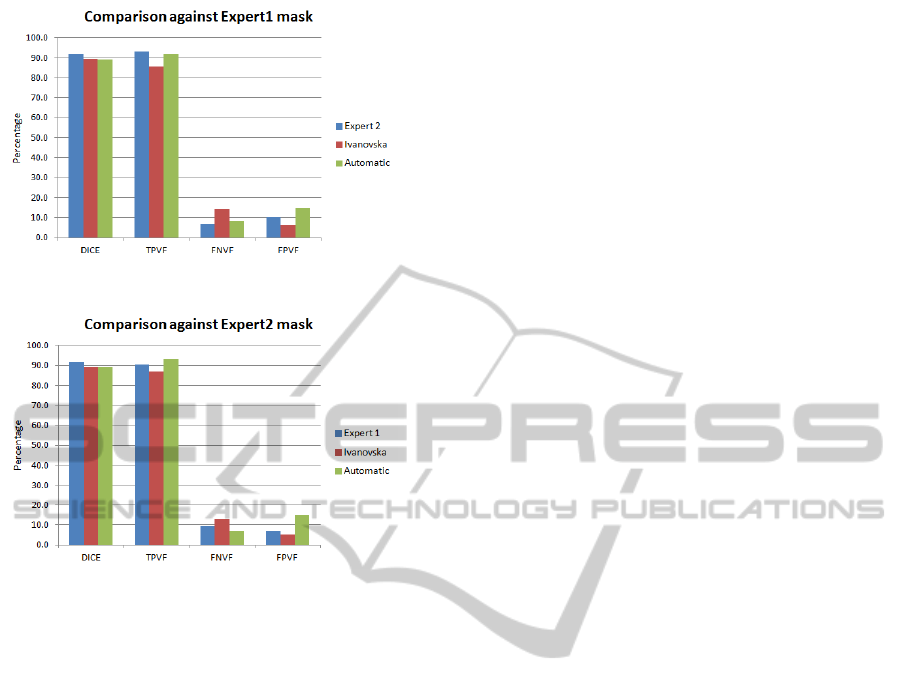
Figure 8: Graph showing results against Expert 1 mask.
Figure 9: Graph showing results against Expert 2 mask.
Figure 8 and Figure 9.
Our results are comparable in terms of accu-
racy with the other approach. However, Ivanovskas
segmentation technique takes nearly more than one
minute on our system, i.e., our proposed technique
is about two times faster. Secondly, our technique
is fully automatic requiring no user input, while her
technique is semi-automatic.
Finally, the results of manual, semi-automatic and
fully automatic segmentation algorithms support our
argument that we are facing a limitation in practice
due to the subjectivity in the manual segmentation of
the pharynx. With our fully automatic method we aim
to address this problem and ensure accurate and re-
peatable segmentation results.
6 CONCLUSION AND FUTURE
WORK
We presented a fast and fully automatic segmen-
tation technique for pharynx extraction from head
MR images. The procedure consists of pre-
processing, object-based image analysis, and retro-
palatal oropharynx extraction. The method is fast,
as the whole processing takes less than half a minute
for one dataset. The approach has been tested on ten
random datasets. The proposed approach produces
sufficiently reliable and good results and has poten-
tial to be applied for the analysis of numerous data
in epidemiological studies such as SHIP to describe
the pathogenesis of the obstructive sleep apnea syn-
drome. Our approach could also be easily integrated
in clinical practice.
Our complete segmentation technique works well
for extracting pharynx and our main idea of segmenta-
tion in two steps can be applied in many medical prob-
lems especially for segmenting organs. The two-step
segmentation method consists of a coarse segmenta-
tion using intensity clustering as a first step and refine-
ment on local region using MultiOtsu thresholding as
second step after having identified the correct region
using a classification in a multidimensional feature
space.
As future work, we plan to extend the algorithm
for segmentation of other soft tissues in the throat,
namely, fat pads. The main priority for future work
is to make the procedure as general as possible such
that it can be applied to different modalities and im-
ages.
ACKNOWLEDGEMENTS
We would like to thank the Higher Education Com-
mission (HEC) Pakistan and the University of En-
gineering and Technology Taxila, Chakwal campus,
Pakistan, and the DAAD for providing funding to
carry out this research to find the pathogenesis of
Obstructive Sleep Apnea public health problem. We
are also thankful to the Visualization and Computer
Graphics Laboratory (VCGL) research group of Ja-
cobs University, Bremen, Germany, for valuable sug-
gestions and remarks. Finally, we are really grateful
to our medical experts team and other members from
the University of Greifswald, Germany, for their col-
laboration in this project.
REFERENCES
Andrysiak, R., Frank-Piskorska, A., Krolicki, L., Mianow-
icz, J., Krasum, M., and Ruszczynska, M. (2001). Mri
estiamtion of upper airway in patients with obstructive
sleep apnea and its correlation with body mass index.
In The proceeding of 87th scientific assemly and an-
nual meeting, RSNA01, page 245. RSNA.
Berry, R. B., Budhiraja, R., Gottlieb, D. J., Gozal, D.,
Iber, C., Kapur, V. K., Marcus, C. L., Mehra, R.,
Parthasarathy, S., Quan, S. F., et al. (2012). Rules for
scoring respiratory events in sleep: update of the 2007
AutomaticPharynxSegmentationfromMRIDataforObstructiveSleepApneaAnalysis
607

aasm manual for the scoring of sleep and associated
events. J Clin Sleep Med, 8(5):597–619.
Burger, W. and Burge, M. J. (2009). Principles of Digital
Image Processing. Springer.
Cheng, I., Nilufar, S., Flores-Mir, C., and Basu, A. (2007).
Airway segmentation and measurement in ct im-
ages. In Engineering in Medicine and Biology Society,
2007. EMBS 2007. 29th Annual International Confer-
ence of the IEEE, pages 795–799. IEEE.
Daniel, M. M., Lorenzi, M. C., Leite, C. d. C., and Lorenzi-
Filho, G. (2007). Pharyngeal dimensions in healthy
men and women. Clinics, 62(1):5–10.
Gonzalez, R. and Woods, R. (2008). Digital image process-
ing: Pearson prentice hall. Upper Saddle River, NJ.
Homeyer, A., Schwier, M., and Hahn, H. K. (2010). A
generic concept for object-based image analysis. In
VISAPP (2), pages 530–533.
Ivanovska, T., Buttke, E., Laqua, R., Volzke, H., and Beule,
A. (2011). Automatic trachea segmentation and evalu-
ation from mri data using intensity pre-clustering and
graph cuts. In Image and Signal Processing and Anal-
ysis (ISPA), 2011 7th International Symposium on,
pages 513–518. IEEE.
Ivanovska, T., Dober, J., Laqua, R., Hegenscheid, K., and
V
¨
olzke, H. (2013). Pharynx segmentation from mri
data for analysis of sleep related disoders. In Advances
in Visual Computing, pages 20–29. Springer.
Jolliffe, I. (2005). Principal component analysis. Wiley
Online Library.
Liao, P.-S., Chen, T.-S., and Chung, P.-C. (2001). A fast
algorithm for multilevel thresholding. J. Inf. Sci. Eng.,
17(5):713–727.
Liu, J., Udupa, J. K., Odhnera, D., McDonough, J. M., and
Arens, R. (2003). System for upper airway segmen-
tation and measurement with mr imaging and fuzzy
connectedness. Academic radiology, 10(1):13–24.
Lowe, A. and Fleetham, J. (1991). Two-and three-
dimensional analyses of tongue, airway, and soft
palate size. Atlas of the Difficult Airway. Norton ML,
Brown ACD, Eds. Mosby-Year Book, St. Louis, pages
74–82.
Lowe, A. A., Fleetham, J. A., Adachi, S., and Ryan, C. F.
(1995). Cephalometric and computed tomographic
predictors of obstructive sleep apnea severity. Amer-
ican Journal of Orthodontics and Dentofacial Ortho-
pedics, 107(6):589–595.
Lowe, A. A., Santamaria, J. D., Fleetham, J. A., and Price,
C. (1986). Facial morphology and obstructive sleep
apnea. American Journal of Orthodontics and Dento-
facial Orthopedics, 90(6):484–491.
Molchanov, V. and Linsen, L. (2014). Interactive design of
multidimensional data projection layout.
Pack, A. I. (2002). Sleep Apnea: Pathogenesis, Diagnosis
and Treatment. CRC Press.
Perona, P. and Malik, J. (1990). Scale-space and edge de-
tection using anisotropic diffusion. Pattern Analy-
sis and Machine Intelligence, IEEE Transactions on,
12(7):629–639.
Rousseeuw, P. J. (1987). Silhouettes: a graphical aid to
the interpretation and validation of cluster analysis.
Journal of computational and applied mathematics,
20:53–65.
Schwab, R. J., Pasirstein, M., Pierson, R., Mackley, A.,
Hachadoorian, R., Arens, R., Maislin, G., and Pack,
A. I. (2003). Identification of upper airway anatomic
risk factors for obstructive sleep apnea with volumet-
ric magnetic resonance imaging. American journal
of respiratory and critical care medicine, 168(5):522–
530.
Shapiro, L. G. and Linda, G. (2002). stockman, george c.
Computer Vision, Prentice hall. ISBN 0-13-030796-3.
Shaw, J. E., Punjabi, N. M., Wilding, J. P., Alberti, K.,
and Zimmet, P. Z. (2008). Sleep-disordered breath-
ing and type 2 diabetes: a report from the interna-
tional diabetes federation taskforce on epidemiology
and prevention. Diabetes research and clinical prac-
tice, 81(1):2–12.
Shi, H., Scarfe, W. C., and Farman, A. G. (2006). Upper
airway segmentation and dimensions estimation from
cone-beam ct image datasets. International Journal of
Computer Assisted Radiology and Surgery, 1(3):177–
186.
Soille, P. (1999). Morphological image processing: Princi-
ples and applications.
V
¨
olzke, H., Alte, D., Schmidt, C. O., Radke, D., Lorbeer,
R., Friedrich, N., Aumann, N., Lau, K., Piontek, M.,
Born, G., et al. (2010). Cohort profile: the study of
health in pomerania. International journal of epidemi-
ology, page dyp394.
Yang, M., Kpalma, K., Ronsin, J., et al. (2008). A survey
of shape feature extraction techniques. Pattern recog-
nition, pages 43–90.
VISAPP2015-InternationalConferenceonComputerVisionTheoryandApplications
608
