
Pre-processing Techniques to Improve the Efficiency of Video
Identification for the Pygmy Bluetongue Lizard
Damian Tohl
1
, Jim S. Jimmy Li
1
and C. Michael Bull
2
1
School of Computer Science, Engineering and Mathematics, Flinders University, South Road, Tonsley, SA, Australia
2
School of Biological Sciences, Engineering and Mathematics, Flinders University, Bedford Park, SA, Australia
Keywords: Video Identification, Pygmy Bluetongue Lizard, Curvature, DWT, SIFT.
Abstract: In the study of the endangered Pygmy Bluetongue Lizard, non-invasive photographic identification is
preferred to the current invasive methods which can be unreliable and cruel. As the lizard is an endangered
species, there are restrictions on its handling. The lizard is also in constant motion and it is therefore
difficult to capture a good still image for identification purposes. Hence video capture is preferred as a
number of images of the lizard at various positions and qualities can be collected in just a few seconds from
which the best image can be selected for identification. With a large number of individual lizards in the
database, matching a video sequence of images against each database image for identification will render
the process very computationally inefficient. Moreover, a large portion of those images are non-identifiable
due to motion and optical blur and different body curvature to the reference database image. In this paper,
we propose a number of pre-processing techniques for pre-selecting the best image out of the video image
sequence for identification. Using our proposed pre-selection techniques, it has been shown that the
computational efficiency can be significantly improved.
1 INTRODUCTION
The Pygmy Bluetongue Lizard is an endangered
species which was thought to be extinct for thirty
years. They are found exclusively in remnant
fragments of native grassland in South Australia’s
mid-north (Li et al, 2009), (Tohl et al, 2013),
(Staugas et al, 2013), (Schofield et al, 2013).
Identification of individual lizards is essential for
ecological studies. One commonly used method is
toe clipping. It is a highly invasive method whereby
digits are removed from the feet of the lizards. The
accuracy of this method can be affected by the fact
that natural toe and foot loss can occur in lizards in
nature (Hudson, 1996). Due to the Pygmy
Bluetongue Lizards endangered status, a non-
invasive identification method, such as photo
identification using the Scale Invariant Feature
Transform (SIFT) method (Lowe, 2004) is preferred.
As the Pygmy Bluetongue Lizard is an
endangered species, there are restrictions on the
amount of time a lizard can be captured for and the
amount of handling. The lizards are captured in the
field and placed in a Perspex box in which the video
is captured and measurements are taken. There is
little control over the lighting conditions and their
posture cannot be easily manipulated as the lizards
are alive and constantly moving. It is therefore
preferred to capture a video which is an image
sequence of the lizard. However, it is very
computationally inefficient to match every image in
the sequence with every image in the database using
SIFT, especially when the database could contain
over hundreds of lizards. A number of pre-
processing techniques are therefore proposed for
pre-selecting the best image out of the image
sequence of the video prior to identification of the
lizard using SIFT.
From our experimental observation, the accuracy
of SIFT identification depends on a number of
factors including the degree of sharpness of the
image and the difference of body curvature from the
reference image in the database. Due to both camera
and lizard movement and the time delay required to
refocus by the camcorder, some images will be non-
identifiable because of motion blur and out of focus.
To determine the degree of sharpness of an image,
the total energy of the high frequency components of
the image is evaluated, based on the fact that sharp
details contain high frequency components. The
623
Tohl D., Li J. and Bull C..
Pre-processing Techniques to Improve the Efficiency of Video Identification for the Pygmy Bluetongue Lizard.
DOI: 10.5220/0005317306230629
In Proceedings of the 10th International Conference on Computer Vision Theory and Applications (VISAPP-2015), pages 623-629
ISBN: 978-989-758-089-5
Copyright
c
2015 SCITEPRESS (Science and Technology Publications, Lda.)

discrete wavelet transform (DWT) was used to
obtain detail coefficients in the horizontal, vertical
and diagonal direction from which the total high
frequency energy was measured.
Moreover, the true positive rate can be improved
if the body curvature of the lizard is closer to that of
the reference image in the database. For uniformity,
all the reference images in the database are chosen to
have a straight body. As a result, the image with the
straightest body curvature out of the video sequence
is to be chosen for identification. For curvature
ranking, a series of morphological operations are
used to obtain the skeleton of the lizard, and an
index associated with the degree of curvature of the
main body line is then determined. The best image
for identification is selected by ranking the image
sequence of the video according to an index, which
is a combination of total high frequency energy and
body curvature measurement, for each image. The
best image selected from the video sequence in this
way will produce the strongest match using SIFT.
The organization of this paper is as follows.
Section 1 gives the introduction. In Section 2, the
method for preparing the video sequence images
prior to the pre-processing techniques is described.
In Section 3, the pre-processing techniques including
the high frequency energy and body curvature
measurements are illustrated. The real and simulated
experimental results are given in Section 4, and
Section 5 gives the conclusion.
2 IMAGE PREPARATION PRIOR
TO IDENTIFICATION
2.1 Lizard Image Segmentation
The first step in finding the best image from a video
sequence is to convert the lizard video into a
sequence of images. Interlaced video was captured
by a full high definition camcorder with a resolution
of 1920x1080 pixels. Since image identification
does not require such a high resolution and in order
to de-interlace the images, they are separated into
odd and even fields. To maintain the original aspect
ratio, the horizontal resolution of a field is scaled
down by half by averaging every two pixels to
produce one pixel so that the final resolution is
960x540 pixels. The averaging process is a part of
the filtering for down-sampling the image and
reducing any noise present and thus improving the
accuracy of identification. The total high frequency
energy of the de-interlaced image is then evaluated
for each field and the sharper one that has the higher
total high frequency energy value is selected to be
used in the video image sequence for identification.
The averaging process will have an effect on the
total high frequency energy, but will not affect the
ranking of the images. It has been experimentally
verified that this resolution is adequate for correct
identification.
Figure 1: The flow chart of the method to produce a
template to extract the lizard from the image background.
First of all, a binary template, , that contains
‘1’s where the lizard is located and ‘0’s everywhere
else is created to extract the lizard from the
background in order to reduce identification errors.
The method for producing the template and
extracting the lizard is shown in Fig. 1. The original
image, , is converted to a binary image,
, first by
thresholding as given by (1).
1,
0,
(1)
Figure 2: A single image from different sequences
recorded under varying lighting conditions, and the
corresponding histograms with the threshold value,
0.25.
It was found experimentally that 0.25 gave
the best value for isolating the lizard due to the fact
VISAPP2015-InternationalConferenceonComputerVisionTheoryandApplications
624

the lizard is made up of mainly darker pixels. From
Fig. 2, it can be seen in the image histograms that
the threshold value 0.25 is appropriate to isolate
the darker lizard object pixels under various lighting
conditions.
In order to smooth the boundaries of the objects
and also fill in any holes within the objects, a
morphological erosion, Θ, is performed on
in (2)
to create
.
Θ
(2)
where
111
111
111
is the structuring element.
To remove unwanted features at the edges of the
image, all other isolated objects located centrally,
including the lizard, are first removed by applying a
flood-fill morphological operation, , (Soille, 1999)
on
in (3) to replace ‘0’s by ‘1’s to produce
.
The flood-fill morphological operation will replace
‘0’s with ‘1’s for those isolated background pixels
within the image.
(3)
The resulting image,
, will now contain unwanted
features at the edges without the lizard and can be
used as a template to remove the unwanted features
in which it contains by (4).
(4)
As a number of centrally located objects, including
the lizard, are still remaining in the image, the lizard
must be identified for extraction.
is first dilated
to smooth out edges and fill in any holes by (5) as
follows.
⨁A
(5)
where ‘⨁’ denotes morphological dilation.
Each image object,
, is then identified by
searching for any 8-edge connected components in
. Due to the scale pattern of the lizard, the object
which relates to the lizard in the binary image has a
region with a large fluctuation of black and white
pixels, whereas other objects in the image are mostly
homogenous regions with black pixels. Therefore
the object in the binary image with the largest
number of ‘1’ pixels will be considered as the lizard.
An array multiplication (i.e. element-by-element
multiplication), denoted by, ‘.*’, is performed
between each object,
, and
, and the number of
‘1’ pixels is recorded as
, as given by (6).
∑
,
.∗
,
,
(6)
The object that represents the lizard is considered
to be
such that
is the maximum of
where
1,2,…,, and is the total number of objects.
This object can be used as the template image
given by (7).
:
1,2,…,;1
(7)
The final lizard image,
, which has the
background removed, is the result of an array
multiplication of and , as given by (8).
.∗
(8)
3 BEST IMAGE SELECTION
CRITERIA FOR
IDENTIFICATION
3.1 High Frequency Energy
Measurement
The discrete wavelet transform (DWT) is used to
extract a value for the total high frequency energy of
each image in the sequence. The one-dimensional
scale function of the Haar family is defined as
shown in (8), and the wavelet expression is given by
(10).
ϕ
t
1, 0t1
0, otherwise
(9)
ψ
t
1, 0t
1
2
1,
1
2
t1
0, otherwise
(10)
The Haar wavelet is used to obtain the detail
coefficients in the horizontal, vertical and diagonal
directions,
,
, and
respectively. The sub-
band image, , is the approximation coefficients, but
is only required for DWT calculation at the next
scale. Fig. 3 shows the results of the wavelet
transform, where the upper left quadrant corresponds
to the approximation coefficients and the other
quadrants correspond to the detail coefficients.
The amount of energy is calculated based on the
Parseval Theorem, by the fact that the energy
contained in the image is equal to the summation of
the energy contained in the different resolution
levels of the wavelet transform (Mallat, 1999).
As a result, the total high frequency
corresponding to the detail coefficients is evaluated
by (11) (Oliveira et al, 2010) as follows:
(11)
To normalize the total high frequency energy, F,
so that it does not depend on the size of the image
Pre-processingTechniquestoImprovetheEfficiencyofVideoIdentificationforthePygmyBluetongueLizard
625
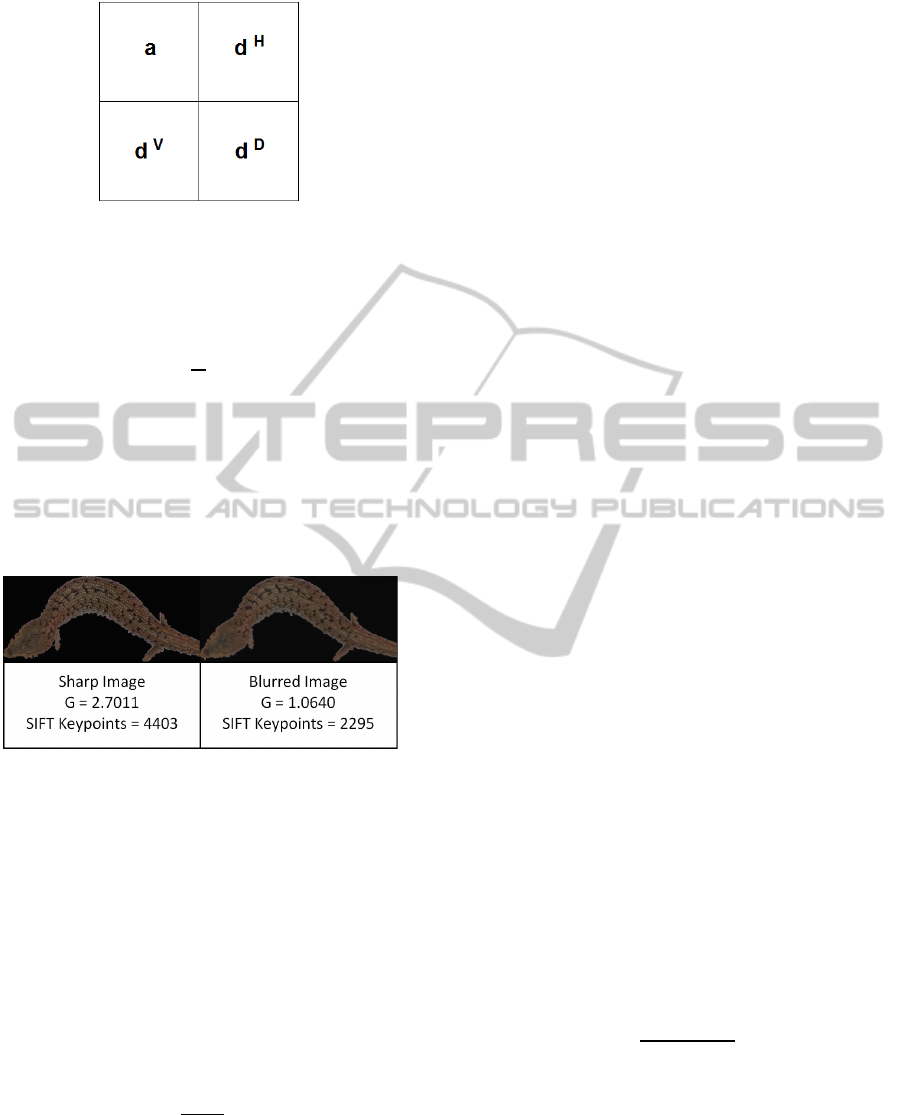
Figure 3: Two-dimensional wavelet coefficients.
for comparison, it is divided by the size, which is the
total number of pixels, , in the lizard, as given by
(12).
(12)
where is the normalized total high frequency
energy.
An example of the total high frequency energy
for a sharp image and a blurred image from the same
image sequence is shown in Fig.4, it can also be
seen that the number of SIFT keypoints is reduced in
the blurred image.
Figure 4: A side by side comparison of a sharp and blurred
image from the same sequence with the resulting total
high frequency energy and SIFT keypoints.
Let
be the normalized total high frequency
energy of the
image in the sequence. To further
normalize the value of
between 0 and 1 so that it
can be combined with its curvature index for
ranking, each
value is divided by
, where
where 1,2,…, and is the
total number of images in the sequence.
The normalized total high frequency index of the
image,
, in the sequence is given by (13) as
follows:
(13)
3.2 Curvature Index for Lizard Body
3.2.1 Limb Removal
An index associated with the degree of curvature of
the lizard is also used to rank the best image. To
determine the index, a line, representing the middle
line of the body and limbs of the lizard must first be
produced. This is achieved by applying a
morphological dilation, ⨁, on the template and then
follows by a morphological thinning operation, ,
(Lam, Seong-Whan and Ching, 1992) in (14), to
reduce its line thickness to a single pixel width
producing the main body line, .
⨁
(14)
As the curvature of the main body is only
relevant, the lines that represent the limbs of the
lizard in the main body line, , have to be removed.
In order to remove these limb lines, the intersection
points are located and found. A square window
centred at each intersection point is used to find the
pixels that correspond to each line. For example, Fig
5(a) shows a square window centred at an
intersection point. It has been experimentally found
that a window size of 7x7, is suitable for our
application. If the window size is larger than 7x7,
too many unwanted pixels will be included, and the
errors produced would lead to a higher false positive
rate. If the window size is smaller than 7x7, it is
impossible to discriminate between the main body
line and the limb.
To discriminate the main body line from the limb
line, the pixels at the boundary of the square window
together with the centre point, are used to construct
three lines, as shown in Fig 5(b) and 5(c). If there
are two connected pixels as shown in the top left
corner of Fig 5(a), the pixel furthest from the centre
is used. Each of the three lines has two angles
associated with it, as shown in Fig. 5(c). Those
angles can be determined using the cosine rule by
(15). The line which has the smallest sum of angles
is identified as the limb and is removed as shown in
Fig. 5(d).
cos
a
b
c
2ab
(15)
This process is repeated at each branchpoint until
all the limb lines are removed to obtain the image,
. An example of the process used for limb removal
is shown in Fig. 6.
VISAPP2015-InternationalConferenceonComputerVisionTheoryandApplications
626
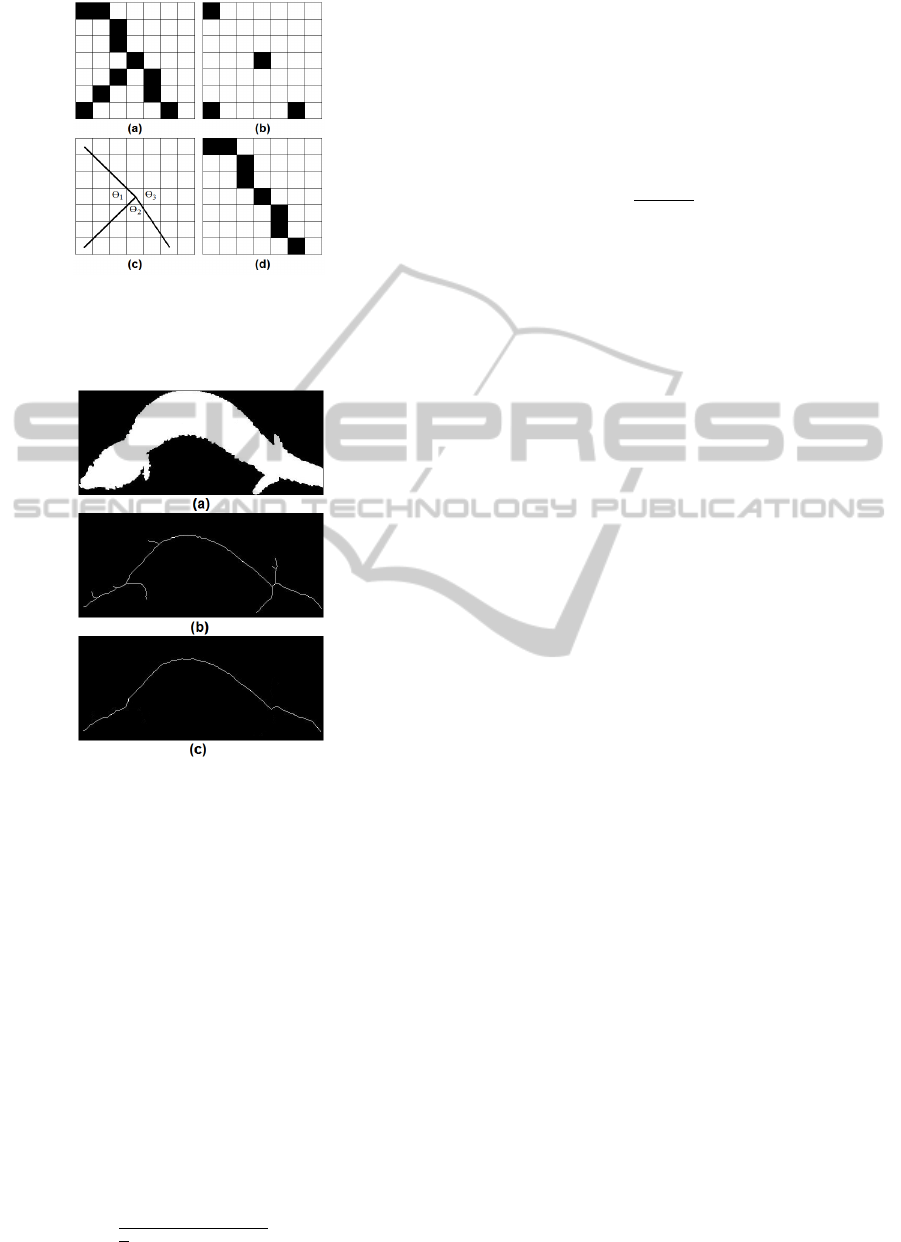
Figure 5: (a) The 7x7window centred at an intersection
point. (b) The pixels used to draw the lines. (c) The three
lines and the corresponding angles. (d) The result after the
line with the smallest sum of angles is removed.
Figure 6: (a) The lizard template, T. (b) The main body
line, S, after morphological thinning has been performed.
(c) The resulting image, S
l
, after limb removal.
3.2.2 Curvature Index
Variance is used to calculate the curvature index.
The endpoints of,
, are found and the curve is
rotated so that the line between the end points is
horizontal.
The curvature index, , is evaluated by the
normalized variance of the curve given by (16),
where
is the height of the curve at ,
is the
position at ,
is the position at which
is
maximum and is the total number of elements in
the curve. A lower variance value implies greater
curvature of the lizard body. For a perfectly straight
body, the normalized variance will give a value of
unity.
∑
∑
∑
z
(16)
3.3 Best Image Selection
To select the best image from the sequence, the
normalized total high frequency energy index is
combined with the curvature index for the
image
using the harmonic mean equation given in (17) to
generate a combined index value,
.
(17)
where
and
are the normalized total high
frequency energy and curvature indices of the
lizard image in the video sequence respectively.
The image with the largest combined index value
in the image sequence is the best image chosen
for identification.
By using the harmonic mean, both the
normalized total high frequency energy index and
the curvature index must be comparably large in
order to give a large combined value of
for a high
ranking. If either one has a low value, the combined
index will still be low and will remain low in the
ranking.
4 RESULTS
4.1 High Frequency Energy
Measurement
Experiments show that the number of SIFT keypoint
matches is affected by the degree of blurring in an
image. Both Gaussian and motion blur were tested
by simulating the two different types of blurring on
an image from the video sequence. The degree of
blurring was simulated by gradually increasing the
radius for Gaussian blur and by increasing the length
for motion blur.
Table 1 shows the results of the blur simulation
on a single image from a video sequence. In both
cases, as the degree of blurring is increased, the
number of SIFT matches decreases.
4.2 Curvature Index
It was found experimentally that for the strongest
match, the body curvatures between the candidate
and the reference lizard needs to be similar. Fig. 7
shows a database image on the left with different
examples of body curvature in the images from a
single sequence. The lizards with the straighter
bodies that match the database image give a higher
number of SIFT matches.
Pre-processingTechniquestoImprovetheEfficiencyofVideoIdentificationforthePygmyBluetongueLizard
627
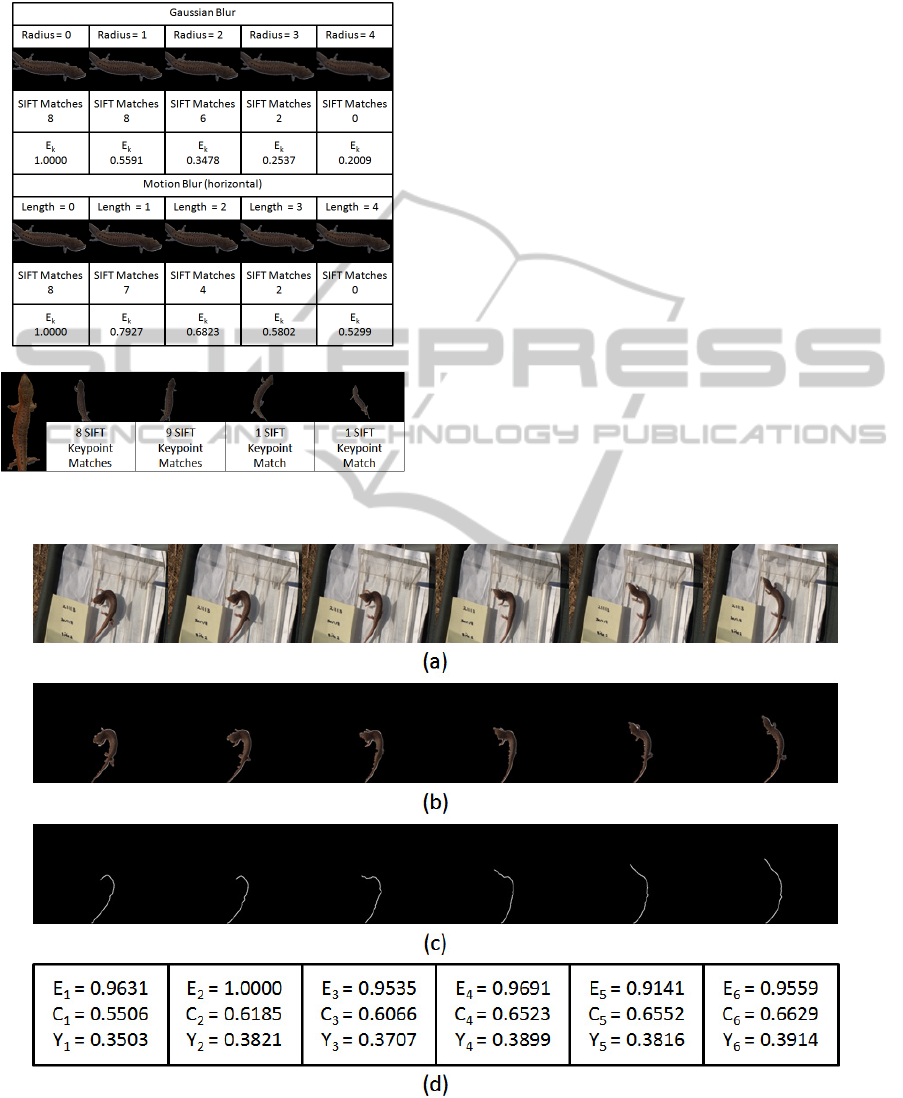
Table 1: Simulated Gaussian and motion blur with the
corresponding number of SIFT matches and the
normalized total high frequency energy,
.
Figure 7: Examples of body curvature from a single image
sequence versus the number of SIFT matches.
4.3 Best Image Selection
An example of an image sequence is shown in Fig.
8(a) and the images with the background removed
and the main body line are shown in Fig. 8(b) and
Fig. 8(c) respectively. The values for total high
frequency energy and the curvature index for each
image are shown in Fig. 8(d). From this example, it
is obvious that
has the highest index value and
would be used for identification.
In Fig. 8(c), it can be seen that the limb removal
algorithm can produce a good approximation of the
main body line for the evaluation of the curvature
index for each lizard.
Table 2 gives the total time taken to process the
complete video sequence of 150 images
(approximately six seconds of video) using SIFT for
finding a match verses the total time using our
proposed method. It took approximately 1092
seconds to process the complete video sequence of
images using SIFT while our proposed method took
only 512 seconds on average to find a match from
the video sequences. This is equivalent to cutting
half the processing time. The experiments were
performed on a windows 7 computer running an
Intel Core i7 CPU @ 1.87Ghz with 8GB RAM.
Figure 8: (a). An example of an image sequence. (b) The images after background removal. (c) The main body lines used
for the curvature index. (d) The total high frequency energy, the curvature index and the resulting combined index values
used for selecting the best image.
VISAPP2015-InternationalConferenceonComputerVisionTheoryandApplications
628
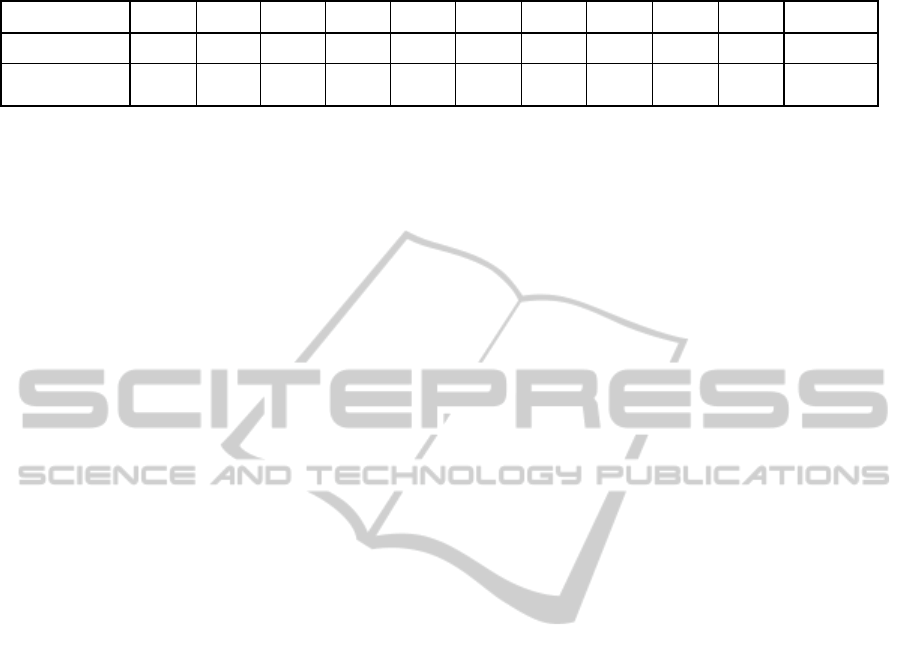
Table 2: Processing time for an image sequence of 150 images (seconds).
Sequence 1 2 3 4 5 6 7 8 9 10 Average
SIFT 1285 864 698 694 1171 1107 1191 1283 1310 1313 1092
Our Proposed
Method 587 456 465 492 552 538 534 537 541 472 512
5 CONCLUSIONS
Pre-processing techniques to improve the efficiency
of video identification for the Pygmy Bluetongue
lizard using SIFT have been developed and found to
reduce the time by half for finding a match. This will
improve the efficiency for the identification process
used for the continuing study of the endangered
lizards and other species.
REFERENCES
J. S. Jimmy Li, D. Tohl, S. Randhawa, L. Shamimi, C.M.
Bull, 2009, “Non-invasive Lizard Identification using
Signature Curves,” 2009 IEEE Region 10 Conference
(TENCON 2009), pp. 1-5.
D. Tohl, J. S. Jimmy Li, L. Shamimi, C. M. Bull, 2013,
“Image Asymmetry Measurement for the Study of
Endangered Pygmy Bluetongue Lizard”.
E. J. Staugas, A. Fenner, M. Ebrahimi, C. M. Bull, 2013,
“Artificial burrows with basal chambers are preferred
by pygmy bluetongue lizards, Tiliqua adelaidensis,”
Amphibia-Reptilia, vol. 34(1), pp. 114-118.
J. Schofield, M. G. Gardner, A. Fenner, C. M. Bull, 2013,
“Promiscuous mating in the endangered Australian
lizard Tiliqua adelaidensis: a potential windfall for its
conservation,” Conservation Genetics.
S. Hudson, 1996, “Natural toe loss in southeastern
Australian skinks: implications for marking lizards by
toeclipping,” Journal of Herpetology, No. 30, pp. 106-
110.
David G. Lowe, 2004, Distinctive image features from
scale-invariant keypoints. Int. J. of Comp. Vis.,
60(2):91–110.
P. Soille, “Morphological Image Analysis: Principles and
Applications,” Springer-Verlag, pp. 173-174. 1999.
S. Mallat, 1999, “A wavelet tour of signal processing,”
San Diego: Academic Press, p. 637.
E. F. Oliveira, A. G. C. Bianchi, L. Martins-Filho, R. F.
Machado, 2010, “Granulometric analysis based on the
energy of Wavelet Transform coefficients,” Ouro
Preto, vol. 63(2), pp. 347-354.
L. Lam, L. Seong-Whan, Y.S. Ching, 1992, "Thinning
Methodologies-A Comprehensive Survey," IEEE
Transactions on Pattern Analysis and Machine
Intelligence, vol. 14, no. 9, pp. 879.
Pre-processingTechniquestoImprovetheEfficiencyofVideoIdentificationforthePygmyBluetongueLizard
629
