
Non-Invasive Estimation of Blood Pressure through Genetic
Programming
Preliminary Results
Giovanna Sannino
1,2
, Ivanoe De Falco
1
and Giuseppe De Pietro
1
1
ICAR- CNR, Via P. Castellino 111, 80131 Naples, Italy
2
University of Naples Parthenope, Department of Technology, Naples, Italy
Keywords: Blood Pressure, Wearable Sensors, Heart Rate Variability, Plethysmography, Regression, Genetic
Programming.
Abstract: The hypothesis underlying this paper is that a nonlinear relationship exists between Electrocardiography
(ECG) and Heart Related Variability (HRV) parameters, plethysmography (PPG), and blood pressure (BP)
values. If this hypothesis is true, rather than continuously measuring the patient’s BP, a wearable wireless
PPG sensor can be applied to patient’s finger, an ECG sensor to his/her chest, HRV parameter values can be
computed and, through regression, both systolic and diastolic BP values can be indirectly measured. Genetic
Programming (GP) automatically both evolves the structure of the mathematical model and finds the most
important parameters in it. Therefore, it is perfectly suited to perform regression task. As far as it can be
found in the scientific literature of this field, until now nobody has ever investigated the use of GP to relate
parameters derived from HRV analysis and PPG to BP values. Therefore, in this paper we have carried out
preliminary experiments on the use of GP in facing this regression task. GP has been able to find a
mathematical model expressing a nonlinear relationship between heart activity, and thus ECG and HRV
parameters, PPG and BP values. The approximation error involved by the use of this method is lower than 2
mmHg for both systolic and diastolic BP values.
1 INTRODUCTION
Arterial blood pressure can be continuously
measured in real time and with no patient’s body
cannulation by means of the continuous non-
invasive arterial pressure (CNAP) method.
This method shows the positive features of two
clinical “gold standards”: firstly, blood pressure
(BP) is continuously measured in real time as it
takes place in the invasive arterial catheter system
(IBP), secondly it is non-invasive as it is the case for
the standard procedure based on upper arm
sphygmomanometer (NBP). Recently, results have
been promising in this field as concerns the features
of ease of use, accuracy, and clinical acceptance.
Currently a high demand exists for accurate and
easy-to-use CNAP-systems. Because of this, there is
an increasing focus on these devices by researchers,
practitioners and the related industry of medical
devices. The development of efficient BP
measurement instruments is facilitated by the use of
small yet powerful microcomputers, and by that of
digital signal processors as well. Small, cheap
devices of this kind allow for an easy processing of
complex and computationally intensive
mathematical functions. Researchers (Maguire,
2011) (von Skerst, 2008) have reported that invasive
catheters are used to continuously measure BP in
only a small fraction, between 15% and 18%, of
inpatient surgeries. The practical standard of care for
all the remaining inpatient surgeries, and for
outpatient surgeries as well, is, instead, constituted
by intermittent, non-invasive blood pressure
monitoring. Unfortunately, this latter monitoring
type has the feature of being discontinuous, which
implies possibly missing some dangerous
hypotensive episodes. As an example, when
monitoring women undergoing Caesarean section,
hypotensive phases were detected by CNAP in 39%
of the cases, but only in 9% by non-invasive
methods. As a further example, (Ilies, 2012) reports
that, when CNAP was used to measure systolic BP
values higher than 100mmHg, dangerous foetal
acidosis did not occur. Moreover, (Dueck, 2006)
241
Sannino G., De Falco I. and De Pietro G..
Non-Invasive Estimation of Blood Pressure through Genetic Programming - Preliminary Results.
DOI: 10.5220/0005318002410249
In Proceedings of the International Conference on Biomedical Electronics and Devices (SmartMedDev-2015), pages 241-249
ISBN: 978-989-758-071-0
Copyright
c
2015 SCITEPRESS (Science and Technology Publications, Lda.)

reports that more than 22% of hypotensive episodes
were missed, thus leading to delayed treatments or
even no treatments at all.
Of course, it is very difficult to detect in-artery
pressure changes from outside the arteries
themselves, while it is quite easy to measure changes
in artery volume and flow. This can be accomplished
through the use of e.g. echography, light,
impedance, and so on. The problem is that there is
no linear correlation between these changes in
volume and the arterial pressure, especially when the
measurement takes place in the periphery, where it is
easier to access the arteries.
As a consequence, non-invasive devices must be
able to transform the volume signal measured at the
periphery into a corresponding for the arterial
pressure. Some techniques are based on vascular
unloading, tonometry, pulse transit time (PTT). This
latter relies on the fact that, each time a heart ejects
stroke volume towards arteries, the BP wave reaches
the periphery after a given transit time. PTT has an
indirect dependence on BP, namely it is known that
the higher the pressure, the faster PTT is. The non-
invasive detection of blood pressure changes can be
carried out thanks to this phenomenon (Sotera
wireless). The method has to be calibrated in order
to get absolute values. PTT-based techniques are
good examples of indirect ways for continuously
measuring blood pressure. In them, a measure is
continuously taken of other parameters, and a non-
linear relationship is hypothesized.
In the knowledge discovery area any problem as
this latter, in which a relationship between some
variables, called independent, and another one,
called dependent, is supposed, and the aim is to
search for the explicit form of the mathematical
model connecting them, is termed as a regression
problem. The term “independent” simply means that
these variables are the input variables to the
problem, and this does by no way imply that they are
not correlated one another. In traditional regression
analysis the user must specify the structure of the
mathematical model. Hypothesizing or
experimentally finding a good model is a very
laborious and time-consuming trial-and-error
procedure, and human minds may experience
difficulties in guessing which the most important
independent variables affecting the dependent one
are, and which the best formula relating them is.
Genetic Programming (GP) (Koza, 1992),
instead, automatically both evolves the structure of
the mathematical model and finds the most
important parameters in it. Therefore, it is perfectly
suited to perform regression task.
Nowadays wearable sensors are becoming more
and more widespread and cheap. Among them, chest
sensors able to capture electrocardiographic (ECG)
signals are frequently used. Starting from an ECG
signal, Heart Rate Variability (HRV) analysis can
easily extract a wide set of parameters describing
ECG activity of a patient. Moreover, wearable
wireless sensors can be applied to a patient’s finger
to compute plethysmography (PPG) values.
The hypothesis underlying this paper is that a
nonlinear relationship exists between PPG and heart
activity (and thus ECG and HRV parameters), and
blood pressure. If this hypothesis is true, rather than
continuously measuring the patient’s blood pressure,
a wearable wireless PPG sensor can be applied to
patient’s finger, a wearable wireless ECG sensor to
his/her chest, HRV parameter values can be
computed and, through regression, systolic and
diastolic blood pressure can be indirectly measured.
As far as it can be found in the literature of this
field, until now nobody has ever investigated the use
of GP to relate parameters derived from HRV
analysis and PPG to BP values. Therefore, in this
paper we carry out some preliminary experiments on
the use of GP in facing this regression task.
2 RELATED WORKS
Some papers exist in which the aim is the
investigation of the relationship between the blood
pressure and some other variables. In the following,
some of those papers are shortly described.
In (Meigas, 2007) the BP estimation method
relies on the hypothesis that a relationship exists
between the pulse wave velocity (PWV) in the
arteries and BP. Measuring PWV requires
registering two time markers. The first marker
depends on ECG R peak detection, whereas the
second on detecting the pulse wave in peripheral
arteries. Their experimental device for BP
monitoring is made of two analogue modules for the
acquisition of signals, namely one for ECG and
another for PPG signal. Namely, the ECG electrodes
are positioned on patient’s wrists, while a pulse
oximetry finger to register PPG is placed on a finger.
In (Najjar, 2008) the aim was the evaluation of
whether PWV can reliably predict the longitudinal
changes in systolic BP (SBP), and the incident
hypertension. The authors measured PWV at
baseline in 449 volunteers, partly normotensive and
partly untreated hypertensive. Their average age was
53±17. BP measurements were repeatedly carried
out during an average follow-up of 4.9 ± 2.5 years.
BIODEVICES2015-InternationalConferenceonBiomedicalElectronicsandDevices
242

By considering covariates such as body mass index,
age, and mean arterial pressure, the authors applied
linear mixed effects regression models, and
concluded that PWV can independently determine
the longitudinal SBP increase.
In (Inajima, 2012) an attempt was made to
design and build a wearable sensor for BP
measurement. This sensor should have the features
of placing a lower burden on the examinees, of
being less influenced by patient’s physical
movements, and of being usable to continuously
measure BP. They modified the existing Moens-
Korteweg BP equation by hypothesizing that the
following relation exists: P
s
= b
1
/ T
PTT
2
+ b
2
,
where TPTT is the pulse-wave transit time, Ps is the
systolic BP, and coefficients b1 and b2 can be
derived by using measured values of an examinee’s
BP and measured values of T
PTT
. They implemented
a new system for the calculation of patient’s systolic
BP. This system made use of electrocardiography
and ear-lobe pulse waves. Through this system they
were able to estimate patients’ BP, and to also
directly measure patient’s arterial pressure. They
found that their methodology was able to correctly
capture trends in the variations in BP.
In (Gesche, 2012) the aim was the creation of a
function able to link SBP and PWV, and the testing
of its reliability in determining suitable absolute SBP
values by using a non-linear algorithm and a one-
point calibration. They asked 63 volunteers to
exercise to induce BP increase, and obtained this
nonlinear function: BP
PTT
= P1 * PWV * e
(P3*PWV)
+
P2 * PWV
P4
– (BP
PTT,cal
- BP
cal
), with P1 = 700, P2 =
766,000, P3 = -1, and P4 = 9. BP
PTT,cal
is the BP
value, computed from PTT, corresponding to the BP
value measured by the reference method, while BP
cal
is the BP measured by the reference method (cuff) at
experiment beginning. This non-linear function was
used to compute BP values. Comparing SBP values
using the PTT-based method and those measured by
cuff resulted in a significant correlation.
This brief review shows that researchers are
striving to find a suitable relationship between
independent and dependent variables, yet this is
done at a high cost in terms of labour, time, and
experiments to find the values of the coefficients.
3 SIGNAL PROCESSING
The regulation of BP is traditionally described in
terms of homeostasis (Vukovich & Knill, 1980).
This is regulated by the autonomic nervous system
(ANS) due to two opposing divisions:
the sympathetic division and the parasympathetic
division. Heart rate variability (HRV) is a tool that
represents the balance between the sympathetic and
parasympathetic branches of the autonomic nervous
system. As shown in many studies (Berntson et al.,
1997; Electrophysiology et al., 1996; Karapetian,
Evaluation, & Research, 2008), HRV is considered
one of the most studied non-invasive biomarkers of
ANS activities, and it can be extracted by using a
wearable ECG sensor.
Furthermore, as demonstrated in (Golparvar,
Naddafnia, Saghaei, & Mahmood, 2002), the PPG is
a simple and low-cost optical technique that can be
used to detect blood volume changes in the micro-
vascular bed of tissue. The PPG is a physiological
waveform related to the sympathetic nervous system
activity (Allen, 2007), and it can be monitored by
using a wearable non-invasive finger pulse oximeter.
For these reasons we investigate here the
associations among HRV and PPG measurements
and the Systolic BP (SYS) and Diastolic BP (DIA)
to propose a mathematical model to calculate the
SYS and the DIA by using only a wearable ECG
sensor and a pulse oximeter.
To realize the mathematical model, the MIMIC
database (Goldberger et al., 2000), available on
physionet.org, was used. The MIMIC Database
includes data recorded from over 90 ICU patients.
The data include signals and periodic measurements
obtained from a bedside monitor as well as clinical
data obtained from the patient's medical record. The
files include qrs (ECG beat labels, all beats labelled
normal), al (annotations for alarms related to
changes in the patient's status), in (annotations
related to changes in the functioning of the monitor),
abp (arterial blood pressure), pap (pulmonary
arterial pressure), cvp (central venous pressure), and
ple (fingertip plethysmograph) annotations.
3.1 ElectroCardioGraphy
ECG signal is pre-processed by using Kubios
(Niskanen, Tarvainen, Ranta-Aho, & Karjalainen,
2004; Tarvainen, Ranta-Aho, & Karjalainen, 2002),
a Matlab-based software package for event-related
bio-signal analysis developed by the University of
Kuopio, Finland. Kubios is an advanced computer
program to extract and analyse HRV.
Standard linear HRV analysis is performed
according to the guidelines of the European Society
of Cardiology and the North American Society of
Pacing and Electrophysiology (Electrophysiology et
al., 1996). Additionally, nonlinear features are
computed according to the literature (Melillo,
Non-InvasiveEstimationofBloodPressurethroughGeneticProgramming-PreliminaryResults
243

Bracale, & Pecchia, 2011; Rajendra Acharya, Paul
Joseph, Kannathal, Lim, & Suri, 2006). All the
computed measures are summarized in Table 1.
3.2 Plethysmography and Arterial
Blood Pressure Pulse Waveform
PPG signal and the Arterial Blood Pressure (ABP)
pulse waveform are processed using a Matlab script
developed to automatically calculate the minimum
and the maximum values of PPG and the systolic
and diastolic blood pressure values from the ABP
waveform, as shown in Fig. 1.
Figure 1: An example of a record contains the ECG, the
ABP waveform and the PPG. The blue circles indicate the
systolic BP values; the red circles indicate the diastolic BP
values; the pink circles indicate the maximum PPG values;
the green circles indicate the minimum PPG values.
3.3 The Database
Starting from the MIMIC database (Goldberger et
al., 2000) a new dataset has been built to develop the
mathematical model.
The new database contains the HRV measures,
the BP measurements and the PPG measurements.
It is composed by 50 instances for each subject.
Each instance i in the new database is constituted by
the following information:
sub_id: a number value to identify the subject;
SYS_BP
i
: the average of the Systolic BP
computed in the i-th 1-minute time slot;
DIA_BP
i
: the average of the Diastolic BP
computed in the i-th 1-minute time slot;
Pleth_max
i
: the average of the maximum
values of PPG signal computed in the i-th 1-
minute time slot;
Pleth_min
i
: the average of the minimum
values of PPG signal computed in the i-th 1-
minute time slot;
f : a vector containing the 35 HRV measures
reported in Table 1;
Table 1: Linear and non Linear HRV features.
Measure Description (Unit)
Time Domain
Mean RR The mean of RR intervals (ms)
STD RR Standard deviation of RR intervals (ms)
Mean HR The mean heart rate (1/min)
STD HR Standard deviation of instantaneous heart rate
value (1/min)
RMSS Square root of the mean squared differences
between successive RR intervals (ms)
NN50 Number of successive RR interval pairs that
differ more than 50 m (count)
pNN50 NN50 divided by the total number of RR
intervals (%)
RR tri
index
The integral of the RR interval histogram
divided by the height of the histogram
TINN Baseline width of the RR interval histogram
(ms)
Frequency Domain
Peak freq.
VLF
VLF band peak frequencies (Hz)
Peak freq.
LF
LF band peak frequencies (Hz)
Peak freq.
HF
HF band peak frequencies (Hz)
Absol.
Pow. VLF
Absolute powers of VLF band (ms
2
)
Absol.
Pow. LF
Absolute powers of LF band (ms
2
)
Absol.
Pow. HF
Absolute powers of HF band (ms
2
)
Rel powers
VLF
Relative powers of VLF bands (%)
Rel powers
LF
Relative powers of LF bands (%)
Rel powers
HF
Relative powers of HF bands (%)
Normalized
powers LF
Powers of LF bands in normalized units
Normalized
powers HF
Powers of HF bands in normalized units
Total
power
Total Value for the spectral power (ms
2
)
LF/HF
ratio
Ratio between LF and HF band powers
EDR Electrocardiogram Derived Respiration (Hz)
NonLinear Domain
SD1 The standard deviation of the Poincarè plot
perpendicular to the line of identity (ms)
SD2 The standard deviation of the Poincarè plot
along to the line of identity (ms)
ApEn Approximate entropy
SampEn Sample entropy
D
2
Correlation Dimension
α
1
Short-term fluctuation slope in Detrended
Fluctuation Analysis
α
2
Long-term fluctuation slope in Detrended
Fluctuation Analysis
Mean line
length
Mean line length in RP (beats)
Max line
length
Maximum line length in RP (beats)
REC Recurrence Rate (%)
DET Determinism (%)
ShEn Shannon Entropy
BIODEVICES2015-InternationalConferenceonBiomedicalElectronicsandDevices
244

Therefore, each instance is defined as follows:
=
;
;
;ℎ
;ℎ
;
In this paper we have considered four patients,
so our database contains 200 instances in total.
4 GENETIC PROGRAMMING
4.1 The General GP Framework
Genetic Programming (GP) (Koza, 1992) is a
heuristic optimization technique based on mimicking
in a computer mechanisms that are typical of the
evolution in natural populations. GP relies on a set,
called population, of solutions to a given problem. In
the population, individuals are programs that are
represented by tree structures, typically differing in
shape and size. In each individual the internal nodes
represent the functions, while the leaves represent
terminals, meaning with this both problem variables
and constant values. The program can be obtained
by reading the tree in pre-order (see Figure 2).
Figure 2: An example of a tree in Genetic Programming.
This example tree encodes for the following in-
order expression: 7.9 + (3.2 *y) –x.
A very delicate issue of GP is the choice of a
fitness function, i.e. a criterion which may represent
quantitatively the degree of goodness of any solution
at solving the problem faced. Of course, the choice
of a type of fitness depends on the problem at hand.
The search procedure executed by a GP tool is
described by the following pseudo-code:
• load the problem data (e.g. regression values);
• generate randomly an initial population of a
number of Pop_size individuals, each of which
represents a regression model;
• evaluate each individual through the use of a
suitable fitness function;
• at each generation repeat the following steps
until a new population is obtained:
o choose an operator among crossover,
mutation, and copy;
o select a number of individuals in current
population suited to the chosen operator;
o apply the operator chosen in order to generate
an offspring;
o insert the offspring in the new population;
o evaluate the new offspring through the use of
the fitness function;
• repeat the above step until a maximum number
of generations Max_gen is reached.
As the number of generations increases, better
and better solutions in terms of better fitness values)
to the original problem will very likely be found.
Selection is a mechanism that chooses the
individuals that will undergo the reproduction
process among those contained in the current
population. It should favour individuals with better
fitness values to be chosen more frequently, yet
allowing also worse individuals to be selected,
though with lower probability. For the experiments
described in this paper, the widely used tournament
selection has been used. In it, a number of tourn_size
individuals contained in the current population is
chosen in a random way, and the best among them in
terms of fitness is the one that is selected.
The three genetic operators work as follows:
Crossover. Two parent individuals are chosen,
are in each of them a subtree is randomly selected.
Then crossover swaps those subtrees from one
parent individual to the other. The respect of the
limit on the maximal depth allowed should be
ensured by this operator. If this condition is not
respected, then the too-deep offspring is discarded,
and one of the two parents, randomly selected,
becomes the new offspring.
Copy. One individual is randomly selected from
the current population and is copied in the new one.
Mutation. A node in the tree is randomly
selected, and starting from it a new subtree is
generated. The check is carried out that the depth
limit is not violated by this replacement. If this takes
place, this new offspring is discarded and the
original tree is copied into the new generation.
Each time an operator must be chosen, this
choice takes place on the basis of three probability
values for them: p_mutate is that for mutation,
p_cross for crossover, and p_copy for the direct
copy. The sum of these three values must be equal to
1. A random real value in [0.0, 1.0] is generated and
its value determines the operator that will be used.
Non-InvasiveEstimationofBloodPressurethroughGeneticProgramming-PreliminaryResults
245

4.2 GP for Regression
The goal of the use of GP for the regression problem
relies in automatically finding the modelling of the
relationship between the independent variables and a
dependent one, in this case the blood pressure. Thus,
given a fitness function, facing the regression
problem by GP consists in searching the model that
best describes the essential characteristics of this
relationship. Of course, an exhaustive search
performed by the complete enumeration of all the
possible models unviable from a computational
point of view. As a consequence, we make reference
here to GP. Being GP a heuristic method, it does not
guarantee that the global optimum will be achieved
yet it typically finds a suboptimal solution in a
computation time that is reasonable for the users.
The evolving population is composed by
‘formulas’, each of which represents one potential
regression model. These models are encoded as trees
with variable depth, and each of them is composed
by elementary functions and terminals. The function
set contains 11 well-known elementary functions,
and is reported in Table 2. In it, Arity is the number
of arguments a function has.
Table 2: The set of the symbols representing the
elementary functions, their description, and their arity.
Symbol Arity Description
+ 2 addition
- 2 subtraction
* 2 multiplication
/ 2 protected division (returns 1 if the
denominator is 0)
psqroot 1 protected square root (returns 0 for
negative operands)
plog 1 protected logarithm (rlog(0) is 0)
sqr square
tanh 1 hyperbolic tangent
sin 1 sine
cos 1 cosine
exp 1 exponential
The terminal set, instead, consists of 37 symbols
(the generic x
i
represents the i-th independent
variable in the database), plus the Const symbol,
representing a random constant value in a suitable
range. All these terminals have arity equal to 0.
In order to find the model, the available data is
suitably divided into three sets: the train, the test,
and the validation sets. The train set contains the
items onto which the approximation of the actual
output values will be carried out in the learning
phase. The generalization ability of the model
achieved is, instead, evaluated on the test set.
Finally, the real evaluation of algorithm’s
performance is carried out over the validation set.
If we denote by S the model represented by a
generic individual in the GP evolution, and if f is the
function that represents a regression model over n
instances, the fitness function Φ we use in this paper
is the Root Mean Square Error (RMSE), i.e.:
Φ=
∑(
(
)
−())
where S(i) is the value forecasted by the model on
the i-th item of the problem. In this way the
regression becomes a minimization problem.
5 EXPERIMENTS
We have empirically set the GP parameters values
at: Pop_size = 500, Max_gen = 200, tourn_size = 7,
p_mutate = 0.10, p_cross = 0.85, and p_copy =
0.05.
The database described in Section 3.3, composed
by 50 instances for each of the four patients, has
been divided into train, test, and validation sets.
Namely, for each patient, each item has been
randomly and exclusively assigned to one of the
three sets in this way: 44% for the train set, 32% for
the test set, and 24% for the validation set.
GP is a nondeterministic algorithm, which means
that its execution and its results depend on the initial
value assigned to a random seed. In order to get rid
of this feature, the GP algorithm has been run over
the database 25 times. Among the 25 runs, we
consider as the best one that in which the lowest
RMSE value over the validation set has been
achieved. In fact, the model found in that run shows
the best ability to correctly get totally unknown data,
so it has the highest generalization capability.
The formula achieved in the best run for the
systolic blood pressure is:
_
= 0.5064
0.6095
(
)
−0.5947tanh
ℎ_
−
−0.7316
_
0.7316sin
(
ℎ_
)
+
0.5857sin
(
sin
(
sin
(
)))
_
−sin
(
ℎ_
)
+1.112
Figure 3 reports how this formula allows fitting
the real systolic BP values over the three sets.
Namely, the top pane shows the behaviour over the
train set, the middle pane that over the test set, and
the bottom pane that over the validation set.
BIODEVICES2015-InternationalConferenceonBiomedicalElectronicsandDevices
246
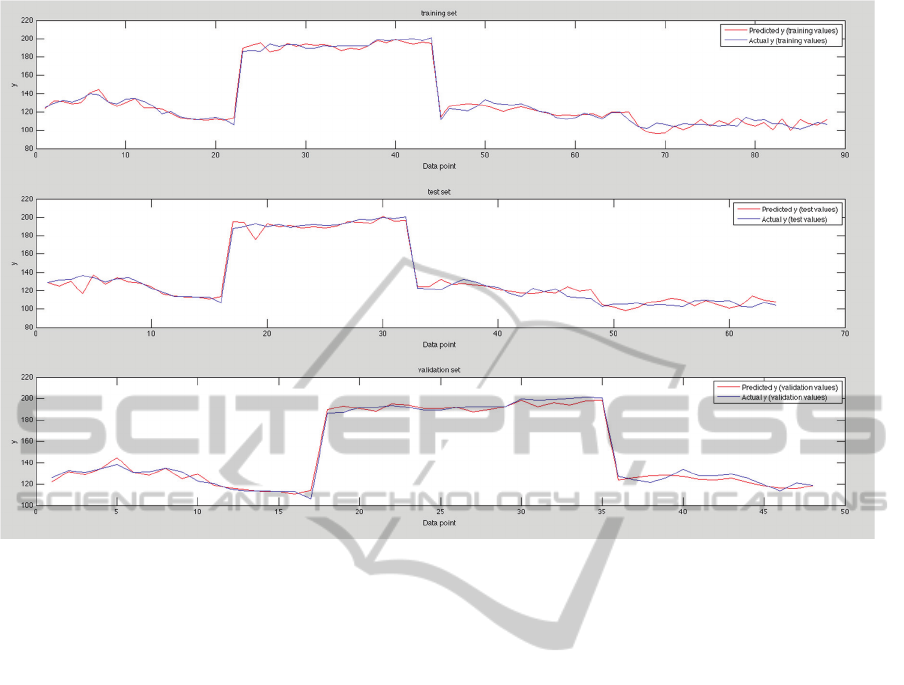
Figure 3: Results for systolic blood pressure.
The results over the validation set, i.e. over data
never learned by the GP algorithm, are very good,
and the RMSE is 3.3679. This means that, on
average, over previously unseen data any actual
systolic blood pressure value and the corresponding
computed one differ by ±√3.3679 = ±1.8352 mmHg,
which is an excellent approximation.
A very important result of the methodology used
is that it has allowed performing the automatic
selection, out of the 37 present in the database, of
the most important parameters for predicting the
values of the systolic blood pressure.
They have turned out to be five: Pleth_min,
Pleth_max, Mean HR, RR tri index, and EDR. This
task is extremely difficult for a human being,
however expert he can be of the field.
Similarly, the formula achieved in the best run
for the diastolic blood pressure is:
_
= 0.3132− 2.142ℎ_
+2.899tanhℎ
(
ℎ_+0.6855
)
+0.8554(sin
(
sin
(
))
))
+1.829tanh(
_
)−1.386
Figure 4 reports how this formula allows fitting
the real diastolic BP values over the three sets.
Namely, the top pane describes the behaviour over
the train set, the middle pane that over the test set,
and the bottom pane refers to the validation set.
For the diastolic pressure the results over the
validation set, never learned by the GP algorithm,
yield an RMSE value of 2.6692. In this case the
approximation of any actual diastolic blood pressure
value with its corresponding computed value over
previously unseen data is even better than that for
the systolic case, since their difference is now equal
to ±√2.6692 = ±1.6338 mmHg.
Here the automatic selection of the most
important independent parameters has resulted in
three of them, i.e.: Pleth_min, Mean HR, and EDR.
By looking at the two formulae, it can be seen
that some parameters are present in both, so they
strongly influence both pressure values. These
parameters are: Pleth_min, Mean HR, and EDR.
Also Pleth_max and RR tri index are important,
since they are contained in one of the two rules. A
result from these preliminary experiments is that
both PPG values and ECG-related ones are very
important to indirectly estimate BP values.
6 CONCLUSIONS
Continuous blood pressure measurement is an
important issue in the medical field. Of course, a
sphygmomanometer cannot be used to fulfil this
task, and alternative ways should found. One way
Non-InvasiveEstimationofBloodPressurethroughGeneticProgramming-PreliminaryResults
247
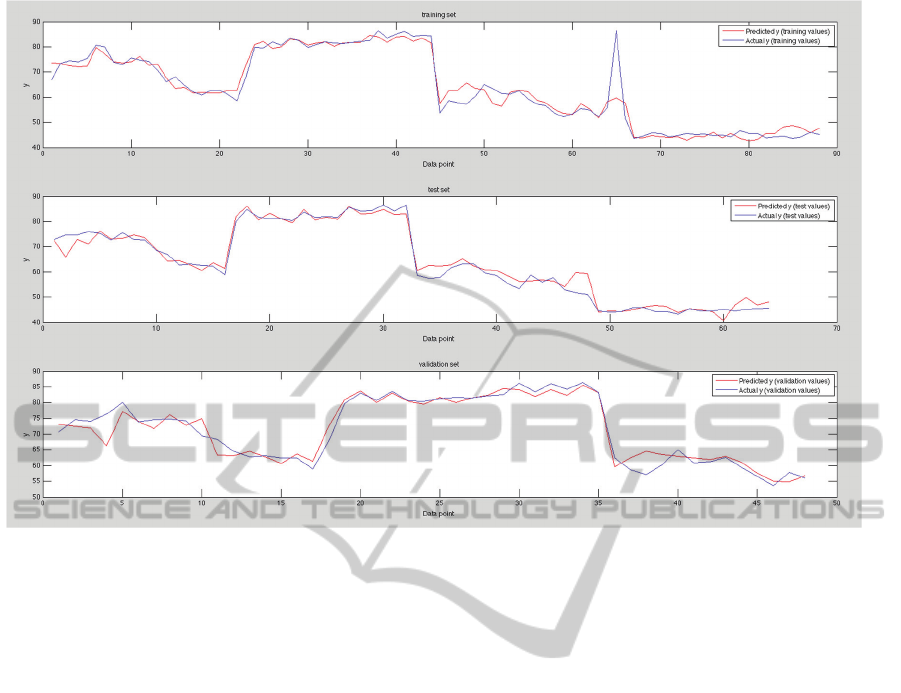
Figure 4: Results for diastolic blood pressure.
consists in indirectly measuring blood pressure
through the measurement of others among the
patient’s vital parameters, if a relationship between
the former and these latter exists.
This paper has tested the hypothesis that a
nonlinear relationship exists between heart activity,
and thus ECG and HRV parameters, PPG and BP
values. Genetic Programming (GP) is able to
automatically both evolve the structure of the
mathematical model and find the most important
parameters in it. Therefore, it is perfectly suited to
perform a regression task such as that involved by
the above hypothesis.
Preliminary experiments on a real-world
database have been performed. The numerical
results achieved have confirmed that this non-linear
relationship indeed exists, and GP has been able to
find a mathematical model expressing it. A result
from these preliminary experiments is that both PPG
values and ECG-related ones are very important to
indirectly estimate BP values. This implies that,
rather than continuously measuring the patient’s BP,
a wearable wireless PPG sensor can be applied to
patient’s finger, a wearable wireless ECG to his/her
chest, HRV parameter values can be computed and,
through regression, both systolic and diastolic BP
values can be indirectly measured. The
approximation error involved by the use of this
method is lower than 2 mmHg for both systolic and
diastolic BP values.
As a future work we will perform an
experimental phase in which 10-fold cross-
validation will be used. Moreover, we will
investigate to determine which the maximal number
of items in the database is, and cases from a much
higher number of patients will be considered in the
creation of the database. Finally, our model will be
compared with other approaches from the literature.
REFERENCES
Allen, J. (2007). Photoplethysmography and its
application in clinical physiological measurement.
Physiological Measurement, 28(3), R1.
Berntson, G. G., Bigger, J. T., Jr., Eckberg, D. L.,
Grossman, P., Kaufmann, P. G., Malik, M., . . . van
der Molen, M. W. (1997). Heart rate variability:
origins, methods, and interpretive caveats.
Psychophysiology, 34(6), 623-648.
Dueck, R., Jameson, L. C. (2006). Reliability of
hypotension detection with noninvasive radial artery
beat-to-beat versus upper arm cuff BP monitoring.
Anesth Analg, 102, Suppl:S10.
Electrophysiology, Task, Force, of, the, European, . . .
Pacing. (1996). Heart Rate Variability: Standards of
Measurement, Physiological Interpretation, and
BIODEVICES2015-InternationalConferenceonBiomedicalElectronicsandDevices
248

Clinical Use. Circulation, 93(5), 1043-1065. doi:
10.1161/01.cir.93.5.1043.
Gesche, H., Grosskurth, D., Kuechler, G., Patzak, A.
(2012). Continuous blood pressure measurement by
using the pulse transit time: comparison to a cuff-
based method. Eur J Appl Physiol, 112, 309-315.
Goldberger, A. L., Amaral, L. A. N., Glass, L., Hausdorff,
J. M., Ivanov, P. C., Mark, R. G., . . . Stanley, H. E.
(2000). PhysioBank, PhysioToolkit, and PhysioNet:
Components of a New Research Resource for
Complex Physiologic Signals. Circulation, 101(23),
e215-e220. doi: 10.1161/01.CIR.101.23.e215.
Golparvar, M., Naddafnia, H., Saghaei, & Mahmood.
(2002). Evaluating the Relationship Between Arterial
Blood Pressure Changes and Indices of Pulse
Oximetric Plethysmography. Anesthesia & Analgesia,
95(6), 1686-1690 1610.1097/00000539-200212000-
200200040.
Ilies, C., Kiskalt, H., Siedenhans, D., Meybohm, P.,
Steinfath, M., Bein, B., Hanss, R. (2012). Detection of
hypotension during Caesarean section with continuous
non-invasive arterial pressure device or intermittent
oscillometric arterial pressure measurement. British
Journal of Anaesthesia, 3-9.
Inajima, T., Imai, Y., Shuzo, M., Lopez, G., Yanagimoto,
S., Iijima, K., Morita, H., Nagai, R., Yahagi, N.,
Yamada, I. (2012). Relation Between Blood Pressure
Estimated by Pulse Wave Velocity and Directly
Measured Arterial Pressure. Journal of Robotics
andMechatronics, 24(5), 811-821.
Karapetian, G. K., Evaluation, W. S. U. E., & Research.
(2008). Heart Rate Variability as a Non-invasive
Biomarker of Sympatho-vagal Interaction and
Determinant of Physiologic Thresholds: Wayne State
University.
Koza, J. (1992). Genetic Programming: On the
Programming of Computers by Means of Natural
Selection: MIT Press, Cambridge, MA.
Maguire, S., Rinehart, J., Vakharia, S., Cannesson, M.
(2011). Technical communication: respiratory
variation in pulse pressure and plethysmographic
waveforms: intraoperative applicability in a North
American academic center. Anesthesia and analgesia,
112(1), 94-96.
Meigas, K., Lass, J., Karai, D., Kattai, R., Kaik, J. (2007).
Pulse Wave Velocity in Continuous Blood Pressure
Measurements. Paper presented at the IFMBE.
Melillo, P., Bracale, M., & Pecchia, L. (2011). Nonlinear
Heart Rate Variability features for real-life stress
detection. Case study: students under stress due to
university examination. Biomed Eng Online, 10, 96.
doi: 10.1186/1475-925x-10-96.
Najjar, S., Scuteri, A., Shetty, V., Wright, J.G., Muller,
D.C:, Fleg, J.L., Spurgeon, H.P., Ferrucci, L., Lakatta,
E.G. (2008). Pulse Wave Velocity Is an Independent
Predictor of the Longitudinal Increase in Systolic
Blood Pressure and of Incident Hypertension in the
Baltimore Longitudinal Study of Aging. J Am Coll
Cardiol, 51(14), 1377-1383.
Niskanen, J. P., Tarvainen, M. P., Ranta-Aho, P. O., &
Karjalainen, P. A. (2004). Software for advanced HRV
analysis. Comput Methods Programs Biomed, 76(1),
73-81. doi: 10.1016/j.cmpb.2004.03.004.
Rajendra Acharya, U., Paul Joseph, K., Kannathal, N.,
Lim, C. M., & Suri, J. S. (2006). Heart rate variability:
a review. Med Biol Eng Comput, 44(12), 1031-1051.
doi: 10.1007/s11517-006-0119-0.
Sotera wireless. http://www.soterawireless.com.
Tarvainen, M. P., Ranta-Aho, P. O., & Karjalainen, P. A.
(2002). An advanced detrending method with
application to HRV analysis. IEEE Trans Biomed Eng,
49(2), 172-175. doi: 10.1109/10.979357.
von Skerst, B. (2008). Market survey, N=198 physicians
in Germany and Austria. Dec.2007 - Mar 2008:
InnoTech Consult GmbH, Germany.
Vukovich, R., & Knill, J. (1980). Blood Pressure
Homeostasis. In D. Case, E. Sonnenblick & J. Laragh
(Eds.), Captopril and Hypertension (pp. 3-13):
Springer US.
Non-InvasiveEstimationofBloodPressurethroughGeneticProgramming-PreliminaryResults
249
