
A Web Application for Automatic Analysis on Life-style Factors
Affecting Personal Health from Self-tracking Data
Towards User-side Statistics Free Personal Data Analysis
Zilu Liang
Department of Electrical Engineering and Information Science, The University of Tokyo, Tokyo, Japan
1 RESEARCH PROBLEM
The advent of commercial portable sensing devices
has enabled many non-experts to collect their own
data, and there has been a boom in health-centric
self-monitoring and tracking (Swan, 2013). However,
huge amount of these data remain unanalyzed simply
because many of the data owners have no idea what to
do with the large amount of data they have collected.
Even for patients who are self-monitoring their vi-
tal health metrics, it is unrealistic to expect the doc-
tors or physicians who are overloaded already to help
them analyze their personal data individual by indi-
vidual, let alone for healthy people who simply track
for the purpose of prevention. Although some track-
ing device vendors offer software applications to syn-
chronize the data collected, the analysis of these data
is primitive because the applications simply visualize
the temporal change of the tracked metric, leaving the
potential causes of the change unanswered. Someone
claim that simply by looking at the rise of blood pres-
sure curve could further raise the blood pressure of
a user. On the other hand, there are many indepen-
dent data analysis software tools available. However,
these tools were designed for experts such as statisti-
cians and data scientists. Learning how to use them
could be time-consuming or even torturing for non-
experts who do not have expertise on statistics and
other skills such as programming. In one word, it
is difficult, if not impossible, for non-experts to use
existing data analysis software tools to gain insights
from their data.
As more and more people start to collect their own
data, it becomes urgent and of practical importance
to solve the following problem: How to empower
non-experts with an effective and easily usable tool to
analyze their personal data and identify potential af-
fecting factors of the concerned health metrics? This
project aims to address this problem by developing a
web application that automatically analyzes person-
alized effecting factors and hides the technical com-
plexity from the users.
2 OUTLINE OF OBJECTIVES
The objective of this project is to develop an easily
usable and free data analysis software tool that helps
non-experts to gain insights from their self-tracking
data. The technical problem of this project is how to
design and develop a data analysis software tool that
hides all the technical details from the users, includ-
ing the general process of data analysis, the selection
on statistical techniques to apply in each step of the
process, and the installation or configuration of the
software tool.
3 STATE OF THE ART
There are many software tools that have been devel-
oped to facilitate certain degree of automation in data
analysis. Widely used commercial statistics software
packages include Excel, SPSS, SAS, STATISTICA,
Stata, to name a few. In addition, several open-source
statistics software packages are also available, such as
R, Weka, PSPP, etc.
Although these software packages usually offer
very powerful tools that can be used to conduct ad-
vanced data analysis, they are rarely approachable for
non-experts who have limited or no knowledge on
statistics. To put it more specific, all the existing data
analysis software packages require that the users are
familiar with general data analysis routine so that they
can decide on the proper statistics tools to use at each
step of the data analysis process. In this regard, ex-
isting software can do anything that statisticians and
data scientists need but cannot do anything for non-
experts who do not have the knowledge on data anal-
ysis routine. In addition, most of the free statistics
software tools were developed for Linux operating
system and they do not have graphic user interfaces
(GUIs). Therefore, users are expected to have suf-
ficient knowledge and experience on command line
interfaces (CLIs), which could be too demanding for
9
Liang Z..
A Web Application for Automatic Analysis on Life-style Factors Affecting Personal Health from Self-tracking Data - Towards User-side Statistics Free
Personal Data Analysis.
Copyright
c
2015 SCITEPRESS (Science and Technology Publications, Lda.)
users who are not familiar with Linux/Unix operating
systems. In one word, it is difficult, if not impossi-
ble, for non-experts to use existing data analysis soft-
ware tools to gain insights from their data, let alone in
healthcare context.
This paper aims to propose and develop a proper
data analysis tool that empowers non-experts to ob-
tain insights from their personal data for the purpose
of improving health.
4 METHODOLOGY
My proposed solution adopts a black-box approach.
The developed software tool will automate the whole
process of data analysis and make the details trans-
parent to the users. Using this tool, users can eas-
ily obtain insights from their personal data even when
they do not have any background in statistics and pro-
gramming to understand the technical details. As it
would be too costly and time-consuming to develop
such black-box data analysis software from scratch, I
decided to stand on the shoulders of giants and to de-
velop the software tool based on a most widely used
free statistics software environment and programming
language R (W. N. Venables and the R core Team,
2014).
The proposed automatic data analysis tool will be
developed in the form of a web application, so that
users do not need to tangle with the installation of var-
ious packages and they can access the application on
Internet regardless of their physical location. The web
application will be implemented in Ruby on Rails
framework (S. Ruby and Hansson, 2013), and the ob-
jective of data analysis will be achieved by executing
a R script.
It is assumed that a user would have already col-
lected sufficient data on the target health metric as
well as the potential affecting factors of the target
health metric before using the developed web appli-
cation to analyze their data. Users are required to
keep their data in a spreadsheet file, where the first
column is the target health metric, followed by poten-
tial affecting factors. The potential affecting factors
are decided based on population-level studies. The
prefix ”potential” is added on purpose, as the effects
of these factors may not hold at the individual-level
due to the intrinsic difference from person to per-
son (J. D. Tenenbaum, 2012; A. McWilliam, 2006).
The selection on the potential affecting factors and
the choice on tracking tools are not in the scope of
this paper. Users may refer to relevant articles or sug-
gestions from doctors when making the decisions.
4.1 Mechanism of Proposed Web
Application
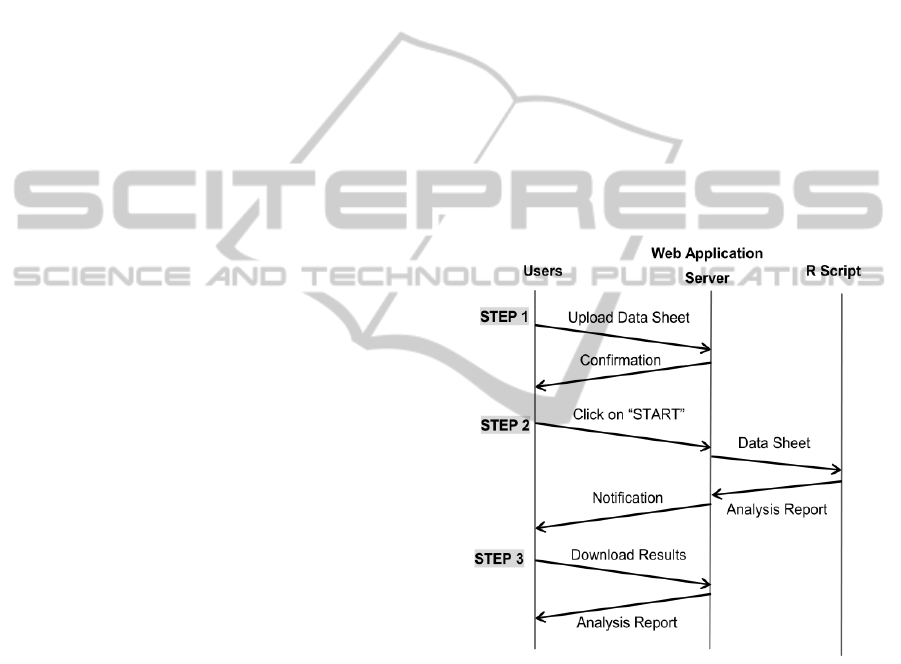
The mechanism of the proposed data analysis web ap-
plication is illustrated in Figure 1. In the first step, a
user uploads his/her data sheet to the web application
server. After successfully upload the datasheet, the
server sends back a confirmation to the user and sug-
gests him/her to click on the ”START” link to start
the data analysis. If the user clicks on ”START”, the
server executes the R script that contains the whole
routine of a data analysis process. The uploaded data
sheet is used as the input to the R script. An analysis
report will be generated and sent to the server when
the R script finishes the analysis. The server then no-
tifies the user of the completion of data analysis on
the user interface and provides a link to download the
report. A user just needs to click on the link to down-
load the report which contains the analysis results.
Figure 1: Mechanism of proposed automatic data analysis
web application.
4.2 Workflow of Data Analysis in R
Script
The automatic data analysis function of the proposed
web application is achieved by executing a R script
when a user clicks on the ”START” link. From users’
point of view, the purpose of the analysis on their
self-tracking data is usually two folded. On the one
hand, many people track their physiological metrics
with the purpose of understanding their current health
conditions, which is the most common motivation for
patients with chronic conditions as well as healthy
BIOSTEC2015-DoctoralConsortium
10

Table 1: The scale used to identify affecting factors.
Very Strong Positive Affecting Factor r
c
> 0.8
Strong Positive Affecting Factor 0.5 6 r
c
< 0.8
Moderate Positive Affecting Factor 0.3 6 r
c
< 0.5
Weak Positive Affecting Factor 0.2 6 r
c
< 0.3
No-Effect Factor −0.2 < r
c
< 0.2
Weak Negative Affecting Factor −0.3 < r
c
6 0.2
Moderate Negative Affecting Factor −0.5 < r
c
6 0.3
Strong Negative Affecting Factor −0.8 < r
c
6 0.5
Very Strong Negative Affecting Factor r
c
6 −0.8
people to launch their self-tracking/monitoring exper-
iments. Second, some people also intend to investi-
gate the relationship between potential affecting fac-
tors and the target health metric, and seek out critical
affecting factors. By doing so, they can have deeper
self-knowledge as to how their physiological condi-
tions are affected by various factors so that it would
become possible for them to maximize their health
outcomes through life-style adjustment. Base on the
assumption that users have collected enough data on
the concerned target health metric and its potential af-
fecting factors, the R script analyzes the data accord-
ing to the following five stages.
1) Stage 1: Data Preparation and Cleaning
In any process of data collection process, missing
data (P. E. McKnight and Figueredo, 2007) is likely
to happen because of device failure, data entry error,
lost data, and human causes (S. R. Wisniewski and
Trivedi, 2006; J. E. Broderick, 2003). A data spread-
sheet containing missing values is not suitable for fur-
ther analysis, as arithmetic expressions and functions
that contain missing values yield problematic and un-
reliable results. In R, missing values are represented
by the symbol NA (not available). Missing data can
be handled by using either basic data cleaning tech-
niques to simply remove the observations that con-
tain missing values, or advanced techniques that re-
place the missing values with reasonable alternative
data values (G. L. Schlomer and Card, 2010; Allison,
2001).
2) Stage 2: Baseline Establishment
This function is achieved by calculating basic
statistics (average value and standard deviation) of
the target health metric. This help the users estab-
lish a baseline which is essential in identifying the
gap between current and desired status of the target
health metric. The baseline can also be used as a ref-
erence for comparison after the improvement actions
are taken.
3) Stage 3: Correlation Analysis
Affecting factors of the target metric are identified
through correlation analysis. The R script will calcu-
late the correlation between the target health metric
and each of the potential factors. The effect of a factor
is considered in proportion to its correlation with the
target health metric, and the scale that is used to iden-
tify affecting factors is summarized in Table 1 where
r
c
represents the correlation coefficient between a po-
tential affecting factor and the target health metric.
4) Stage 4: Summary and Interpretation
After analyzing the correlation between the target
health metric and each of the potential affecting fac-
tors, all potential affecting factors will be classified
into three categories: positive affecting factors, nega-
tive affecting factors, and no-effect factors. As poten-
tial users of this web application may not have back-
ground in statistics, the R script will interpret the anal-
ysis results into plain words to help users understand
the results. It is worth noticing that since automat-
ically extract meaning from the numbers and deliv-
ery the findings in natural language is a big challenge,
the interpretation may not sound very natural and is
not sufficiently adaptive in some cases. However, the
current interpretation scheme is enough to deliver the
basic findings of the analysis results.
5) Stage 5: Report Generation
At last, the R script will generate a report on the
analysis results in pdf format for the user to download.
A report covers the following information.
• The basic statistics on the target health metric;
• A list of the correlation coefficients between the
target health metric and the potential affecting fac-
tors;
• A summary on the effect of all potential affecting
factors;
• The interpretation of the analysis results.
5 EXPECTED OUTCOME
The final outcome of this project is a web-based user-
side statistics-free data analysis software tool named
DataMakeSense, which is accessible by all inter-
net users regardless of their physical location. The
AWebApplicationforAutomaticAnalysisonLife-styleFactorsAffectingPersonalHealthfromSelf-trackingData-
TowardsUser-sideStatisticsFreePersonalDataAnalysis
11
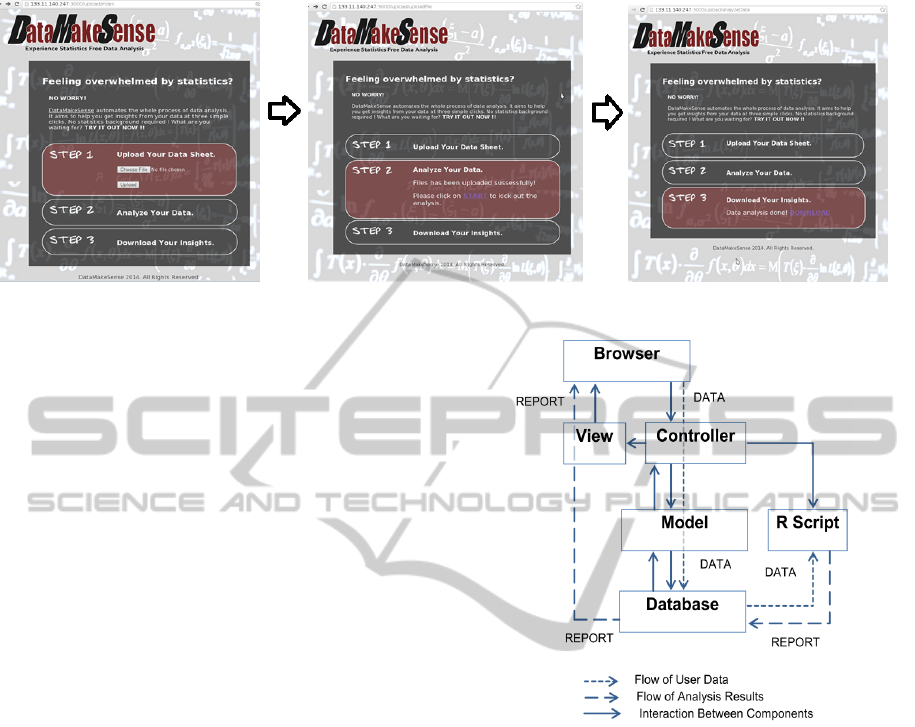
Figure 2: Web user interface of proposed web application.
fact that DataMakeSense is web-based can save users
from complicated installation and configration.
It is expected that the developed DataMakeSense
will benefit not only individuals but also the gov-
ernment. For individuals, DataMakeSense will help
them identify the critical life-style factors that affect
their health conditions and thus make it possible for
them to personalize their healthcare plans for the best
health outcome. As more and more people are em-
powered by the correct tool to make full use of their
self-tracking data for personal healthcare, the health
conditions of the population will be improved in the
long term. This may significantly help the govern-
ment save public health cost and help reduce financial
lost associated with poor health of the working popu-
lation.
6 STAGE OF THE RESEARCH
I have developed a prototype of DataMakeSense in
Ruby on Rails framework (S. Ruby and Hansson,
2013) due to its efficiency and agility. Ruby on
Rails uses the model-view-controller (MVC) (Kras-
ner and Pope, 1988) pattern to organize application
programming. The architecture of the implemented
web application is shown in Figure 3. In our im-
plementation, the ”model” extracts the uploaded file
name and stores the uploaded file into the database.
The ”controller” responds to web-browser requests
from the users by determining which ”view” file to
render as well as triggers the execution of the R
script for data analysis. The ”view” represents the
web user interface of our application, which is com-
posed of .erb files that are compiled to HTML at
run-time. Only simple data cleaning technique is ap-
plied in this prototype. DataMakeSense can be ac-
cessed at http://133.11.140.247:3000/upload/index.
The screenshots of the web user interface in each of
the three steps when using the web application is il-
Figure 3: Implementation of proposed web application un-
der ruby-on-rails framework.
lustrated in Figure 2. A sample report of analysis
results is shown in Figure 4.
A case study was conducted using the developed
prototype to automatically analyze the self-tracking
data of two users who seek to identify the affecting
factors of their sleep quality in order to make person-
alized improvement plans. Each of the users tracked
the data on their sleep quality as well as ten potential
affecting factors (e.g. dinner time, stress level, mood,
tiredness, get-up time, etc.) for one month and kept
the data in a spreadsheet document file. The first col-
umn of the Excel file is their sleep quality which is the
target health metric that they intend to improve, while
the following columns are the data of potential affect-
ing factors. The users then followed the three steps
of using DataMakeSense and each of them obtained
a report on the analysis results of their personal data.
According to the interpretation of analysis results, the
affecting factors of sleep quality for each user are
different. After taking tailored improvement actions
BIOSTEC2015-DoctoralConsortium
12
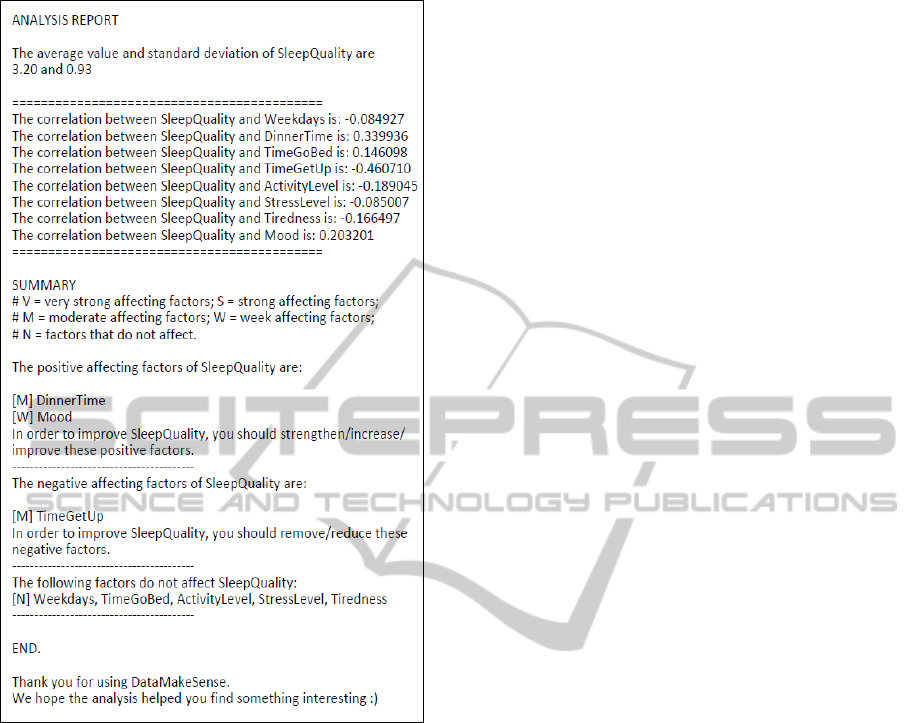
Figure 4: A sample of data analysis report.
for one month, they successfully improved their sleep
quality. The prototype of DataMakeSense helped the
two users identify personalized affecting factors on
their sleep quality, and it thus helped them make ef-
fective improvement plans. Both of the users were
satisfied with how DataMakeSense helped them gain
insights from their own data so that it became possible
for them to make personalized and thus more effective
improvement plans, as they had never expected that
they could conduct advanced data analysis by them-
selves. In the next step, I intend to improve the func-
tionality of the prototype and release DataMakeSense
for public use.
REFERENCES
A. McWilliam, R. Lutter, C. N. (2006). Health care savings
from personalizing medicine using genetic testing: the
case of warfarin. AEI-Brookings Joint Center for Reg-
ulatory Studies.
Allison, P. D. (2001). Missing Data. SAGE Publications.
G. L. Schlomer, S. B. and Card, N. A. (2010). Best practices
for missing data management in counseling psychol-
ogy. Journal of Counseling Psychology, 57(1):1–10.
J. D. Tenenbaum, A. James, K. P.-N. (2012). An al-
tered treatment plan based on direct to consumer
(dtc) genetic testing: personalized medicine from the
patient/pin-cushion perspective. Journal of Personal-
ized Medicine, 2(4):192–200.
J. E. Broderick, J. E. Schwartz, S. S. e. a. (2003). Signaling
does not adequately improve diary compliance. An-
nals of Behavioral Medicine, 26:139–148.
Krasner, G. E. and Pope, S. T. (1988). A cookbook for us-
ing the model-view controller user interface paradigm
in smalltalk-80. Journal of Object-Oriented Program-
ming, 1(3):26–49.
P. E. McKnight, K. M. McKnight, S. S. and Figueredo, A. J.
(2007). Missing data: A gentle introduction. New
York: Guilford Press.
S. R. Wisniewski, A. C. Leon, M. W. O. and Trivedi, M. H.
(2006). Prevention of missing data in clinical research
studies. Biological Psychiatry, 59:997–1000.
S. Ruby, D. T. and Hansson, D. H. (2013). Agile Web De-
velopment with Rails 4. Pragmatic Bookshelf.
Swan, M. (2013). The quantified self: fundamental disrup-
tion in big data science and biological discovery. Big
Data, 1(2):85–99.
W. N. Venables, D. M. S. and the R core Team (2014). An
introduction to r (version 3.1.1).
AWebApplicationforAutomaticAnalysisonLife-styleFactorsAffectingPersonalHealthfromSelf-trackingData-
TowardsUser-sideStatisticsFreePersonalDataAnalysis
13
