
Past, Present, and Future of 3D Software Visualization
A Systematic Literature Analysis
Richard M¨uller
1
and Dirk Zeckzer
2
1
Information Systems Institute, Leipzig University, Leipzig, Germany
2
Institute of Computer Science, Leipzig University, Leipzig, Germany
Keywords:
3D, Software Visualization, Systematic Mapping Study, Systematic Literature Review.
Abstract:
The ongoing 2D vs. 3D research debate from information visualization also affects software visualization.
There are many 2D, 3D, and combinations of 2D and 3D visualizations for software representing its structure,
behavior, or evolution. This study contributes findings to this debate and presents the results of analyzing the
applications of 3D in software visualization with the objectives to outline the state-of-the-art, to reveal trends,
and to identify research gaps. The analysis combined a systematic mapping study to get an overview and
a systematic literature review to gain deeper insights. The relevant papers were identified by three different
search strategies (manual browsing, keyword, and backward search). Starting with a set of 4386 publications
from the fields of information and software visualization 155 relevant papers dealing with 2D & 3D or 3D
software visualizations were identified. These papers were analyzed according to dimensionality, aspect,
year, evaluation method, and application of the third dimension. In a nutshell, the majority of 3D software
visualizations represents the structural aspect, is either evaluated using case studies showing working examples
or not evaluated at all, and applies a 2D layout using the third dimension for displaying software metrics.
1 INTRODUCTION
As a branch of information visualization, software
visualization provides tools and methods to create
representations for structural, behavioral, and evolu-
tionary aspects of software systems (Diehl, 2007).
Comprehensive surveys with numerous visualizations
ranging from 2D to 3D were performed by (Graˇcanin
et al., 2005), (Teyseyre and Campo, 2009), and
(Caserta and Zendra, 2011). However, as in its
parental discipline, there is an ongoing 2D vs. 3D
debate. This study aims at investigating the use of
3D in software visualization and how its usefulness is
evaluated.
A suitable approach for this investigation are sys-
tematic mapping studies and literature reviews. A
systematic mapping study aims at building a classi-
fication scheme in order to structure a research field
(Petersen et al., 2008). The scheme comprises facets
detailed by categories. The different facets are com-
bined to answer specific research questions. The re-
sults include frequencies of publications for each cat-
egory within this scheme. The systematic literature
review focuses on a deeper analysis of the publica-
tions and can have other goals (Brocke et al., 2009).
(Petersen et al., 2008) argue that both methods can be
applied complementary. Thus, we used the mapping
study to gain an overview of the field and investigated
specific questions using detailed reviews.
The major contributions of this state-of-the-art re-
port in 3D software visualization are answers to the
following questions:
• Venue: Where were papers about 3D software vi-
sualization published?
• Aspect: Which aspects of software are visualized?
• Evolution: How did the topic evolve over the last
22 years?
• Evaluation: How was the usefulness of the 3D
software visualizations evaluated?
• Application: How was the third dimension used?
On the basis of these answers trends were revealed
and research gaps identified.
63
Müller R. and Zeckzer D..
Past, Present, and Future of 3D Software Visualization - A Systematic Literature Analysis.
DOI: 10.5220/0005325700630074
In Proceedings of the 6th International Conference on Information Visualization Theory and Applications (IVAPP-2015), pages 63-74
ISBN: 978-989-758-088-8
Copyright
c
2015 SCITEPRESS (Science and Technology Publications, Lda.)

2 RELATED WORK
Important prior work ranges from meta-studies and
surveys to literature reviews as well as a mapping
study in the field of software visualization.
Hundhausen conducted two meta-studies, one
about software visualization effectiveness (Hund-
hausen, 1996) and one about algorithm visualization
effectiveness (Hundhausen et al., 2002). The classifi-
cation of the evaluation methods into anecdotal, ana-
lytic, and empirical is taken from these studies.
(Graˇcanin et al., 2005) provide a general overview
over software visualization outlining several research
directions, such as (distributed) virtual environments
and visualization metaphors. (Teyseyre and Campo,
2009) give a comprehensive overview over 3D soft-
ware visualization including visual representations,
interaction issues, evaluation methods, and develop-
ment tools. (Caserta and Zendra, 2011) focus on static
aspects of software visualization in 2D and 3D. We
used all three surveys as a starting point for the back-
ward search to find relevant papers not covered by the
selected workshops and conferences in our primary
studies.
(Kienle and M¨uller, 2007) identified quality at-
tributes and functional requirements for software vi-
sualization tools to support researchers using a liter-
ature review. (Schots and Werner, 2014) examined
software visualizations with regard to reuse based
on the task oriented taxonomy from (Maletic et al.,
2002). The complete review can be found here
(Schots et al., 2014). (Seriai et al., 2014) investi-
gated the state-of-the-art in validation of software vi-
sualization tools with a mapping study. The primary
categories of the evaluation method facet are taken
from this study. The main difference to our study is
the focus: we concentrate on 3D software visualiza-
tions includingall aspects, such as structure, behavior,
and evolution. In this context, we investigate publica-
tion locations, evaluation methods, the development
of this specific field over time, as well as the applica-
tion of the third dimension.
3 METHOD
For this study, a hybrid approach was applied combin-
ing a systematic mapping study (Petersen et al., 2008)
with a systematic literature review (Brocke et al.,
2009). First, a mapping study was performed to get an
overview and to answer the first four research ques-
tions. Second, a detailed literature review was con-
ducted to answer the fifth research question. Finally,
the results of both processes are summarized in the
findings. The complete process is depicted in Figure
1. Its steps will be described in the subsequent sec-
tions.
3.1 Define Scope & Research Questions
We describe the scope of this study according to
Cooper’s taxonomy of literature reviews (Cooper,
1988). The focus lies on applications of 3D
software visualizations. Our goal is to inte-
grate findings from publications of different work-
shops/conferences/journals to create a comprehensive
view of this topic. The study is organized conceptu-
ally guided by a classification scheme. Further, we
adopt a neutral perspective. The main audience are
specialized scholars from the fields of information vi-
sualization and software visualization. The coverage
is aimed to be representative as we combine man-
ual browsing through relevant workshop and confer-
ence proceedings, a keyword search, and a backward
search starting with state-of-the-art-papers.
With this study, we want to investigate the follow-
ing research questions:
• RQ1: Which workshops/conferences/journals in-
clude papers on 3D software visualization?
• RQ2: Which aspects of software (structure, be-
havior, evolution) are visualized with 3D?
• RQ3: How did 3D software visualization evolve
over the last 22 years and what are current trends?
• RQ4: How is the usefulness of the proposed 3D
software visualizations evaluated?
• RQ5: How is the third dimension used?
3.2 Conceptualize Topic
For the classification scheme, a top-downand bottom-
up approach were applied. We started with estab-
lished definitions from literature for the classifica-
tion of the relevant papers. If a paper introduces a
new category, the corresponding facet in the classifi-
cation scheme was extended. In this study, the fol-
lowing facets are important: dimensionality, aspect,
year, evaluation method, and application of the third
dimension. The categories for each facet are summa-
rized in Table 1 and described next.
3.2.1 Dimensionality
We differentiate between 2D, combined 2D and 3D,
and 3D software visualizations. For this study, the last
two categories are focused.
IVAPP2015-InternationalConferenceonInformationVisualizationTheoryandApplications
64

^LJƐƚĞŵĂƚŝĐ>ŝƚĞƌĂƚƵƌĞZĞǀŝĞǁ
^LJƐƚĞŵĂƚŝĐDĂƉƉŝŶŐ^ƚƵĚLJ
ĞĨŝŶĞ^ĐŽƉĞΘ
ZĞƐĞĂƌĐŚYƵĞƐƚŝŽŶƐ
ZĞǀŝĞǁ^ĐŽƉĞ
ůĂƐƐŝĨŝĐĂƚŝŽŶ
^ĐŚĞŵĞ
ŽŶĐĞƉƚƵĂůŝnjĞ
dŽƉŝĐ
ŽŶĚƵĐƚ
^ĞĂƌĐŚ
^ĐƌĞĞŶΘůĂƐƐŝĨLJ
WĂƉĞƌƐ
ZĞůĞǀĂŶƚ
WĂƉĞƌƐ
ůůWĂƉĞƌƐ
džƚƌĂĐƚΘDĂƉ
ĂƚĂ
^LJƐƚĞŵĂƚŝĐ
DĂƉƐ
&ŝŶĚŝŶŐƐ
^ƵŵŵĂƌŝnjĞ
&ŝŶĚŝŶŐƐ
ŶĂůLJnjĞΘ
^LJŶƚŚĞƐŝnjĞWĂƉĞƌƐ
Figure 1: Process model for hybrid approach: Mapping study (Petersen et al., 2008) and literature review (Brocke et al.,
2009).
3.2.2 Aspect
The different aspects of software that can be visual-
ized are based on (Diehl, 2007). He defines soft-
ware visualization as ”[...] the visualization of ar-
tifacts related to software and its development pro-
cess.”. These artifacts can contain information about
the structure, the behavior, or the evolution of the
software system. Structure includes program code,
data structures, the static call graph, relations, and the
organization of the software system. Behavior covers
its execution with real and abstract data. Evolution
refers to its development process.
Table 1: Classification scheme for the study.
Facet Category
Dimensionality
2D and 3D
3D
Aspect
Structure
Behavior
Evolution
Year 1991—2013
Evaluation
Anecdotal Case Study (Example)
Empirical
Case Study (User)
Controlled Experiment
Method
Questionnaire
Analytic
Guideline Checking
Heuristic Evaluation
Application
Extended 2D
Full 3D
2D layout org. in 3D
3D as time
Stacked views
3D for cognition
Local fish-eye
3.2.3 Year
The years for the relevant papers range from 1991 un-
til 2013. This period results from the search strategies
described in Section 3.3.
3.2.4 Evaluation Method
Typical evaluation methods in software visualization
are case study, controlled experiment, and question-
naire (Sjøberg et al., 2007; Seriai et al., 2014). How-
ever, the term case study is used in two different ways
in software visualization. On the one hand, a case
study is the demonstration of a working example as
in (Wettel and Lanza, 2008). This type of case study
is without representative users. On the other hand,
a case study actually involves representative users as
in (Denford et al., 2002). The second type also in-
cludes explorative user studies as in (Lanza et al.,
2013). Thus, we differentiate between case study (ex-
ample) and case study (user). In addition, we found
guideline checking and heuristic evaluation described
in (Andrews, 2008). All methods can further be clas-
sified into anecdotal, empirical, and analytic evalua-
tion methods (Hundhausen, 1996; Hundhausen et al.,
2002). Anecdotal methods use compelling examples,
empirical methods involve representative users, and
analytic methods are performed by evaluation experts
using guidelines or heuristics.
3.2.5 Application of the Third Dimension
(Reiss, 1995) identified six different categories for the
application of the third dimension. As there were pa-
pers not fitting in any of these categories, we intro-
duced another one resulting in the following seven
categories.
1. Extended 2D: A 2D layout is extended to 3D re-
sulting in an additional dimension. This dimen-
sion can be used to display further information,
such as software metrics as done in sv3D (Mar-
Past,Present,andFutureof3DSoftwareVisualization-ASystematicLiteratureAnalysis
65

cus et al., 2003) or CodeCity (Wettel and Lanza,
2007).
2. Local fish-eye: Another technique builds upon a
2D layout where the user is able to select a set of
nodes and place them at the front. This technique
uses perspective to make the selected nodes ap-
pear bigger and the other ones smaller. It results
in local fish-eye views without changing the orig-
inal graph such as in rubber sheet (Sarkar et al.,
1993).
3. 2D layout organized in 3D: The third technique
takes a 2D layout and the information is organized
in a 3D space, such as with cone and cam trees
(Robertson et al., 1991) or with hyperbolic trees
(Munzner, 1997). It is usually applied to get more
space and to minimize edge-crossings. Two other
examples for this category are the perspectivewall
(Mackinlay et al., 1991) and the ‘code on the wall’
metaphor (Jackson et al., 2002).
4. Full 3D: The next technique moves from 2D to 3D
space and uses the full capabilities of three dimen-
sions. Examples are Angle (Churcher and Tech,
2003), Metaballs (Rilling and Mudur, 2005), and
the 3D scatter plot in ComVis (Bohner et al.,
2007).
5. 3D as time: Further, the third dimension is used
to represent time, such as in VRCS (Koike and
Chu, 1998), Vizz3D (L¨owe and Panas, 2005), or
Palantr (Ripley et al., 2007).
6. Stacked views: This technique uses the third di-
mension to display several 2D views simultane-
ously. Examples are 3D sequence diagram as in
(Gil and Kent, 1998) and GEF3D (von Pilgrim
and Duske, 2008).
7. 3D for cognition: Finally, 3D shapes are applied
to support the mental model and to optimize the
cognition of the visualization. Examples for this
category are Geons (Irani and Ware, 2003) and the
use of social agents to visualize software scenar-
ios (Alspaugh et al., 2006).
3.3 Conduct Search
We combined three search methods in order to make
the sample more representative. First, we browsed
manually through all publications from relevant
workshops and conferences in the field of software
visualization including SoftVis (2003, 2005, 2006,
2008, 2010), VisSoft (2002, 2003, 2005, 2007, 2009,
2011, 2013), IWPC/ICPC (1998-2013), Dagstuhl
Seminar on Software Visualization (2001), OOPSLA
Workshop on Software Visualization (2001), and
ICSE Workshop on Software Visualization (2001).
Second, we performed a keyword search on pub-
lications of relevant workshops and conferences in
the field of information visualization including IEEE
VIS (2000-2013), PacificVis (2008-2013), and Euro-
Vis (2007-2013). The keyword was ”software visu-
alization”. Third, we conducted a backward search
using three state-of-the-art papers related to 3D soft-
ware visualization: (Graˇcanin et al., 2005), (Teyseyre
and Campo, 2009), and (Caserta and Zendra, 2011).
3.4 Screen & Classify Papers
The screening process for each paper included ti-
tle, abstract, conclusion, and—if necessary—further
parts. We used the following inclusion and exclusion
criteria to select the relevant papers. The publication
is included, if
• it deals with single 2D and 3D or 3D software vi-
sualizations (this automatically excludes surveys),
• it is peer reviewed including full papers, short
papers, and posters (this automatically excludes
books, book chapters, technical or research re-
ports, or white papers), and
• it is written in English
1
.
The publication is excluded, if
• the third dimension only serves aesthetic pur-
poses, i.e., augmented 2D visualizations (Stasko
and Wehrli, 1993), and
• it does not deal with software visualization, e.g.,
network visualization (hardware) or security.
In addition, we classified all relevant papers ac-
cording to the categories of the classification scheme.
If the classification of a paper was not unique, it was
marked, discussed by the authors, and finally included
and classified or excluded. For this reason, this step
has an iterative character. We used the reference man-
agement software Mendeley for screening and clas-
sifying the papers. The provided XML export was
helpful for further data processing.
3.5 Extract & Map Data
Major results of systematic mapping studies are fre-
quency/pie charts and bubble plots. Frequency/pie
charts show the distribution of a variable in an ab-
solute or relative manner. Bubble plots resemble x-
y scatter plots but with bubbles in category intersec-
tions where the size of a bubble represents frequencies
1
One paper was written in Italian, a language none of
the authors is fluent in.
IVAPP2015-InternationalConferenceonInformationVisualizationTheoryandApplications
66
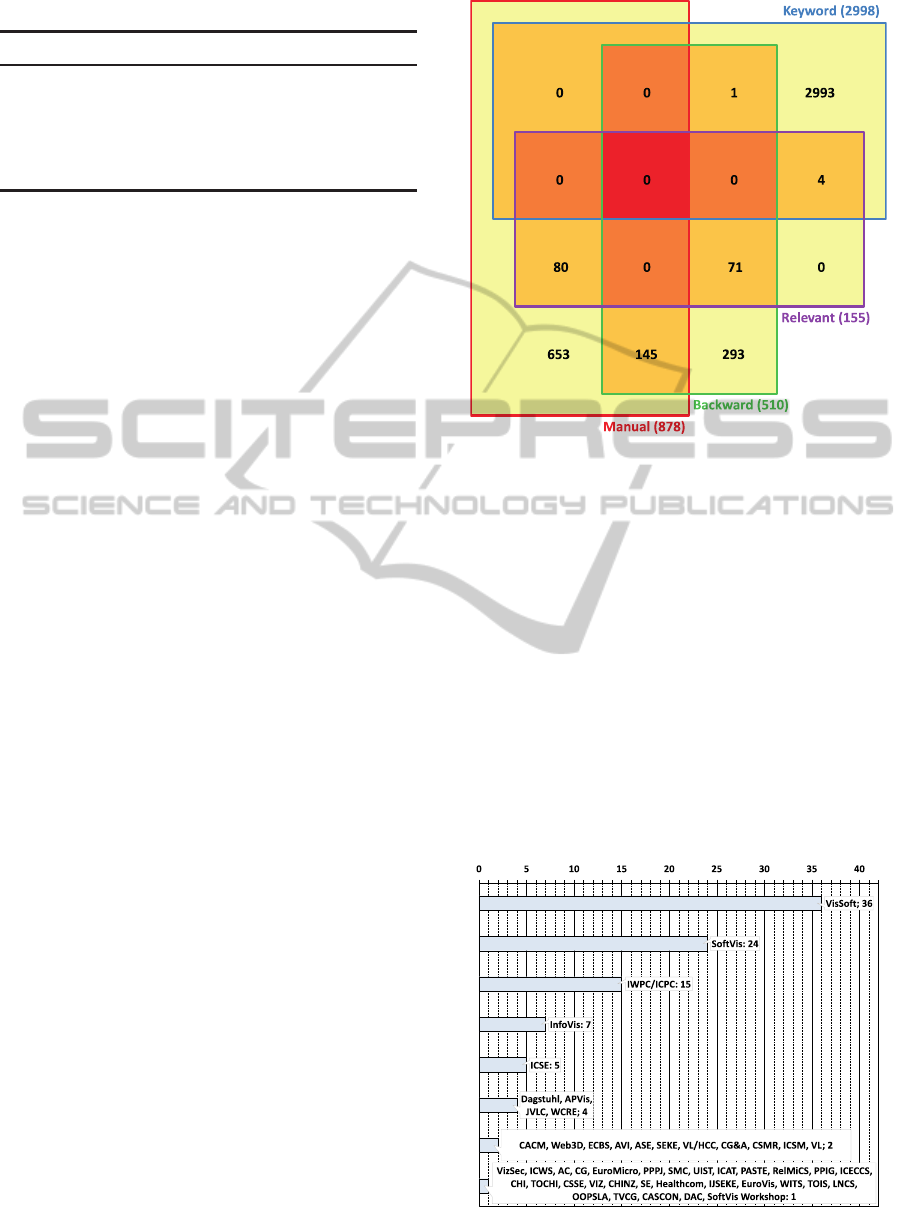
Table 2: Results for the three search strategies.
Manual Keyword Backw. Sum
Total 878 2998 510 4386
Dupl. 0 0 146 146
Other 405 2984 220 3609
2D 393 10 73 476
3D 80 4 71 155
of publications. We used Excel for data management
and the creation of the frequency/pie charts and bub-
ble plots or systematic maps respectively.
3.6 Analyze & Synthesize Papers
To get an overview of the application of the third di-
mension in software visualization, it was necessary
to conduct a more detailed analysis of the relevant
papers. This went beyond the screening process de-
scribed above. We had to study further parts of the
paper, especially sections explaining the concepts and
their implementation and the provided figures. The
results of this deeper review are also presented in a
systematic map.
3.7 Summarize Findings
Based on the results including frequency/pie charts
and the systematic maps, we deduced findings includ-
ing trends and research gaps in 3D software visual-
ization. Trends can be detected by analyzing the evo-
lution of the topic over time. Small bubbles in the
maps highlight research areas that might be under-
researched.
4 RESULTS
Table 2 shows the amount of papers identified with
each search strategy and Figure 2 details these results
with a Venn diagram.
Overall, 4386 papers were found, manually (878),
using a keyword search (2998), or using references
in surveys (510). From these, 146 papers were du-
plicates in the backward search which yields a total
of 4240 unique papers to be examined. From these,
631 papers deal with software visualization and 155
(24.6%) with 2D & 3D (41, 26.0%) or 3D only (114,
74.0%) software visualization. These were published
as full papers (116, 74.8%), short papers (17, 11.0%),
and posters (22, 14.2%). These 155 papers are the
input to the steps ‘extract & map data’ as well as ‘an-
alyze & synthesize papers’ and thus the basis for an-
swering the research questions.
Figure 2: Results for the three search strategies as a Venn
diagram.
4.1 RQ1: Which Workshops/
Conferences/ Journals Include
Papers on 3D Software
Visualization?
Figure 3 shows all workshops, conferences, and jour-
nals including papers with 3D software visualization
that were found using the method described in Sec-
tion 3.
We observed, that most of the 3D software visual-
ization papers were published on VisSoft (6 events, 30
papers before 2012) and SoftVis (5 events, 24 papers).
Figure 3: Workshops, conferences, and journals with 3D
software visualizations.
Past,Present,andFutureof3DSoftwareVisualization-ASystematicLiteratureAnalysis
67
After SoftVis and VisSoft merged in 2013, 6 papers
were published on the new VisSoft 2013. Further,
4 papers emerged from the precursor of SoftVis, the
Dagstuhl 2001 event. Altogether, 64 papers (41.29%)
containing 3D software visualization were published
on the main events.
An additional 15 papers were presented on
IWPC/ICPC (16 events). On the main visualization
conferences, a total of 9 papers are related to 3D
software visualization (InfoVis: 7, EuroVis: 1, Paci-
ficVis: 0, related conferences/workshops: 1). For the
software engineering related conferences, the count
is 10 papers (ICSE: 5, WCRE: 4, SE: 1, OOPSLA:
1). Overall, these conferences contributed 34 papers
(21.94%) to our study. 40 other venues added 57 pa-
pers (36.77%), with at most 4 additional papers per
venue.
4.2 RQ2: Which Aspects of Software
Visualization (Structure, Behavior,
Evolution) are Visualized with 3D?
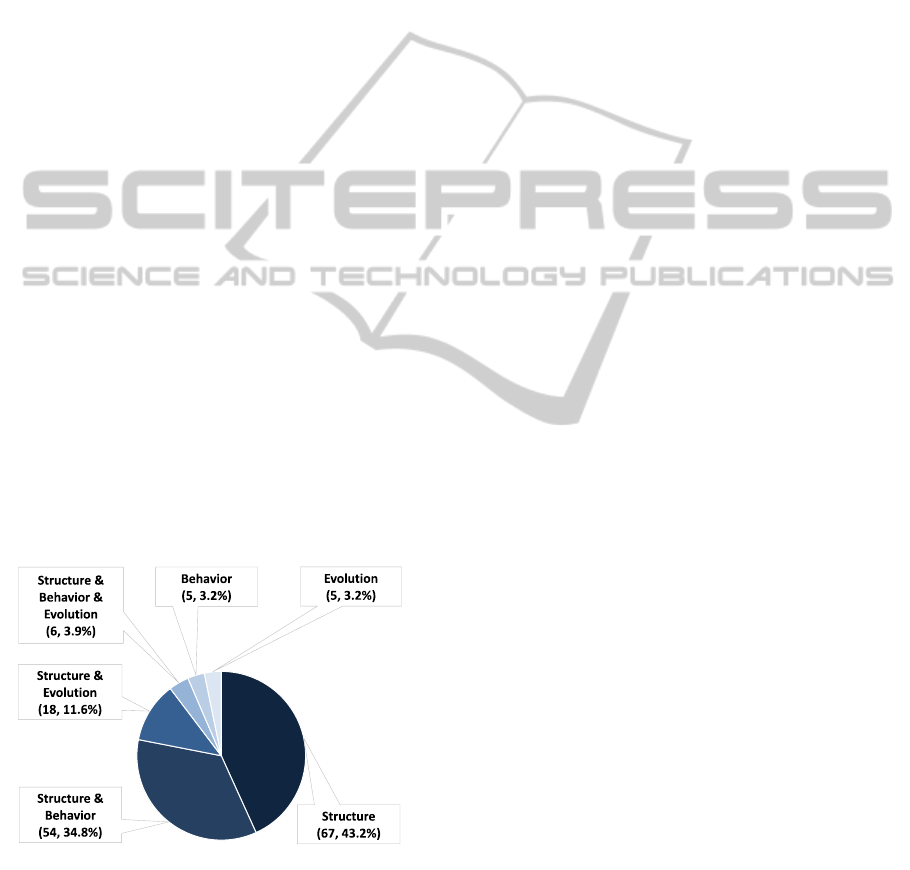
Figure 4 shows the distribution of the different aspects
displayed using 3D software visualization.
From the 155 papers analyzed, 67 (43.2%) visual-
ize structure alone, 54 (34.8%) structure and behavior,
18 (11.6%) structure and evolution, 6 (3.9%) structure
and behavior and evolution, 5 (3.2%) behavior alone,
and 5 (3.2%) evolution alone. That means, that 145
papers (93.5%) deal with structure alone or in com-
bination with behavior and/or evolution. No 3D visu-
alization was proposed for a combination of behavior
and evolution without the aspect of structure.
Figure 4: Aspect displayed using 3D software visualiza-
tions.
4.3 RQ3: How did 3D Software
Visualization evolve Over the Last
22 Years and what are Current
Trends?
Figures 5 and 6 show the evolution of 3D software vi-
sualizations from 1991 until 2013. Few papers were
found dealing explicitly with 3D software visualiza-
tion before 2001. Overall, 30 papers were published
between 1991 and 2000, between 1 and 6 papers per
year. All papers include structural aspects.
Between 2001 and 2008, 10 papers or more were
published each year on 3D software visualization,
with an exception of 2006, when only 6 papers ad-
dress this topic. Overall, from 2001 until 2008 two
thirds (67.7%) of the found papers were published.
Between 2009 and 2013, less papers were published
on this topic per year—between no papers in 2012
and eight papers in 2013. Overall, between 2001 and
2013, 126 papers dealing with 3D software visualiza-
tion were published. Most papers address structure
(56, 36.1%) or a combination of structure and behav-
ior (40, 25.8%), structure and evolution (13, 8.4%),
and structure, behavior, and evolution (6, 3.9%). Be-
havior alone (5, 3.2%) and evolution alone (5, 3.2%)
are rarely considered. It is remarkable, that the or-
der of the different aspects or combinations of aspects
regarding the amount of papers published stays the
same, independently of the year or the amount of pa-
pers published with only few exceptions: in 1994,
1995, and 1996 only papers combining structure and
behavior were published, structure and evolution (2)
is ranked first in 1997 before structure alone (1) and
structure and behavior (1), structure and behavior (7)
is ranked first in 2001 before structure alone, structure
and evolution (4) is ranked first together with struc-
ture alone (4) in 2008 before structure and behavior
(3), and finally structure and behavior (3) is ranked
first in 2013 before structure alone (2), structure, be-
havior, and evolution (2), and structure and evolution
(1). However, the amount of papers including 3D
software visualization is already small for each year.
4.4 RQ4: How is the Usefulness of the
proposed 3D Software
Visualizations Evaluated?
Figure 7 shows the different aspects of 3D software
visualization and their evaluation methods. Some 3D
software visualizations were evaluated using several
different evaluation methods. Therefore, the total
count is larger than the total number of papers ana-
lyzed.
IVAPP2015-InternationalConferenceonInformationVisualizationTheoryandApplications
68
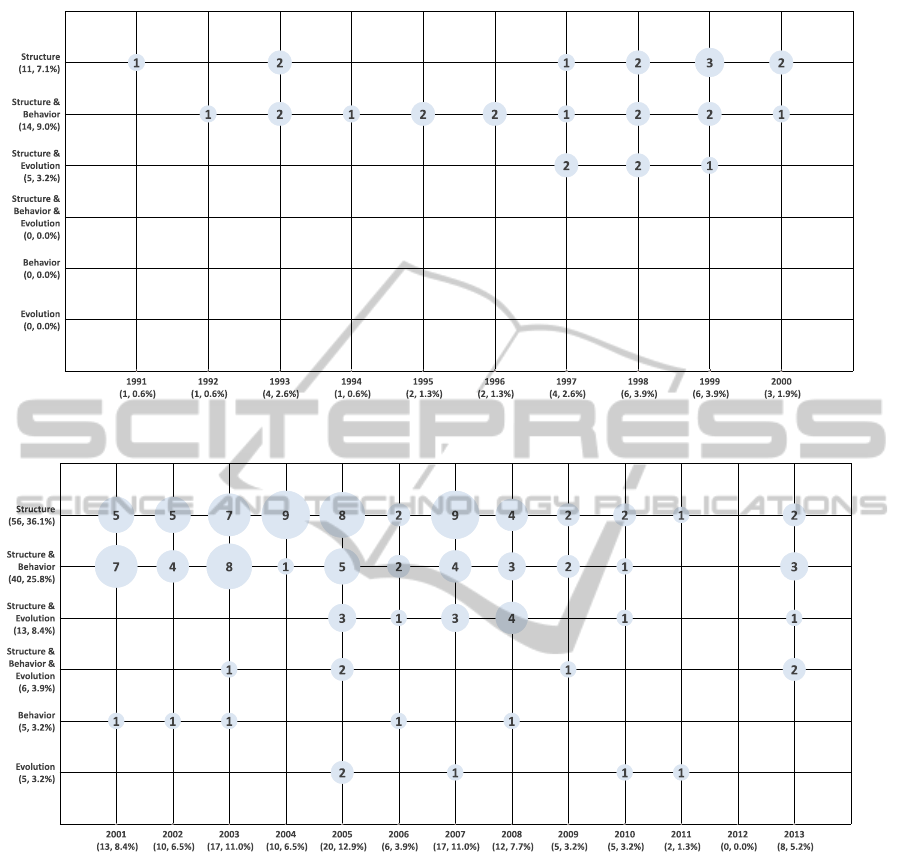
Figure 5: Time vs. aspect for 3D software visualizations (1991-2000).
Figure 6: Time vs. aspect for 3D software visualizations (2001-2013).
The different aspects or combinations of aspects
were mostly evaluated using case studies showing
working examples (89, 53.3%) or not evaluated at
all (27, 16.2%). Some 3D visualizations were eval-
uated using case studies that involve representative
users (19, 11.4%). Few 3D visualizations were eval-
uated using controlled experiments (15, 9.0%). Other
evaluation methods used were guideline checking (10,
6.0%), questionnaires (7, 4.2%), and heuristic evalu-
ations (2, 1.2%).
With respect to the combination of aspect and
evaluation method, the bubble chart does not exhibit
any particularities. As most numbers are small, the
difference in ratios does not provide evidence for re-
lationships.
4.5 RQ5: How is the Third Dimension
Used?
Figure 8 shows the different aspects of 3D software
visualization and their application of the third dimen-
sion.
As a paper might contain multiple visualizations
or a visualization might belong to different categories
at the same time, the sum is larger than the number of
papers.
Most papers extended 2D visualizations (76,
39.4%), followed by full 3D (47, 24.4%), 2D layout
organized in 3D (31, 8.8%), 3D as time (17, 8.8%),
and stacked views (11, 5.7%). Another 11 papers
(5.7%) apply 3D for cognition only, while local fish-
Past,Present,andFutureof3DSoftwareVisualization-ASystematicLiteratureAnalysis
69
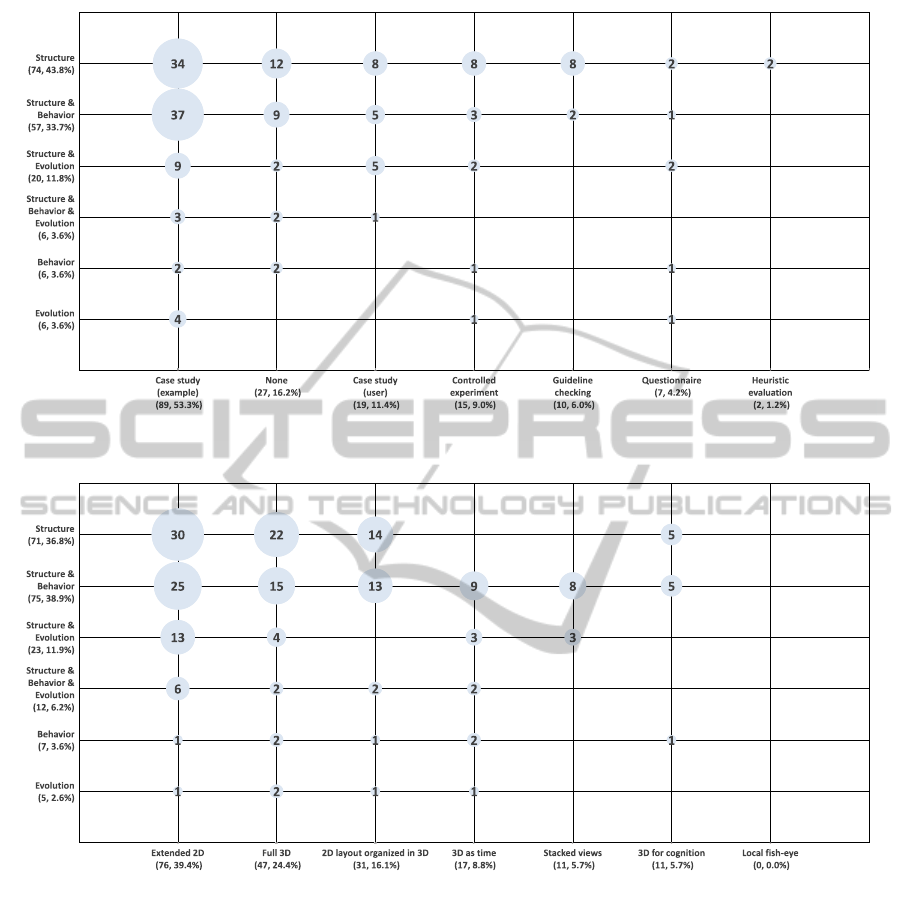
Figure 7: Evaluation methods vs. aspect for 3D software visualizations.
Figure 8: Application of the third dimension vs. aspect for 3D software visualizations.
eye is not applied at all. The latter two will not be
considered for the remaining analysis.
3D is applied for structure alone using extended
2D (30), full 3D (22), and 2D layout organized in 3D
(14). Further, extended 2D and full 3D are used for
all aspects and all combinations of aspects. 2D layout
organized in 3D is used for all aspects except struc-
ture and evolution. In contrast, 3D as time is mostly
used for structure and behavior (9), while only few
paper use it for structure and evolution (3), structure,
behavior, and evolution (2), behavior alone (2), and
evolution alone (1). Finally, stacked views are only
used for structure and behavior (8) and structure and
evolution (3). Neither 3D as time nor stacked views
are used for structure alone.
5 FINDINGS
Most papers dealing with 3D software visualization
were published on the major software visualization
conferences and workshops VisSoft (workshop until
2011), SoftVis (conference until 2010), and VisSoft
conference (since 2013). A substantial amount of pa-
IVAPP2015-InternationalConferenceonInformationVisualizationTheoryandApplications
70
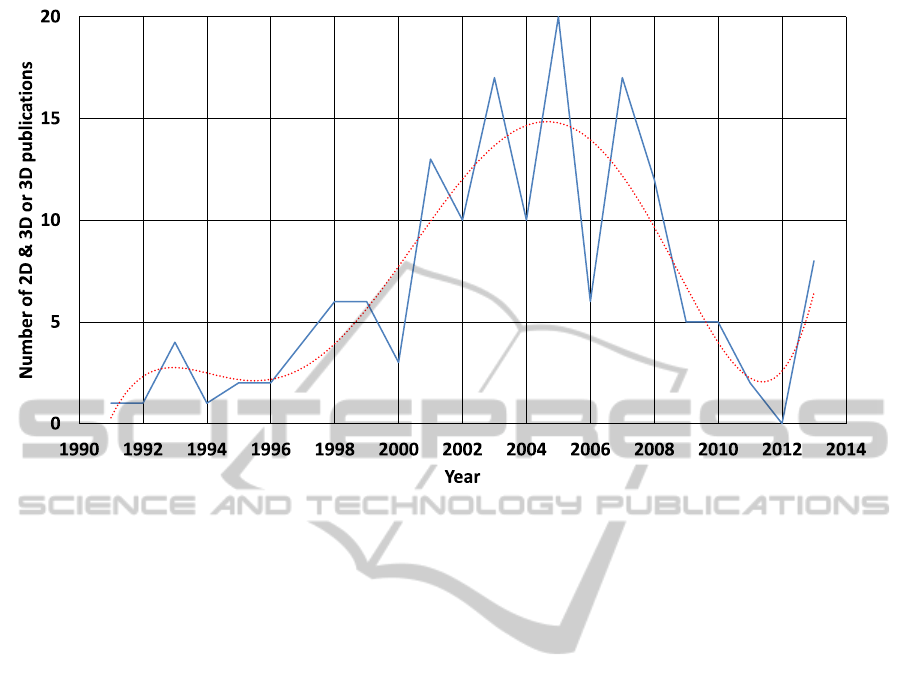
Figure 9: Number of 2D & 3D or 3D publications over time.
pers was also published at IWPC/ICPC and InfoVis.
However, more than one third of the papers was pub-
lished on 45 different venues.
An important functional requirement of a soft-
ware visualization tool are multiple views (Kienle and
M¨uller, 2007). These multiple views provide a holis-
tic view of a software system combining structure,
behavior, and/or evolution and thus facilitate program
comprehension. The majority of 3D visualizations fo-
cus on structure, either alone (67, 43.2%) or in combi-
nation with behavior or evolution (72, 46.4%). Struc-
ture plays an important role in software visualization,
as one main objective is to give the formerly intangi-
ble and invisible phenomenon software a meaningful
shape (Graˇcanin et al., 2005). For the structural enti-
ties, such as namespaces/packages, classes, methods,
as well as attributes, and their relations suitable rep-
resentations are developed. The combination of these
representations form the basic shape of a visualiza-
tion that is usually enriched with behavioral or evo-
lutionary information. However, the combination of
all three aspects is rare in the analyzed 3D software
visualizations (6, 3.9%). One reason for this might be
the complexity such an approach requires. It is nec-
essary to combine structural information with a large
amount of data from execution traces and from ver-
sion control systems. This might be interpreted as a
serious deficit of prototype implementations and as a
research gap as well.
The temporal analysis of the sample reveals that
researchers started in 1991 to scrutinize the visu-
alization of structure of software in 3D. One year
later, behavioral aspects, and six years later evolu-
tionary aspects, were also examined. Before 2001,
there was no 3D software visualization covering all
three aspects or behavior or evolution alone. In 2001,
the field of software visualization started to establish
with first tracks on software engineering conferences
and the Dagstuhl seminar. Since 2002, first confer-
ences exclusively on software visualization have been
launched. These events have influenced the further
evolution of this area. For example, the fluctuations
of the number of 3D publications depend on the dates
of the main conferences. In 2005, there was the high-
est number of publications (20) probably because Vis-
Soft and SoftVis took place at the same time. In 2012,
there was no publication and obviously none of these
two events took place. Additionally, it was found that
there was a trend to develop more 3D visualizations
between 2001 and 2008 (67.7% of the papers found)
with its peak around 2005 (Figure 9). The trend since
then has to be analyzed taking into account that the
3D survey of (Teyseyre and Campo, 2009) appeared
in 2009. Thus, only the main conferences or work-
shops contribute to the amount of 3D software sys-
tems while other venues are not represented. Fur-
ther, 2012 no event dedicated to software visualiza-
tion took place. Further analysis will show, if there is
a trend to continue developing 3D software visualiza-
tions.
Past,Present,andFutureof3DSoftwareVisualization-ASystematicLiteratureAnalysis
71

The applied evaluation methods are distributed
as follows: anecdotal (≈ 53%), empirical (≈ 24%),
and analytical (≈ 7%). Further, a large number of
visualizations does not have any evaluation at all
(≈ 16%). This is not surprising as no evaluation
at all means least effort, while anecdotal evidence
can be provided with some effort. Empirical stud-
ies, on the other hand, imply a large effort for plan-
ning, execution, and analysis. At the same time, the
target group—experienced software developers—are
not readily available for experiments. Finally, most
visualizations are already built taking guidelines into
account. Therefore, guideline checking will rarely
provide any benefits. In summary, the formerly stated
need for more empirical evaluations of 3D software
visualizations by (Teyseyre and Campo, 2009) still
exists.
The most frequently used category for the applica-
tion of the third dimension is extending a 2D visual-
ization (76, 39.4%). The resulting additional dimen-
sion is used for example to represent software metrics,
such as LOC (Boccuzzo and Gall, 2007; Alam and
Dugerdil, 2007; Wettel and Lanza, 2007; Kuhn et al.,
2010), complexity (Sharif and Jetty, 2013; Balogh
and Beszedes, 2013), or the number of modifications
(Steinbr¨uckner and Lewerentz, 2010), for relations
(Balzer et al., 2004; Caserta et al., 2011), as well as
for instances (Greevy et al., 2005; Waller et al., 2013).
In some cases, the use of this dimension is config-
urable by the user (Marcus et al., 2003; L¨owe and
Panas, 2005).
In the next two categories—full 3D (47, 24.4%)
and 2D layout organized in 3D (31, 16.1%)—the ad-
vantage of 3D lies in the additional space that is avail-
able to represent solid 3D shapes or to optimize the
layout, e.g., to avoid edge-crossings in graphs. The
categories 3D as time (17, 8.8%) and stacked views
(11, 5.7%) are exclusively used in visualizations con-
taining behavioral and/or evolutionary information.
Hence, these two categories are suitable for represent-
ing dynamics.
Finally, 3D is used for cognition (11, 5.7%). (Irani
and Ware, 2003) compared 2D UML diagrams and
3D geon diagrams in several experiments. Theyfound
out that substructures can be identified more accu-
rately with shaded components than with 2D outline
equivalents and that they are remembered more reli-
ably. Here, the third dimension does not convey ad-
ditional information but it facilitates the perception of
the human visual system.
To sum it up, it could be helpful to start with a
basic 2D shape visualizing the structure of a software
system. Further, this basic shape is extended with be-
havioral and evolutionary aspects using one or a com-
bination of the identified applications of the third di-
mension. That is, a useful software visualization is
not necessarily limited to 3D. Rather, the optimal in-
terplay between 2D and 3D may be the clue to the
successful integration of all three aspects.
6 THREATS TO VALIDITY
6.1 Reliability
We have described our method in detail and men-
tioned all sources in order to make this study repeat-
able.
6.2 Objectivity
The researcher bias mainly influences the selection
and the classification of papers.
6.2.1 Selection of Papers
We increased the representative quality of the study
by triangulating three different search methods. We
started with manual browsing of the proceedings of
the main software visualization events, continued
with a keyword search of important information visu-
alization conferences, and finished with a backward
search using state-of-the-art surveys in the field of
software visualization.
6.2.2 Classification of Papers
Each paper whose classification was not clear, was
marked as ‘needs review’ and thoroughly discussed.
Overall, there were three iterations in the ‘screen &
classify’ step with altogether 60 discussable papers.
6.3 Internal and External Validity
We addressed the internal validity of our study by
starting with a top-down approach to built the clas-
sification scheme. Thus, we used an established base
for the categories. We have tried to increase the exter-
nal validity by increasing the representative level of
the sample as described in Section 6.2.1.
7 CONCLUSION
We performed a systematic literature analysis using a
hybrid approach that combined a systematic mapping
study followed by a systematic literature review. The
IVAPP2015-InternationalConferenceonInformationVisualizationTheoryandApplications
72

research questions addressed where papers about 3D
software visualization were published, which aspects
were visualized, how the topic evolved over the last
22 years, how the usefulness of the 3D software visu-
alizations was evaluated, and how the third dimension
was used.
The results show that the aspect ‘structure’, the
evaluation method ‘case study (example)’, and the ap-
plication of the third dimension ‘extended 2D’ are
dominant. The combination of ‘structure’ with ‘be-
havior’ or ‘evolution’ was also found relatively often.
Although, the combination of all three aspects in
one software visualization tool providing a holistic
view is complex and challenging to implement, we
see therein a research gap for the future.
The need for more empirical evaluations of 3D
software visualizations stated earlier still exists and
should be addressed in future work.
Finally, the third dimension is mainly used to rep-
resent software metrics. Other successful applications
are to use the additional space for solid 3D shapes and
for an optimized layout, to represent time, and to am-
plify cognition. Probably, the optimal interplay be-
tween 2D and 3D views plays an important role in the
future.
REFERENCES
Alam, S. and Dugerdil, P. (2007). EvoSpaces Visualization
Tool: Exploring Software Architecture in 3D. In 14th
Work. Conf. Reverse Eng., pages 269–270.
Alspaugh, T. A., Tomlinson, B., and Baumer, E. (2006).
Using social agents to visualize software scenarios. In
Proc. 2006 ACM Symp. Softw. Vis., pages 87–94, New
York, New York, USA. ACM Press.
Andrews, K. (2008). Evaluation comes in many guises. In
Proc. 2008 AVI Work. BEyond time errors Nov. Eval.
methods Inf. Vis., pages 8–10.
Balogh, G. and Beszedes, A. (2013). CodeMetropolis - a
Minecraft based collaboration tool for developers. In
1st IEEE Work. Conf. Softw. Vis., pages 1–4.
Balzer, M., Noack, A., Deussen, O., and Lewerentz, C.
(2004). Software landscapes: Visualizing the struc-
ture of large software systems. In Proc. Sixth Jt. Eu-
rographics - IEEE TCVG Conf. Vis., pages 261–266.
Eurographics Association.
Boccuzzo, S. and Gall, H. (2007). CocoViz: Towards Cog-
nitive Software Visualizations. In 4th Int. Work. Vis.
Softw. Underst. Anal., pages 72–79. IEEE.
Bohner, S. A., Gracanin, D., Henry, T., and Matkovic, K.
(2007). Evolutional Insights from UML and Source
Code Versions using Information Visualization and
Visual Analysis. In 4th Int. Work. Vis. Softw. Underst.
Anal., pages 145–148.
Brocke, J. V., Simons, A., and Niehaves, B. (2009). Re-
constructing the giant: On the importance of rigour
in documenting the literature search process. In 17th
Eur. Conf. Inf. Syst., pages 1–13.
Caserta, P. and Zendra, O. (2011). Visualization of the
Static Aspects of Software: A Survey. IEEE Trans.
Vis. Comput. Graph., 17(7):913–933.
Caserta, P., Zendra, O., and Bod´enes, D. (2011). 3D Hierar-
chical Edge bundles to visualize relations in a software
city metaphor. In 6th Int. Work. Vis. Softw. Underst.
Anal.
Churcher, N. and Tech, V. (2003). Visualising Class Cohe-
sion with Virtual Worlds. In Proc. Asia-Pacific Symp.
Informattion Vis.
Cooper, H. M. (1988). Organizing knowledge synthe-
ses: A taxonomy of literature reviews. Knowl. Soc.,
1(1):104–126.
Denford, M., O’Neill, T., and Leaney, J. (2002).
Architecture-based Visualisation of Computer Based
Systems. 9th Annu. IEEE Int. Conf. Work. Eng. Com-
put. Syst., pages 139–146.
Diehl, S. (2007). Software visualization: visualizing
the structure, behaviour, and evolution of software.
Springer.
Gil, J. and Kent, S. (1998). Three dimensional software
modelling. In 20th IEEE Int. Conf. Softw. Eng., pages
105–114.
Graˇcanin, D., Matkovi´c, K., and Eltoweissy, M. (2005).
Software Visualization. Innov. Syst. Softw. Eng.,
1(2):221–230.
Greevy, O., Lanza, M., and Wysseier, C. (2005). Visualiz-
ing Feature Interaction in 3-D. In 3rd Int. Work. Vis.
Softw. Underst. Anal., pages 114–119. IEEE.
Hundhausen, C. D. (1996). A meta-study of software visu-
alization effectiveness.
Hundhausen, C. D., Douglas, S. A., and Stasko, J. T. (2002).
A Meta-Study of Algorithm Visualization Effective-
ness. J. Vis. Lang. Comput., 13(3):259–290.
Irani, P. and Ware, C. (2003). Diagramming information
structures using 3D perceptual primitives. ACM Trans.
Comput. Interact., 10(1):1–19.
Jackson, S., Devanbu, P., and Ma, K.-l. (2002). Interactive
Poster: Addressing Scale and Context in Source Code
Visualization. In InfoVis.
Kienle, H. M. and M¨uller, H. A. (2007). Requirements of
Software Visualization Tools: A Literature Survey. In
4th Int. Work. Vis. Softw. Underst. Anal., pages 2–9.
IEEE.
Koike, H. and Chu, H.-C. (1998). How does 3-D visu-
alization work in software engineering?: empirical
study of a 3-D version/module visualization system.
In Proc. 20th Int. Conf. Softw. Eng., pages 516–519.
IEEE Computer Society.
Kuhn, A., Erni, D., and Nierstrasz, O. (2010). Embed-
ding spatial software visualization in the IDE: an ex-
ploratory study. In Proc. 5th Int. Symp. Softw. Vis.,
pages 113–122, New York, USA. ACM Press.
Lanza, M., D’Ambros, M., Bacchelli, A., Hattori, L., and
Rigotti, F. (2013). Manhattan: Supporting real-time
visual team activity awareness. In 21st Int. Conf.
Progr. Compr., pages 207–210.
Past,Present,andFutureof3DSoftwareVisualization-ASystematicLiteratureAnalysis
73

L¨owe, W. and Panas, T. (2005). Rapid construction of soft-
ware comprehension tools. Int. J. Softw. Eng. Knowl.
Eng., 15(6):905–1023.
Mackinlay, J., Robertson, G., and Card, S. (1991). The
perspective wall: Detail and context smoothly inte-
grated. In ACM Conf. Hum. Factors Comput. Syst.,
pages 173–179.
Maletic, J., Marcus, A., and Collard, M. (2002). A task ori-
ented view of software visualization. In 1st Int. Work.
Vis. Softw. Underst. Anal., pages 32–40. IEEE Com-
put. Soc.
Marcus, A., Feng, L., and Maletic, J. (2003). Compre-
hension of software analysis data using 3D visualiza-
tion. In 11th Int. Work. Progr. Compr., page 105. IEEE
Computer Society.
Munzner, T. (1997). H3: laying out large directed graphs in
3D hyperbolic space. In Vis. Conf. Inf. Vis. Symp. Par-
allel Render. Symp., pages 2–10. IEEE Comput. Soc.
Petersen, K., Feldt, R., Mujtaba, S., and Mattsson, M.
(2008). Systematic mapping studies in software engi-
neering. In Proc. 12th Int. Conf. Eval. Assess. Softw.
Eng., pages 68–77. British Computer Society.
Reiss, S. P. (1995). An Engine for the 3D Visualiza-
tion of Program Information. J. Vis. Lang. Comput.,
6(3):299–323.
Rilling, J. and Mudur, S. (2005). 3D visualization tech-
niques to support slicing-based program comprehen-
sion. Comput. Graph., 29(3):311–329.
Ripley, R. M., Sarma, A., and van der Hoek, A. (2007).
A Visualization for Software Project Awareness and
Evolution. In 4th Int. Work. Vis. Softw. Underst. Anal.,
pages 137–144. IEEE.
Robertson, G., Mackinlay, J., and Card, S. (1991). Cone
trees: animated 3D visualizations of hierarchical in-
formation. In ACM SIGCHI Conf. Hum. Factors Com-
put. Syst., pages 189–194.
Sarkar, M., Snibbe, S. S., Tversky, O. J., and Reiss, S. P.
(1993). Stretching the Rubber Sheet: A Metaphor
for Viewing Large Layouts on Small Screens. In
6th Annu. ACM Symp. User Interface Softw. Technol.,
UIST ’93, pages 81–91, New York, NY, USA. ACM.
Schots, M., Vasconcelos, R., and Werner, C. (2014). A
Quasi-Systematic Review on Software Visualization
Approaches for Software Reuse. Technical report,
Federal University of Rio de Janeiro, Rio de Janeiro,
Brazil.
Schots, M. and Werner, C. (2014). Using a Task-Oriented
Framework for the Characterization of Visualization
Approaches. In 2nd IEEE Work. Conf. Softw. Vis.
Seriai, A., Benomar, O., Cerat, B., and Sahraoui, H. (2014).
Validation of Software Visualization Tools : A Sys-
tematic Mapping Study. In 2nd IEEE Work. Conf.
Softw. Vis.
Sharif, B. and Jetty, G. (2013). An Empirical Study Assess-
ing the Effect of SeeIT 3D on Comprehension. In 1st
IEEE Work. Conf. Softw. Vis.
Sjøberg, D. I. K., Dyb˚a, T., and Jørgensen, M. (2007). The
Future of Empirical Methods in Software Engineering
Research. In Futur. Softw. Eng., pages 358–378. IEEE.
Stasko, J. and Wehrli, J. (1993). Three-dimensional com-
putation visualization. Proc. 1993 IEEE Symp. Vis.
Lang., pages 100–107.
Steinbr¨uckner, F. and Lewerentz, C. (2010). Represent-
ing development history in software cities. In Proc.
5th Int. Symp. Softw. Vis., pages 193–202, New York,
USA. ACM Press.
Teyseyre, A. R. and Campo, M. R. (2009). An overview of
3D software visualization. IEEE Trans. Vis. Comput.
Graph., 15(1):87–105.
von Pilgrim, J. and Duske, K. (2008). Gef3D: a frame-
work for two-, two-and-a-half-, and three-dimensional
graphical editors. In Proc. 4th ACM Symp. Softw.
Vis., pages 95–104, New York, New York, USA. ACM
Press.
Waller, J., Wulf, C., Fittkau, F., D¨ohring, P., and Hassel-
bring, W. (2013). SynchroVis : 3D Visualization of
Monitoring Traces in the City Metaphor for Analyz-
ing Concurrency. In 1st IEEE Work. Conf. Softw. Vis.,
pages 7–10.
Wettel, R. and Lanza, M. (2007). Visualizing Software Sys-
tems as Cities. In 4th Int. Work. Vis. Softw. Underst.
Anal., pages 92–99. IEEE.
Wettel, R. and Lanza, M. (2008). Visually localizing de-
sign problems with disharmony maps. In Proc. 4th
ACM Symp. Softw. Vis., pages 155–164, New York,
New York, USA. ACM Press.
IVAPP2015-InternationalConferenceonInformationVisualizationTheoryandApplications
74
