Cardiac Arrhythmias Classification and Compression
using a Hybrid Technique
Asiya M. Al-Busaidi, Lazhar Khriji and Abdulnasir Y. Hossen
Department of Electrical and Computer Engineering, College of Engineering, Sultan Qaboos University,
Muscat, Oman
1 RESEARCH PROBLEM
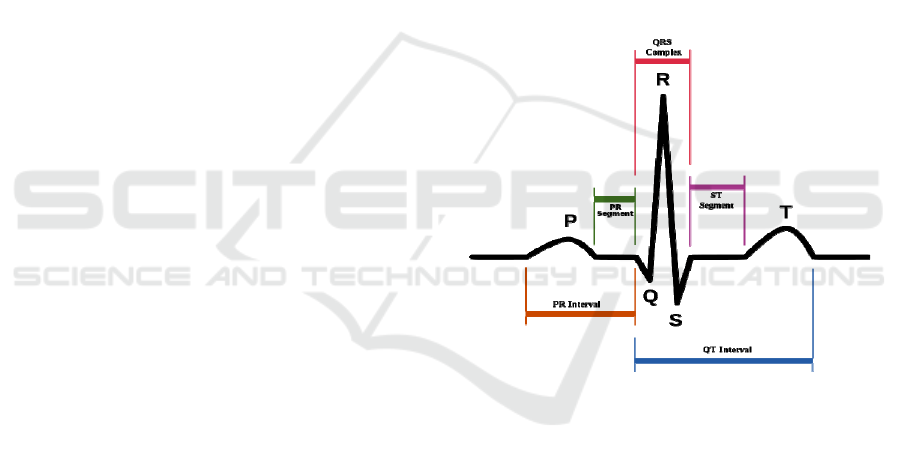
The electrocardiogram (ECG) is a very important
biomedical signal to assess the cardiac health. The
ECG waveform is a unique signal that can be broken
down into three waves; P, QRS-complex and T, and
three segments PR, ST and RR interval as shown in
Figure 1 (Rangayyan, 2006). Each segment or wave
represents a vital process in the heart. Any
abnormalities or irregular rhythmic activities are
called arrhythmias. Cardiac arrhythmias are
indication of a cardiac disease or heart
abnormalities. According to the World Health
Organization statistics, cardiovascular diseases
(CVD) and ischemic heart diseases are the most
leading causes of mortality around the world (WHO,
2011). Heart diseases are not just the leading cause
of death nowadays but they are also considered as a
modern epidemic. Arrhythmias are usually
investigated visually, which is a very hard and time
consuming procedure in case of dealing with many
patients. Thus, automatic diagnostic methods were
developed to provide fast diagnosis that may lead to
early detection of heart diseases. Early detection of
the heart diseases can prevent the progression of
chronic diseases by proper and immediate treatment.
Generally, there is no fixed algorithm to assess
the ECG signal. There are plenty of ECG
classification methods that produce very sufficient
discrimination results. However, when it comes to
real-time analysis using low-power devices, the
power consumption, complexity of the algorithm
and memory required should be taken into
consideration.
Wearable health monitoring devices are one of
the new interesting fields of reasearch. A miniature
ECG sensor can record, compress and transmit the
data via cellular transform method to a remote base
station or hospital where the data are analysed and
stored. The technology of attaching a group of low-
power, miniaturised, invasive/ non-invasive light-
weight wireless sensors on human body to measure
Figure 1: Schematic diagram of normal sinus rhythm for a
human heart as seen on ECG (Automated ECG
Interpretation, 2014).
the biomedical signals is called Wireless Body Area
Network (WBAN) or Wireless Body Area Sensor
Network (WBASN). Despite the huge number of
published results, WBAN-based healthcare
monitoring is still in its infancy. Therefore, there are
challenges that have to be addressed while designing
such systems. Researchers have to compromise
between high reliability and low power consumption
and this can be achieved in software level by
designing an algorithm with low computational
complexity.
The limited band-width channel and battery
consumption should be taken into account while
real-time transmission. Continuous real-time
transmission can consume a lot of energy. Thus, the
ECG signal has to be compressed to reduce the data-
rate and power consumption. The compression of
ECG signal has to be conducted without distorting
the clinical features used for diagnosis. In fact the
ECG signal has to be processed before compression
and transmission.
The purpose of this work is to design a new
hybrid technique based on Wavelet Transform
(WT). The hybrid algorithm is aiming to combine
14
Al-Busaidi A., Khriji L. and Y. Hossen A..
Cardiac Arrhythmias Classification and Compression using a Hybrid Technique.
Copyright
c
2015 SCITEPRESS (Science and Technology Publications, Lda.)

pre-processing and post-processing tasks which are
de-noising, compression and classification of the
ECG signals. The ultimate goal of this hybrid
algorithm is to obtain sufficient diagnosis results
with low computational loads to overcome the
limitation of low-powered wearable health
monitoring devices. The algorithm will be tested and
validated using standard databases and standard
evaluate matrices.
The motivations behind this research work are
summarized as follows:
The development of wireless sensor networks
for health care requires more sufficient real-
time analysis methods that satisfy the limitation
of these systems;
The discrimination of cardiac arrhythmias is
still an open research field and many
classification techniques have not been tested
on ECG signals yet;
The hybrid compression and classification
techniques showed promising performance
compared to the classical techniques.
2 OUTLINE OF OBJECTIVES
The objective of this research is to design a hybrid
denoising, compression and classification algorithm
for ECG signal. This algorithm should be suitable
for low-powered wearable ECG devices integrated
with wireless technology. This system will consist of
the following specific parts and tasks:
Pre-processing: denoising and preparing signal
for compression and classification.
Compression: encoding scheme to compress
the signal before transmission and then decode
the signal.
Post-processing: feature extraction for
classification and diagnosis.
Classification of Arrhythmias: automatic
classification of cardiac arrhythmias using a
hybrid technique.
3 STATE OF THE ART
3.1 Background and Related Work
According to American Heart Association (AHA),
an ECG signal recording must consist of at least 3
individual leads, each with 10 bits resolution and
500 Hz sampling time. If these signals were digitally
recorded on an ECG Holter for 24 hours, a huge
memory is required to store them. Thus, ECG
compression is a must in storage and transmission
over a limited bandwidth. In wearable battery-
powered devices the sampling frequency can be
reduced to 250Hz since the ECG data are used for
monitoring and not for deep diagnosis. Since the
wearable medical sensor are preferred to be with
low-cost and low-power consumption, a proper
transmission protocol needs to be followed. Many
optimised and new protocols were developed in
MAC layer (Otal et al., 2009; Lamprinos et al.,
2004), physical layer and application layer (Zhou et
al., 2008; Adibi, 2012; Lu et al., 2013). One another
solution to reduce the data rate is by compressing the
transmitted data to fit into the channel limited
capacity. Here we are going to focus on the proper
compression methods for ECG signals.
For typical biomedical signals using lossless
compression techniques can only achieve
Compression Ratios (CR) in the order of 2 to 1. On
the other hand, lossy techniques may produce CR in
the order of 10 to 1 or more. In lossy methods; there
is some kind of quantization of the input data which
leads to higher CR results at the expense of
reversibility. But this may be acceptable as long as
no clinically significant degradation is introduced to
the encoded signal. The CR levels of 2 to 1 are too
low for most practical applications. Therefore, lossy
coding methods which introduce small
reconstruction errors are preferred in practice. In
other words, the exact reconstruction of the ECG
signal is not required, only the important features are
important. Thus, the main important factors in
compression are: (1) the ability of reconstructing the
original signal or the important features from the
compressed data, (2) the compression ratio, (3)
execution time, and (4) the amount of error between
the original and reconstructed signal.
There are many lossless compression techniques
such as; null suppression, run-length coding,
diatomic coding, pattern substitution, differencing,
facsimile, statistical-Huffman and LZ family. On the
other hand, the lossy compression methods are;
polynomial predictors and interpolators, orthogonal
transforms, Fan, AZTEC, CORTES, TP, DPCM,
ADPCM, broad family of sub-band and wavelet
coding, probabilistic neural networks and adaptive
Fourier coefficient techniques. There are also recent
trials to combine the lossy and lossless techniques
specifically for ECG signal (Abo-Zahhad et al.,
2014).
There are many measures for assessing
techniques for the adequacy of the ECG compressor.
The residual of the signal, which is the difference
CardiacArrhythmiasClassificationandCompressionusingaHybridTechnique
15

between the original signal and the reconstructed
compressed signal, is one of the widely used
measures. But the low residual doesn’t guarantee
that the reconstructed signal has acceptable quality
for clinical diagnosis. The reconstruction error is
defined as Percent Root Mean Square Difference
(PRD) and it defined as follows:
%100
)(
)()(
=PRD
2
0
2
2
0
2
N
n
N
n
rec
nx
nxnx
(1)
where N is the total number of samples in the ECG
signal x(n), and x
rec
(n) is the reconstructed ECG
signal.
A new compression measure called “quality
score” (QS) was suggested by Fira and Goras (2008)
to represent the ratio between the compression ratio
(CR) and the PRD as shown in (2). The high quality
score indicates a good compression performance.
PRDCRQS
(2)
Biomedical signals can be compressed in time
domain, frequency domain, or time-frequency
domain (Cetin et al., 2000). Wavelet Transforms
(WT) are one of the recent transform method that
could produce higher coding results than time-
domain coding methods. The new hybrid
compression techniques combine the compression
and the classification techniques to overcome the
constraints of mobile ECG Holters (bandwidth, area,
power and resolution). Alvarado et al., (2012)
introduced a time-based compression technique
integrated with a classifier. This method can perform
diagnostic analysis (classification) method directly
on the encoded signal without reconstructing it. This
is done by sampling the signal using finite rate of
innovation (FRI) method and performing
compressive sensing (CS) on it. This method allows
real-time analysis, compression, classification and
transmission of the ECG signal. The classification is
done in the pulse domain resulted from FRI sampler
which is in fact a compression technique.
Ahmed et al. (2007) introduced a new hybrid
compression technique for ECG signals using the
singular value decomposition (SVD) combined with
discrete wavelet transform (DWT). The central idea
is to transform the ECG signal to a rectangular
matrix, compute the SVD, and then discard small
singular values of the matrix. The resulting
compressed matrix is wavelet transformed,
thresholded and coded to increase the compression
ratio. The technique has been tested on ECG signals
obtained from MIT-BIH arrhythmia database. The
results showed that data reduction with high signal
fidelity can thus be achieved with average data
compression ratio of 25.2:1 and average PRD of
3.14%. Comparison between the obtained results
and recently published results showed that the
proposed technique gives better performance.
Some works did combine the denoising scheme
with the compression scheme using wavelet
transform and other hybrid techniques. Sayadi et al.
(2008) represented an efficient denoising and lossy
compression schemes for ECG signals based on a
modified extended Kalman filter (EKF) structure.
The signal is reconstructed with regard to the
dynamical equations of the model. The
performances of the proposed method are evaluated
using standard denoising and compression efficiency
measures. Several MIT-BIH ECG databases were
used for performance evaluation and results shown
that both applications can contribute to enhance the
clinical ECG data denoising and compression
performance. For denoising, an average SNR
improvement of 10.16 dB was achieved, which is
1.8 dB more than the next benchmark methods such
as MAB-WT or EKF2. Results showed a typical
average CR of 11.37:1. Consequently, the proposed
framework is suitable for a hybrid system that
integrates these algorithmic approaches for clean
ECG data storage or transmission scenarios with
high output SNRs, high CRs, and low distortions.
We can summarize that compression techniques
can use hybrid techniques to achieve the proper CR,
resolution and execution time. Also, compression
can integrate hybrid functions like denoising, feature
extraction and classification of arrhythmias.
Most of the approaches that have been developed
for classifying cardiac arrhythmias based on surface
ECG (non-invasive).The classification methods can
be off-line methods or on-line (real-time) methods.
The offline technique may not be preferable in case
of emergency cases due the delay in data analysis. A
lot of work has been done based on Artificial Neural
Networks (ANN) techniques in classifying the ECG
signals. In fact, the ANN is a very powerful non-
linear mathematical tool based on training of
multilayer neural networks which are sometimes
called Multi-Layered Perceptron (MLP) and it is
mainly used in the pattern recognition research area
(Duda et al., 2001). ANN showed superior results in
discriminating the ECG signal (Bortolan et al., 1993;
Silipo et al., 1998; Tsipouras et al., 2005). ANN
could combine the pre-processing and post-
processing techniques for arrhythmia classification,
ischemia detection, and recognition of chronic
myocardial diseases (Silipo et al., 1998). Silipo et
al., (1998) also discussed the issue of reducing the
size of the network to get the same results or better.
BIOSTEC2015-DoctoralConsortium
16

Although, the ANN is a typical classifier used in the
hospital based ECG monitoring devices, a huge
ANN requires a lot of training time and
computational power which make it not a preferable
option for mobile ECG analysers for home-
monitoring.
Wavelet Transform (WT) is mainly used for
extracting features from signals. There are many
powerful wavelet transformation techniques such as,
Continues Wavelet Transform (CWT), Discrete
Wavelet Transform (DWT). For example, Übeyli
used DWT in analysis of ECG changes in partial
epileptic patient (Übeyli, 2008). The choice of the
wavelet family as well as the selection of the
analysing function into these families should be
proper and based on some criteria. According to
Senhadji et al., (1995) the criterion used in the first
case is the correct classification rate, and in the
second case, the correlation coefficient between the
original pattern and the reconstructed one.
Senhadji’s system was capable of discriminating
between normal, premature ventricular contraction,
and ischemic beats. Wavelet transform analysis has
high detection performance but has huge
computation overhead which also consumes a lot of
power. Bulusu (2011) also used DWT to extract
features but utilized Support Vector Machine
Approach (SVM) for arrhythmia classification. The
SVM is a binary classifier method which aims to
find the optimal separating plane and the data points
that determine the position and the orientation of the
plane. Those planes are called the support vectors.
Bulusu extracted two types of the features;
morphological features and DWT features. The
design used 12 morphological features (QS Width,
Pre RR Interval, Post RR Interval, QR Width, RS
Width, Mean Power Spectral Density, Area Under
QR, Area Under RS, Autocorrelation Value, ST
segment Deviation, Slope of ST, Correlation
coefficient with class template) and 191 discrete
wavelet transform coefficients (DWT). The features
extracted are used to train the SVM to classify six
different heart arrhythmias (N: Normal, V:
Premature Ventricular Contraction, A: Premature
Atrial Contraction, R: Right Bundle Branch Block,
L: Left Bundle Branch Block, F: Fusion). This
system resulted in an accuracy of 93.33% for ST-
episode detection and a heartbeat classification
accuracy of 90.66%. It also achieved a 96.35%
accuracy compared with the commercially available
Monebo software, which classified heart beats into
only two classes with an 89.18% accuracy. The
drawback of this system is that it takes a lot of time
during the learning phase. Bulusu recommended the
use of Hierarchical Binary Decision Tree in the
future to reduce the number of classifiers needed
during classification and to overcome the low speed
while training.
Syntactic analysis method has been utilized in
automatic diagnosis. This method depends on the
idea of transforming the original signal into vectors
of strings. The transformed signal is then
syntactically analysed to determine if the
transformed signal characterizes any fault in the
system under analysis. Many syntactic methods have
been proposed for automatic diagnosis (Koski et al.,
1995; Trahanias et al., 1990). For example, the
regular state machines, complex state machines and
fuzzy state machines have been utilized to perform
syntax analysis that can deal with imperfect and
imprecise input signals. Tumer et al. (2003) use two
level automatons (smart detection tools) with the
syntactic analysis method. The main automatons
used to identify the overall signal and the sub-
automatons to identify particular segment in the
signal (i.e. QRS and T-wave). Also, the system
incorporates fuzziness future to add flexibility to the
system in order to identify abnormalities and noises.
The syntactic analysis method showed good results
in diagnosis of nonlinear systems (ECG), but it is
noise-sensitive and has huge computations.
The new classification algorithms integrate more
than one method to have more accurate results with
less power consumption and no huge computations.
These new techniques are called hybrid techniques
and the main objective behind them is to utilize them
for miniature mobile health-care devices. Zhou et
al., (2009) combined the time-domain to detect the
QRS with syntactic method to classify the rhythm.
The rhythm classifier was designed to recognize two
kinds of QRS complex rhythms: sinus and
ventricular. The classifier is simple, fast and can be
implemented into a microprocessor or a DSP chip. It
was implemented into STAR (Système Télé-
Assistance Réparti) which is a real-time remote
continuous cardiac arrhythmia detecting and
monitoring system and it showed effective results.
Kamousi (2011) introduced a new morphology-
based algorithm by employing Dynamic Time
Warping (DTW) to measure the overall similarity in
patterns of different rhythms and distinguished VT
(ventricular tachycardia) from other rhythms such as
SVT (supraventricular tachycardia) based on
morphology differences. DTW is originally used in
automatic speech recognition by measuring the
overall similarity in patterns regardless of their
differences in time or speed. It minimizes the
difference between two given sequences by non-
CardiacArrhythmiasClassificationandCompressionusingaHybridTechnique
17

linearly warping them in the time dimension. This
method was utilized to improve the classification
rate of current ICD device. Typical Euclidean
distance method (measures distance between two
signals) can't capture the similarities of two similar
shapes with equal point to point distance. On the
other hand, DTW aligns the time axis and calculates
a more efficient distance measure between them and
gives better classification results.
Peng (2011) investigated in his work a low cost,
automatic real-time architecture for ECG arrhythmia
classification. The work integrates the Euclidean
Distance calculator and PCA methods for classifying
the different cardiac rhythms. The main contribution
in Peng’s work is the hardware implementation on
FPGA platform. The on-chip cache memory of the
system was used to store the rhythms used in
classification. As a result, the memory was
optimized and power consumption was reduced.
Since the ECG data may differ from patient to
patient, or differ for the same patient during the day,
the traditional trained classifiers may fail if applied
to the same patient. One of the approaches proposed
by Hu et al., (1997) to overcome this issue is to have
two classifiers. A global classifier that relies on a
database or table of known heart rhythms and a local
classifier that trains on patient’s specific ECG
recordings.
As most of the classification methods depend
significantly on the feature extraction step, the
selection of the best feature extraction method will
depend on the major value considered for training
time, training and testing performance (Khorrami et
al., 2010).
3.2 Motivations
There are many algorithms that are trying to
minimize the computational complexity and increase
the reliability of the analysis results. However, few
proposed algorithms integrate pre-processing,
compression and classification in a hybrid manner
and with minimal computational tasks. Therefore,
we propose a new hybrid techniques method of
compression and classification of cardiac
arrhythmias. This method will combine denoising,
compression and features extraction by utilizing
wavelet transform since it showed promising results
in ECG signal analysis. Thus, this work is aiming to
tackle the challenges of real-time compression and
classification of ECG data using battery-powered
wearable health monitoring devices. The ultimate
goal of this work is to find a novel and more reliable
algorithm to analyse the remotely monitored ECG
by means of less computational complexity
requiring minimal number of processing and
computational stages.
4 METHODOLOGY
The rhythm of the heart is indicated by beats per
minute (bpm). The normal heart rate is about 70
bpm but lower than 60 bpm during activity is
abnormal. The instantaneous heart rate could reach
values as high as 200 bpm during hard exercise or
athletic activity; but higher than this could be due to
illness, disease, or cardiac abnormalities
(Rangayyan, 2006). Thus, the proper measurements
of ECG should be taken to avoid contrary results. In
this study standard ECG data will be considered for
analysis and other real data will be collected to
double check the performance of the algorithms
proposed.
The ECG signal can be analysed directly using
time-domain analysis methods or transform-domain
methods (Manikandan et al., 2014). Unlike the direct
compression or analysis methods, the transform-
methods transform the signal into a frequency-
domain signal which reveals other features like the
frequency and energy distribution of the signal.
Wavelet transform (WT) methods will be
considered in this study due to their powerfulness in
decomposing the different ECG waveforms. The
wavelet-based techniques fit with the standard signal
filtering methods and encoding schemes and thus
producing good compression results (Addison,
2002). The ECG signal can be decomposed into J
decomposition levels as shown in Figure 2, using
lowpass g(n) and highpass h(n) FIR filter banks and
then down-sampling by a factor of 2. The
decomposed signal in each level is divided into low
frequency signal (a
n
) and high frequency signal (d
n
).
The low frequency signal a
n
is called the
approximation signal and the high frequency signal
d
n
is called the detail signal. The low frequency
signal is decomposed again into two signals and so
on up to d
J
and a
J
. The filter banks are constructed
from wavelet basis functions such as Haar,
h(n)
g(n)
d
1
h(n)
g(n)
↓2
x
or
(n)
↓2
↓2
d
2
↓2
a
2
Figure 2: DWT with 2 level of decomposition.
BIOSTEC2015-DoctoralConsortium
18
Daubechies, Biorthogonal, Coiflet, Symmlet,
Morlet, and Mexican Hat. The selection of wavelet
transform function mainly depends on the
application. The decomposed signal can be
reconstructed back again into the original signal
using reconstruction filters, which are the inverse of
the decomposition filters.
The relation between the frequency of the signal
and the decomposed sub-bands is as follows:
1
2
0
j
s
F
j
a
(3)
j
s
F
j
s
F
j
d
2
1
2
(4)
where, a
j
is the approximation coefficient, dj is the detail
coefficient, F
s
is the sampling frequency and j is the
decomposition level. The upper sub-bands hold the
high frequency contents and the frequency sub-band
is decreasing as the signal is decomposed further.
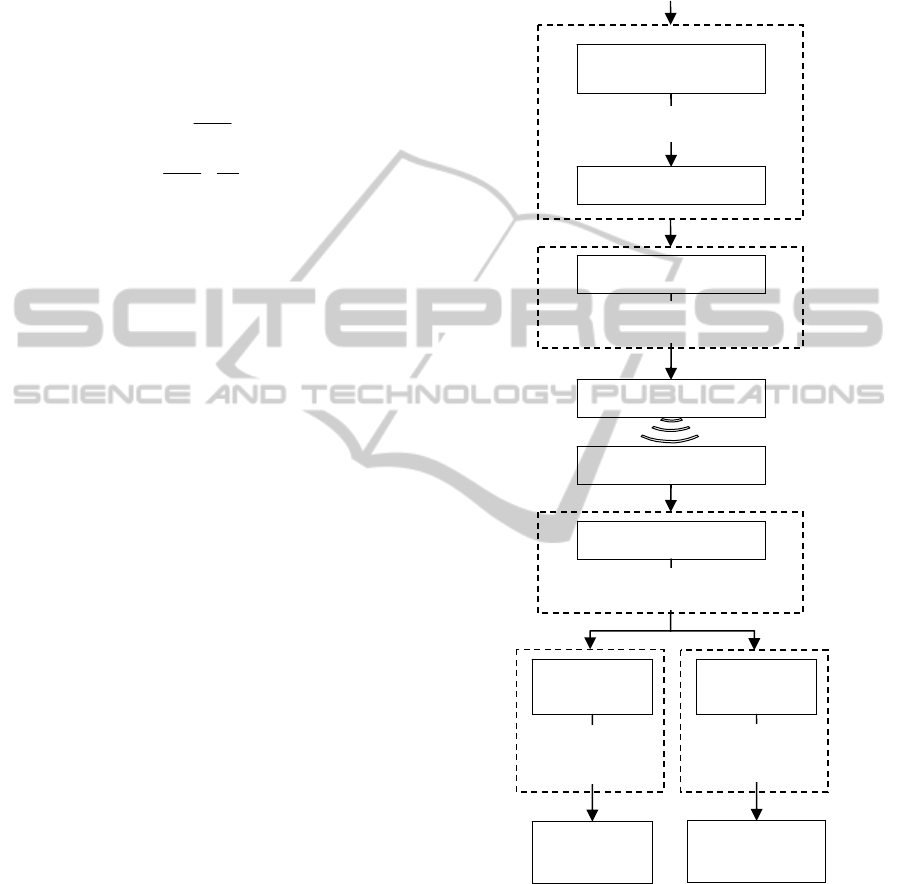
In our research, the algorithm is aiming to
compress and classify the ECG signal using wavelet
transform as illustrated in Figure 3 and described in
the following sub-sections.
4.1 Data Description
To validate our outcomes and results, standard ECG
data will be used from standard databases. The
PhysioNet website is a site dedicated to many
digitized physiological signals. The MIT-BIH
database will be adopted for analysis in this work
since it consists of ten databases for various test
purposes; i.e., the Arrhythmia Database, the Noise
Stress Test Database, the Ventricular
Tachyarrhythmia Database from Creighton
University Cardiac Center, the ST Change Database,
the Malignant Ventricular Arrhythmia Database, the
Atrial Fibrillation/Flutter Database, the ECG
Compression Test Database, the Supraventricular
Arrhythmia Database, the Long-Term Database, and
the Normal Sinus Rhythm Database. Initially we
used the MIT-BIH arrhythmia (mita) database as a
starting point for our analysis. The mita consists of
48 ECG recordings each with 30 minutes duration.
The recordings are sampled with a sampling rate of
360Hz and 11-bits resolution over a ±5mV range.
4.2 Pre-Processing
Like any electric signal, in practice the ECG signal
is corrupted by some artifacts like (Rangayyan,
2006):
Electromyogram (EMG).
Respiration and electrodes motion artifacts.
Power line interference (50/60Hz).
Base-line wandering.
Motion artifacts.
Figure 3: Proposed hybrid classification algorithm.
Those noise signals reduce the quality of the
ECG signal and prevent the correct detection and
classification of the different rhythms. Thus, the pre-
processing of the ECG signal is of great importance,
since it contributes significantly to overall
compression and classification results.
For example, Figure 4 shows a typical clean
ECG signal and the same signal correlated with
ECG Si
g
nal
Discrete Wavelet
Transfor
m
Thresholding
Wavelet Coefficients
Encoding
Compressed Signal
Transmit
Pre-processing
Compression
Receive
Decoding
Wavelet Coefficients
Decompression
Extract
Features
Features
Vecto
r
Reconstruction
Inverse
DWT
Reconstructed
Signal
Features
Vecto
r
Storage/
Display
Classification/
Diagnosis
Post-Processin
g
CardiacArrhythmiasClassificationandCompressionusingaHybridTechnique
19
50Hz power line noise. The frequency spectrum
indicates the low frequencies of the clean signal. On
the other hand, the frequency spectrum of the noisy
signal shows a 50Hz noise spectrum. To filter these
noises, digital filters can be applied on the time-
domain signal or thresholds can be applied on the
transform-domain signal. Since digital filtering is a
widely used procedure, we are going to discuss the
de-noising procedure using thresholds.
0 0.5 1 1.5 2 2.5 3 3.5 4 4.5 5
-1
-0.5
0
0.5
1
Time (s)
ECG Voltage (mV)
Clean ECG Si
g
nal
0 0.5 1 1.5 2 2.5 3 3.5 4 4.5 5
-1
-0.5
0
0.5
1
Time (s)
ECG Voltage (mV)
Noisy ECG Signal
0 50 100 150
0
0.02
0.04
0.06
0.08
0.1
Frequency (Hz)
Amplitude |X(f)|
Clean ECG
0 50 100 150
0
0.02
0.04
0.06
0.08
0.1
Frequency (Hz)
Amplitude |X(f)|
Noisy ECG
Figure 4: A typical ECG signal (mita record 100) (above),
with 50Hz interference (middle), and their frequency
spectrums (below).
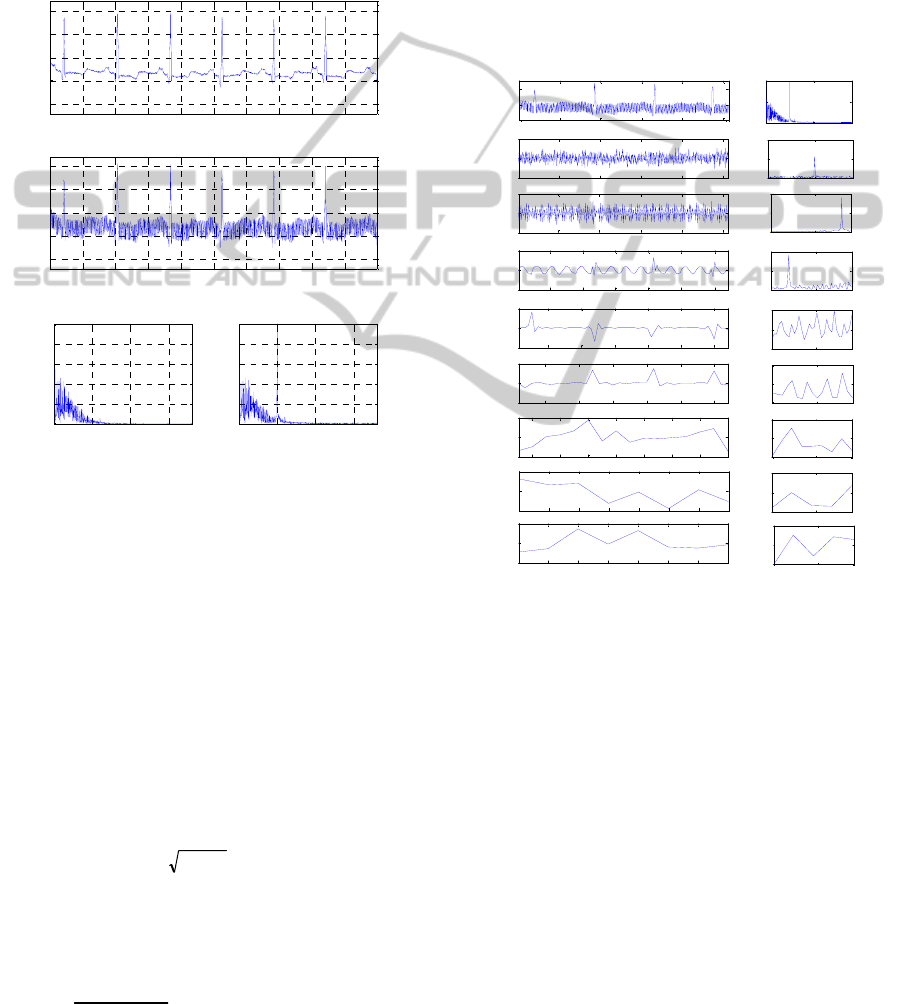
4.2.1 Threshold
The DWT can decompose the ECG signal into sub-
bands of different waveforms. By assessing the
decomposed signal in Figure 5, we can see the
different waveforms of the ECG signal and the noise
signals. The high frequency noise signals are located
in the upper sub-bands d
1
and d
2
. The power line
periodic noise is clear in d
3
sub-band. The advantage
of the wavelet decomposed coefficients is that the
noise signal can be easily removed using a threshold.
The threshold can be fixed for all sub-bands or
adaptive as in (5).
NT
n
log2
(5)
where, is the standard deviation of the Gaussian
noise of each sub-band and N is the number of
samples in the same sub-band (Quotb et al., 2011).
The Gaussian noise is calculated by (6).
6795.0
])[( ndjmedian
(6)
where d
j
[n] is the sub-band signal. However, the
median operation requires a sorting procedure of the
sub-band coefficients. Sorting process may take time
and increases the algorithm’s overhead, and this is
not desired in our design. Replacing the median by
the average value of the sub-band coefficients will
not give us the desired results. A quickselect
algorithm can replace the typical sorting algorithm
(Quickselect, 2014). In fact quickselect is a quick
sorting algorithm that reduces the averaging
complexity from O(n log n) to O(n). The complexity
reduction of other tasks will be investigated during
the project.
100 200 300 400 500
-50
0
50
d
1
0 100 180
0
10
20
|X(f)|
50 100 150 200 250
-200
0
200
d
2
0 100 180
0
50
100
|X(f)|
20 40 60 80 100 120
-500
0
500
d
3
0 100 180
0
50
100
|X(f)|
10 20 30 40 50 60
-500
0
500
d
4
0 100 180
0
20
40
|X(f)|
5 10 15 20 25 30
-500
0
500
d
5
0 100 180
0
50
100
|X(f)|
2 4 6 8 10 12 14 16
-200
0
200
d
6
0 100 180
0
50
100
|X(f)|
1 2 3 4 5 6 7 8
-200
0
200
d
7
0 100 180
0
100
200
|X(f)|
1 2 3 4 5 6 7 8
-200
0
200
Samples
a
7
0 100 180
0
50
100
Frequency (Hz)
|X(f)|
0 200 400 600 800 1000
Original
Signal
0 100 180
0
0.05
0.1
|X(f)|
Figure 5: DWT sub-band coefficients of the noisy ECG
signal (mita record 100) and the frequency spectrum of
each sub-band.
Other fact about thresholds is that they can be
soft or hard. In hard thresholding, the values less
than the predetermined threshold are set to zero and
the values higher than the threshold are kept. On the
other hand, in soft thresholding the predetermined
threshold is subtracted from the values greater than
the threshold, while the values lower than threshold
are set to zero. Practically, the soft threshold
produces smooth and continuous data which make it
suitable for denoising, while the hard threshold is
preferable in case of compression.
4.3 Compression/Decompression
The compression of the ECG signal is going to be
BIOSTEC2015-DoctoralConsortium
20

conducted on transformed-domain signal, since
experimenting compression on the transformed
signal showed better compression performance than
time-domain compression.
Lifting wavelet transforms (LWT), wavelet
packet transforms (WPT) and discrete wavelet
transforms (DWT) will be utilized individually or in
combination in this study to produce the best real-
time performance in terms of less complexity and
fast real-time performance. Compression is
conducted on the sub-band coefficients by encoding
them and removing the redundant data. This step
depends mainly on the thresholding procedure. The
threshold indicates the critical data to be preserved
and the non-critical data that can be discarded. The
thresholding procedure will significantly affect the
compression ratio (CR) and quality of the
reconstructed signal. The following subsections will
describe the thresholding and encoding procedures
proposed to be adopted.
4.3.1 Thresholding
The thresholding procedure for compression can be
different than the filtering threshold. Unlike the
adaptive threshold, in this work the threshold
(Thres
Sb
) in (7) was calculated based on the bit-
depth (B
Sb
) of each sub-band and the desired
preserved bit-length (I
Sb
). The sub-band bit-depth
B
Sb
is the most significant bit of the maximum-
magnitude coefficient in the sub-band. While, the
preserved-length I
Sb
is controlled according to the
desired compression performance where Sb stands
for the sub-band coefficients d
1
, d
2
,.., d
J
and a
J
.
1
2
sbsb
IB
sb
Thres
(7)
A round-off mechanism is applied to the DWT
coefficients before thresholding and encoding by
adding 2
Bn-Isb
to all coefficients to reduce the
truncation error (Chan et al., 2008). Where, B
n
is the
bit depth before round-off mechanism and B
Sb
after
round-off.
4.3.2 Encoding
Encoding the DWT coefficients showed sufficient
results since the upper sub-bands mainly contain
noise-like signals which are not vital and can be
discarded. Thus, the higher sub-bands can be
encoded using fewer bits.
Before encoding the coefficients, the mean of the
approximation coefficient a
J
is subtracted and it will
be added later on at the reconstruction stage. To
encode the coefficients, first they are compared to
the calculated sub-band threshold Thres
Sb
in (7). If
the magnitude of the coefficient is greater than or
equal to the sub-band threshold, it is considered as
significant; otherwise it is considered as
insignificant. The desired bits of interest of the
significant coefficient will be sent to the bits-of-
interest (BOI) packet and a one will be sent to the
significant map (SM) stream. The SM stream
indicates the sequence of significant and
insignificant coefficients by ones and zeros,
respectively. The BOI are the extracted bits from
B
sb
+1 to B
sb
-I
sb
+1, which represent BOI range,
including the sign bit (B
Sb
+1). In this works, each
BOI is stored into one byte and the same for BOI
range. Thus, I
Sb
is no more than 6 (i.e. bits 0 to 6
hold the extracted bits and bit 7 for the sign bit).
To reduce the redundant zeros in SM stream and
increase the compression ratio, it is divided into
bytes and then running length encoding (RLE) is
applied on the SM bytes. The RLE is a well-known
method that replaces the consecutive bytes with their
value followed by their number of copies (e.g. x=1 1
0 0 0 5 0 0 0 9 0 0 0 0 0 3 3 3, will be x
enc
=1 2 0 3 5
1 0 3 9 1 0 5 3 3). The SM can be easily encoded
(SMe) by encoding the consecutive zeroes. One byte
is enough to represent the number of consecutive
zeros up to 255 zeros. The last two sub-bands (a
J
and
d
J
) have fewer samples and less consecutive zeros
and thus RLE method was not applied to them.
In order to decode the encoded coefficients,
headers have to be designed properly to indicate the
content and the length of each sub-band. However,
the headers have to be designed to be as short as
possible to avoid increasing the length of the
encoded packets. In fact, the headers can be
designed with secret keys to encrypt the private data
of the patient while transmission over public
networks (Miaou et al., 2002).
4.4 Feature Extraction
Based on our initial review, we decided to extract
the features from the wavelet coefficients to feed the
classifier. Features should be selected carefully to fit
the designed classifier. The possible features can be
detected are:
QRS complex: or the R-R interval which is
used to calculate the heart rate (HR) and heart
rate variability (HRV).
P-wave and T-wave.
Power and energy.
Other parameters: such as minimum,
maximum, mean and standard deviation.
The wavelet coefficients.
CardiacArrhythmiasClassificationandCompressionusingaHybridTechnique
21

QRS is considered as an entry point for
classification schemes since HR and HRV are
derived from the RR-intervals. Thus, it has to be
estimated accurately. So far, Pan-Tompkins
detection method (Pan and Tompkins, 1985) was
tested to detect the QRS and calculate the HRV of
the ECG signal over time. Detection using wavelet
transform will be investigated during the PhD period
since it showed better results than Pan-Tompkins
detection algorithm (Köhler et al., 2002).
4.5 Classification
ECG classification in this project describes the
automated ECG interpretation or diagnosis process.
In order to classify an ECG signal; first it should be
pre-processed and then features are extracted from
it. The possible extracted features were discussed in
the previous sub-section. The features in this project
will be extracted from a single-channel lead.
Artificial neural networks (ANN), cluster
analysis, fuzzy logics and many other methods were
utilized to classify the ECG arrhythmias. However,
most of these methods are complex and require high
computational loads. Therefore, the main goal of this
research is to find a classifier that gives sufficient
diagnosis results with low computational loads by
modifying some existing methods or integrating two
methods.
4.6 Clinical Approvals
Although there are many publications about ECG
arrhythmias classification, just few of them had
clinical approvals. Our aim is to get clinical approval
for the diagnostic results from cardiologists at Sultan
Qaboos University Hospital (SQUH). This step will
be done since low reconstruction error doesn’t
guarantee that the reconstructed signal has
acceptable quality for clinical diagnosis.
Cardiologists are expected to interpret the signal
with different arrhythmias and judge our automatic
analysis results correspond to each arrhythmia. Real
ECG data from the hospital will be collected as well
for analysis.
5 EXPECTED OUTCOME
We expect the following scientific contributions: (1)
a new compression algorithm using wavelet
transforms but with less computational overheads;
(2) a novel hybrid compression and classification
algorithm that can contribute to improve the real-
time diagnosis for low-powered wearable devices;
and (3) explore new features that can be utilized for
classification of specific cardiac diseases.
6 STAGE OF THE RESEARCH
This research is divided into three broad phases.
Some phases are done in parallel and final
integration requires a remarkable care. Some of
these phases are generalisation of the proposed
algorithm and there are several unanswered
questions regarding the final architecture and
performance of the hybrid classification algorithm.
6.1 Phase 1: Pre-Processing and
Compression using WT
This phase involves the preparation of raw ECG
signals by processing them for compression and
classification. The pre-processing will be conducted
using WT and the results obtained will be compared
to the results led by digital filters. The compression
of ECG signal using a modified discrete wavelet
transform (DWT), bit-field preserving (BFP) and
running-length encoding (RLE) method was
conducted and it showed superior results compared
to other well-known methods. The parameters of the
method may be tuned later on in the integration
phase. More investigation on the compression
scheme using WT will be conducted.
6.2 Phase 2: Classification and Feature
Extraction
In classification, the most important step is obtaining
the best features. So far, different features were
extracted from the DWT decomposed signal. Those
features were studied by plotting them correspond to
different arrhythmias. Initially, some distinguished
results can be visually spotted. However, a
sophisticated classifier has to be utilized for
automatic ECG classification. The proper classifier
that is going to fulfil the limitation and desired
requirements is still under investigation.
6.3 Phase 3: Integration
This task is significantly contributing in the novelty
of this work. The main goal is to integrate the
compression and classification algorithms with less
number of steps to reduce the computational load
and complexity. Initial prospective is to apply
BIOSTEC2015-DoctoralConsortium
22

compression on the decomposed coefficients and
then after decompressing those coefficients, features
are extracted from them and used for classification.
REFERENCES
Abo-Zahhad, M. M., Abdel-Hamid, T. K., Mohamed, A.
M., 2014. Compression of ECG signals based on
DWT and exploiting the correlation between ECG
signal samples. Int'l J. of Comm., Network and System
Sciences, 7: 53-70.
Addison, P. S., 2002. The illustrated wavelet transform
handbook: introductory theory and applications in
science, engineering, medicine and finance. CRC.
Ahmed, S.M., Al-Zoubi, Q., Abo-Zahhad, M., 2007. A
hybrid ECG compression algorithm based on singular
value decomposition and discrete wavelet transform.
Journal of Medical Engineering and Technology,
31(1): 54-61.
Alvarado, A.S., Lakshminarayan, C., Principe, J.C., 2012.
Time-based compression and classification of heart-
beats. IEEE Transactions on Biomedical Engineering,
59(6): 1641-1648.
Automated ECG Interpretation, In Wikipedia. Retrieved:
November 4, 2014, from: http://en.wikipedia.org/wiki/
File:SinusRhythmLabels.svg.
Bortolan, G., Willems, J.L., 1993. Diagnostic ECG
classification based on neural networks, Journal of
Electrocardiology, 26: 75-79.
Bulusu, S.C., 2011. Detection of ECG transient ST-
segment episodes and machine learning based heart
beat classification, M.sc Thesis, The University of
Texas at Dallas, May 2010.
Cetin, A.E., Köymen, H., 2000. Compression of Digital
Biomedical Signals. The Biomedical Engineering
Handbook: Second Edition, Ed. J. D. Bronzino, Boca
Raton. CRC Press LLC.
Chan, H.L., Siao, Y.C., Chen, S.W., Yu, S.F., 2008.
Wavelet-based ECG compression by bit-field
preserving and running length encoding. Computer
methods and programs in biomedicine, 90(1): 1-8.
Duda, R.O., Hart, P.E., Stork, D.G., 2001. Pattern
Classification, 2
nd
Edition, John Wiley & Sons, Inc.
Hu, Y.H., Palreddy, S., Tompkins, W.J., 1997. A patient-
adaptable ECG beat classifier using a mixture of
experts approach, IEEE Transactions on Biomedical
Engineering, 44(9): 891-900.
Kamousi, B., 2011. Detection and Classification of
Cardiac Arrhythmias. PhD Thesis, University of
Minnesota, Minneapolis, MN, USA.
Khorrami, H., Moavenian, M., 2010. A comparative study
of DWT, CWT and DCT transformations in ECG
arrhythmias classification. Expert systems with
Applications, 37(8): 5751-5757.
Köhler, B., Hennig, C., Orglmeister, R., 2002. The
principles of QRS detection, IEEE Engineering in
Medicine and Biology, 21(1): 42-57.
Koski, A., Juhola, M., Meriste, M., 1995. Syntactic
recognition of ECG signals by attributed finite
automata, Pattern Recognition, 28(12): 1927-1940.
Manikandan, M.S., Dandapat, S., 2014. Wavelet-based
electrocardiogram signal compression methods and
their performances: A prospective review. Biomedical
Signal Processing and Control, Elsevier, 14: 73-107.
Marcovecchio, A.F., 2001. U.S. Patent No. 6,223,078.
Washington, DC: U.S. Patent and Trademark Office.
Massachusetts Institute of Technology. MIT-BIH ECG
database. Available: http://ecg.mit.edu/.
Miaou, S.G., Chen, S.T., Lin, C.L. 2002. An integration
design of compression and encryption for biomedical
signals. Journal of Medical and Biological
Engineering, 22(4): 183-192.
Pan, J., Tompkins, W.J., 1985, A real-time QRS detection
algorithm, Biomedical Engineering (BME), IEEE
Transactions, 32(3): 230-236.
Peng, C.C., 2011. A Memory-optimized architecture for
ECG signal processing, PhD Thesis, University of
Florida, Florida, United States.
Portet, F., Hernandez, A.I., Carrault, G., 2005. Evaluation
of real-time QRS detection algorithms in variable
contexts, Med. Biol. Eng. Comput., 43(3): 379-385.
Quickselect. In Wikipedia. Retrieved: November 4, 2014,
from: http://en.wikipedia.org/wiki/Quickselect.
Quotb, A., Bornat, Y., Renaud, S., 2011. Wavelet
transform for real-time detection of action potentials in
neural signals. Frontiers in Neuroengineering,
4(Article 7): 1-10.
Rangayyan, R.M., 2006. Biomedical signal analysis: a
case-study approach, Wiley-Interscience, 1
st
edition.
Reid, S., 2010. Model combination in multiclass
classification, PhD Thesis, University of Colorado at
Boulder, Colorado, United States.
Sayadi, O., Shamsollahi, M.B., 2008. ECG denoising and
compression using a modified extended Kalman filter
structure. IEEE Transactions on Biomedical
Engineering, 55(9): 2240-2248.
Senhadji, L., Carrault, G., Bellanger, J.J., Passariello, G.,
1995. Comparing wavelet transforms for recognizing
cardiac patterns, Engineering in Medicine and Biology
Magazine, IEEE, 14(2): 167-173.
Silipo, R., Marchesi, C., 1998. Artificial neural networks
for automatic ECG analysis, IEEE T Transactions on
Signal Processing, 46(5).
Tompkins, W.J., 1995. Biomedical Digital Signal
Processing, Prentice-Hall, Upper Saddle River, NJ.
Trahanias, P., Skordalakis, E., 1990. Syntactic pattern
recognition of the ECG, IEEE Transactions on Pattern
Analysis and Machine Intelligence, 12(7): 648,657.
Tsipouras, M.G., Fotiadis, D.I., Sideris, D., 2005. An
arrhythmia classification system based on the RR-
interval signal, Artificial Intelligence in Medicine,
33(3): 237-250.
Tumer, M.B., Belfore, L.A., Ropella, K.M., 2003. A
syntactic methodology for automatic diagnosis by
analysis of continuous time measurements using
hierarchical signal representations, IEEE Transactions
on Systems, Man, and Cybernetics, Part B:
Cybernetics, ,33(6):951-965.
CardiacArrhythmiasClassificationandCompressionusingaHybridTechnique
23

Übeyli, E.D., 2008. Support vector machines for detection
of electrocardiographic changes in partial epileptic
patients, Engineering Applications of Artificial
Intelligence, 21(8): 1196-1203.
World Health Organization (WHO), 2008. The 10 leading
causes of death by broad income group of 2008, Fact
sheet No310. Last Updated: June 2011. Geneva: WHO
available at:
http://www.who.int/mediacentre/factsheets/fs310/en/index
.html.
Zhou, H., Hou, K., Zuo, D., 2009. Real-time automatic
ECG diagnosis method dedicated to pervasive cardiac
care, Wireless Sensor Network, 1(4): 276-283.
BIOSTEC2015-DoctoralConsortium
24
