
The Air Distribution Network Design Problem
A Complex Non-linear Combinatorial Optimization Problem
Sandy Jorens
1
, Annelies De Corte
2
, Kenneth S
¨
orensen
2
and Gunther Steenackers
3
1
Faculty of Applied Engineering, University of Antwerp, EMIB, Hoboken, Belgium
2
Faculty of Applied Economics, University of Antwerp,ANT/OR Operations Research Group, Antwerp, Belgium
3
Faculty of Applied Engineering, University of Antwerp, Op3Mech, Hoboken, Belgium
Abstract: The objective of the air distribution network
design optimization problem is to find the material
and dimensions of each duct and fan in an air dis-
tribution network so that the total cost is minimized
without violating aerolic constraints. Since the 1960s
much research has been dedicated to the simulation
and optimization of air distribution networks and nu-
merous methods have been developed to solve this op-
timization problem. This paper aims to outline the
current state-of-the-art in air distribution network de-
sign optimization and highlights the main shortcom-
ings. Additionally, previous research is extended by
presenting a model that integrates the network layout
decisions into the optimization problem. In this prob-
lem, called the air distribution network design opti-
mization problem the location of the fans and ducts
in the network are determined so that the total cost of
the network is minimized. This novel combinatorial
optimization problem is characterized by discrete de-
cision variables, and non-linear constraints. This pa-
per also motivates the need for benchmark instances
to evaluate the performance of existing or new de-
veloped optimization methods and advance future re-
search in the field op air distribution network design
optimization. A software tool is developed in this PhD
research to generate such instances.
1 RESEARCH PROBLEM
1.1 Air Distribution Network Design
(ADND)
One of the most energy-consuming and cost expen-
sive (up to 35% in Belgium) parts of a heating, ven-
tilation and air conditioning (HVAC) system is the
air distribution system. Both the energy and mate-
rial costs can be reduced significantly if air distribu-
tion systems or networks are designed properly. The
quality of their design largely determines the effec-
tiveness, energy-efficiency and comfort of the build-
ing’s HVAC system.
Air distribution systems in non-residential build-
ings can be seen as large tree-networks of supply air
ducts that convey conditioned air from one or more
resource nodes, e.g. air handling units (AHU) or fans,
out through the building to multiple demand nodes
(terminal units). Usually, the air is returned back to
the AHU to be conditioned again or exhausted from
the building by the extraction and exhaust air duct-
work respectively. It is the design engineer’s respon-
sibility to design the air distribution system in such
a way that each demand point is provided with the
required airflow at adequate pressure. The energy
needed to distribute the air and overcome all the pres-
sure losses of the various components in the network
(e.g. fittings, silencers, dampers) is delivered by one
or more fans.
The design process of air distribution systems can
be subdivided in different phases. First, the duct-
work’s layout needs to be determined, i.e., the route
that the branched ductwork follows starting from the
resource node to the demand nodes (terminal units) in
the building. Second, all duct types (i.e., size and ma-
terial) and fan(s) are selected. Last, dampers for the
different branches in the system are calculated to bal-
ance the system and ensure that every demand point
receives the correct airflow.
1.2 State of the Art
Since the 1960s, much research has been dedicated to
the simulation and optimization of air distribution net-
works (ADN) (Bouwman, 1982),(Kim, 2001),(Tsal
and Behls, 1986),(Tsal et al., 1988),(Wang, 1986).
Numerous design methods have been developed to
support the design engineer in the second phase of
the design process, namely the duct sizing and fan se-
lection, starting from a given ductwork layout. Gen-
erally, current duct design methods can be subdivided
in two main categories.
10
Jorens S., De Corte A., Sörensen K. and Steenackers G..
The Air Distribution Network Design Problem - A Complex Non-linear Combinatorial Optimization Problem.
Copyright
c
2015 SCITEPRESS (Science and Technology Publications, Lda.)
The first category consists of non-optimizing
methods that rely on simple heuristics which do
not explicitly take into account prevailing local eco-
nomic conditions. Instead of optimizing an objec-
tive function, these methods only use assumptions for
variables such as the air flow velocity and friction
losses, which are based on rules of thumbs and the
designer’s experiences (Asiedu, 2000),(Mitchel and
Braun, 2012). The obtained designs are workable, but
not necessarily optimal.
The Equal Friction and Static Regain method are
the two most commonly used methods in this category
(ISSO, 1994),(Mitchel and Braun, 2012). In the first
method, the frictional pressure drop per unit length of
the duct (Pa/m), i.e. the friction rate, is maintained
constant throughout the duct system, where the fric-
tional pressure drop is associated with the duct wall
friction. This method is straightforward but involves
judgement in the selection of the friction rate, since
there is a wide range of possible values for the fric-
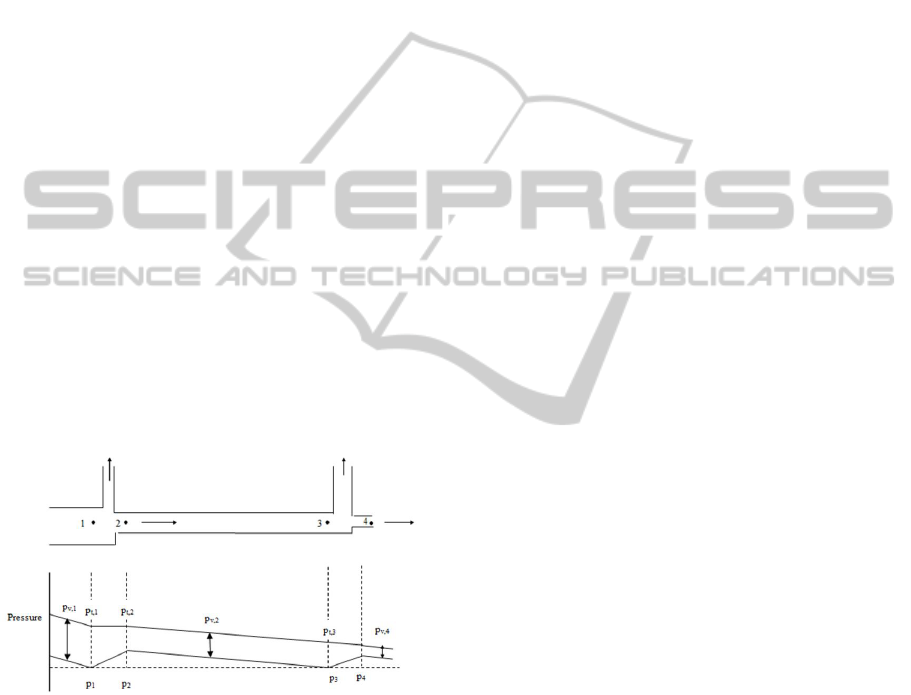
tion rate. The objective of the static regain method
is to obtain the same static pressure at diverging flow
junctions and before each terminal unit by changing
downstream duct sizes (Figure 1). This method of
duct sizing is based on Bernoulli’s equation, which
states that a reduction of velocities results in a con-
version of dynamic pressure into static pressure. The
velocity for the root section is an arbitrary parameter
and depends on the design engineer’s experience.
Figure 1: Schematic of pressure distribution for static regain
design, where pt = total pressure, p = static pressure and pv
= velocity or dynamic pressure (Mitchel and Braun, 2012).
The second category consists of optimization
methods. Their main goal is to determine duct sizes
according to optimal pressure losses and select a fan
according to the optimal fan pressure that minimizes
life cycle costs (LCC) (Asiedu, 2000),(Taecheol et al.,
2002),(Tsal et al., 1988). The Reduced Gradient
(Arkin and Shitzer, 1979), Quadratic Search and the
Modified Lagrange Multipliers methods (Tsal and
Adler, 1987) are some of the many computer-aided
numerical optimization methods used for network op-
timization. These methods are all continuous meth-
ods and thus, they are not adequate to deal with dis-
crete parameters such as nominal duct sizes. In 1968
Tsal and Chechic developed a method based on Bell-
man’s dynamic programming method (1957). Unfor-
tunately, when exact methods such as dynamic pro-
gramming are used for large combinatorial optimiza-
tion problems (i.e. NP hard problems) like ADN,
combinatorial explosions occur, resulting in exces-
sively long computation times (S
¨
orensen and Glover,
2013).
The most widely known optimization method is
the T-method (Tsal et al., 1988), which is also based
on dynamic programming (Tsal and Behls, 1986).
The method’s objective is to find duct sizes and se-
lect a fan so that the system’s life-cycle cost is min-
imized. The calculation procedure of the T-method
consists of three main steps. First the entire duct sys-
tem is condensed into a single duct section for find-
ing the ratios of optimal pressure losses using sec-
tional aerolic characteristics (= system condensing).
After calculating the optimal system pressure loss in
the second step, a fan is selected. Last, the sys-
tem pressure is distributed throughout the system sec-
tions (= system expansion). Although this method
is recommended by ASHRAE (American Society of
Heating, Refrigeration and Air Conditioning Engi-
neers) (ASHRAE, 2009), it is hardly used in prac-
tice. Yaw Asiedu (Asiedu, 2000) and Huan-Ruei
Shiu (Shiu et al., 2003) list the main shortcomings of
the T-method for large complex ADN. Yaw Asiedu,
for example, states that metaheuristic techniques such
as evolutionary metaheuristics are needed to tackle
large complex network designs and proposes a Seg-
regated Genetic Algorithm (Asiedu, 2000). Contrary
to exact optimization algorithms, metaheuristics do
not guarantee the absolute optimality of the obtained
solutions. However, they provide solutions that are
“good enough” in an “acceptable” computing time.
Other (meta)heuristics that were used to deal partly
or completely with the duct optimization problems
are for example Simulated Annealing (Wang, 1986)
and the Nelder and Mead downhill simplex method
(Kim, 2001). Although recent papers have been
published (Fong et al., 2010),(Kashyap, 2013),(Vi-
tooraporn and Kritmaitree, 2003), these mainly re-
iterate the same ideas of previous research (Asiedu,
2000),(ISSO, 1994),(Tsal et al., 1988), i.e. they focus
only on the duct sizing and fan selection and, more
important, the objective function of the ADN opti-
mization problem is largely the same as the objective
functions defined in previous research.
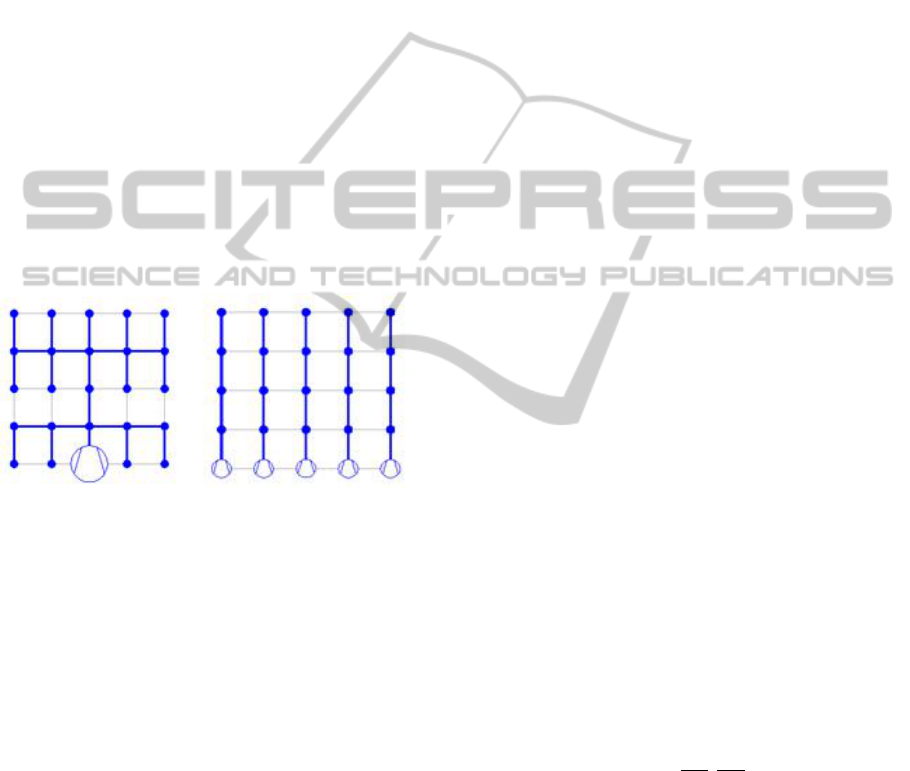
Previously developed methods are often tested
solely on two or three test networks, including the
ASHRAE benchmark network (Figure 2). This net-
TheAirDistributionNetworkDesignProblem-AComplexNon-linearCombinatorialOptimizationProblem
11

work, however, does not reflect a realistic ADN in
non-residential buildings. On the supply side, the
ASHRAE network contains only one fan (resource
node) which provides six terminal units (demand
nodes) of air. Realistic networks in hospitals or large
office buildings can have hundreds of terminal units
and multiple fans.
Figure 2: ASHRAE duct system example (ASHRAE,
2009).
1.3 Problem Statements
In general, three main shortcomings can be identified
that characterize previous research on air distribution
network optimization:
First, existing optimization methods only focus
on the second phase of the design process, i.e., they
only determine the size of each duct and/or fan in
the network and consider the network layout to be
given. The layout itself is determined using rules of
thumbs, which result in designs that are workable, but
not necessarily optimal. Clearly, the layout of the net-
work and the duct sizes are interrelated decisions that
jointly influence the quality of the air distribution sys-
tem.
Second, due to lack of benchmark instances, cur-
rent optimization methods have not been adequately
tested, and thus no strong conclusions can be drawn
on their performance in realistic circumstances nor
can their performances be compared to other exist-
ing methods. As a result, air distribution systems
are generally largely designed manually, and rely for
their performance on the knowledge and experience
of the engineer in charge of the design (Mitchel and
Braun, 2012). Clearly, the field of air distribution de-
sign would benefit greatly from models and methods
that allow more advanced automation.
Last, no modern metaheuristic techniques have
been used to solve the air distribution network design
(ADND) optimization problem. Since the last innova-
tive research conducted in the field of ADN optimiza-
tion, many new metaheuristic techniques have been
developed to handle the optimization of large combi-
natorial problems.
2 OUTLINE OF OBJECTIVES
The overarching aim of this PhD project is to tackle
aforementioned shortcomings in five steps. The first
two steps have already been performed and their out-
come is described in this document.
1. Formulating the air distribution network design
problem (ADND) as a single-objective, non-linear
combinatorial optimization problem, in which
both the layout decisions and the duct and fan
type decisions are taken simultaneously (see Sec-
tion 3.1);
2. Developing a software tool that generates a large
database of realistic artificial ADN that can be
used for testing purposes. These instances can be
used to compare the performance of existing and
future optimizations methods and evaluate their
robustness (see Section 3.2);
3. Developing a simulation model that can simulate
large air distribution networks of arbitrary com-
plexity. The simulation method will be used dur-
ing the optimization phase to calculate the objec-
tive functions and constraints of a given network
configuration. Moreover, the model will be ad-
dressed during the validation phase of the opti-
mization algorithm to determine the added value
compared to the traditional methods;
4. Developing an efficient metaheuristic that is able
to calculate the optimal air distribution network
configuration. The simulation model will be re-
sponsible for the major part of the computation
time, making it essential that the metaheuristic has
to be able to generate candidate solutions intelli-
gently, i.e. generate only high-quality solutions.
Moreover, the metaheuristic needs to be flexible
so that it can be extended to realistic networks;
5. Representing the ADND optimization problem as
a multi-objective optimization problem with the
minimization of the life cycle cost, energy con-
sumption and initial material cost as conflicting
objective functions (see Section 4.2).
ICORES2015-DoctoralConsortium
12
3 METHODOLOGY
3.1 Formulation of the Air Distribution
Network Design Optimization
Problem
In this research an ADN is represented as a graph
G(N,E) with E being the set of edges that represent
(potential) ducts and N the set of nodes representing
junctions, points of demand (terminal units), and (po-
tential) points of supply (fans). The possible locations
of the fan(s), as well as the possible fan types, and
all possible types of ducts between any pair of nodes
are assumed to be known and given as input to the
optimization algorithm. The required airflow at each
terminal unit and thus the total airflow for the entire
ADN is also assumed to be predetermined. The out-
put of the optimization algorithm will be either a min-
imum cost spanning tree with one large fan or multi-
ple subtrees where each subtree has its own fan (Fig-
ure 3).
Figure 3: ADN with 1 fan (a) and 5 ADN with 5 fans (b).
Although real-life ADN should be evaluated on
multiple criteria (installation cost, life-cycle cost,
noise levels, . . . ), minimization of the installation
cost is generally seen as the most important objective.
We therefore define the ADND problem as a single-
objective optimization problem. The objective func-
tion is defined as the sum of the duct costs and the fan
costs:
minimize cost =
∑
d∈D
∑
t∈T
x
td
C
td
L
d
+
∑
f ∈F
∑
s∈S
x
s f
C
s f
(1)
In the equation x
td
is a discrete decision variable
that determines whether duct d of type t is selected
(x
td
= 1) or not (x
td
= 0). The same applies to the
fan selection, i.e. when a fan of type s is selected, x
s f
equals 1 and when a fan of type s is not selected, x
s f
equals 0. The first term of equation 1 represents the
cost of the ductwork, which depends on both the total
length L
d
of each duct d, the type t selected for duct
d, and the cost per unit of length for a duct of type
t. Each duct type has a different nominal duct size
(chosen from a list of commercially available types
T ) and specific material characteristics, resulting in a
certain unit cost per meter C
td
. The second term of
the formula represents the material cost of the fans,
where C
s f
is the cost of a fan of type s. The type of a
fan is amongst others determined by its size, fan per-
formance or characteristic curves and its application
field (centrifugal or axial fan).
Significant for the design of air distribution sys-
tems is the large number of constraints to which it is
subjected. Generally these can be divided in two main
categories: physical and external constraints. The
physical constraints such as mass and pressure bal-
ancing are determined by the physical laws that act
upon the ADN and are decisive for the proper func-
tioning of the system. The external constraints are
imposed by the fact that the ADN needs to be built in
an environment that does not allow infinite degrees of
freedom.
The mass balance or mass conservation law states
that the mass of air (expressed in kg) flowing into a
node in the network per unit of time (in s) equals the
mass of air flowing out of this node and must be sat-
isfied for each node n ∈ N:
∑
˙m
in
=
∑
˙m
out
(2)
The total airflow rate in the entire air distribution
system, i.e. the airflow that is delivered every second
by the fans in the system, equals the sum of the de-
sired airflow rates at each terminal unit. These airflow
rates are assumed to be given.
The pressure balancing constraint requires that the
pressure losses are the same for all duct paths in the
network. If this constraint is not fulfilled, balancing
dampers must be installed to balance the air flow in
the system. Since every balancing damper induces ex-
tra pressure losses and thus an extra cost, the designer
should aim to meet this constraint. The pressure drop
(expressed in Pa) due to friction for a constant-area
duct is given by the Darcy-Weisbach equation:
∆p = f
L
D
H
ρv
2
2
(3)
where f is the friction factor (dimensionless), L
the duct length (m), D
H
the hydraulic diameter (m), ρ
the density (kg/m
3
) and v the average velocity (m/s).
The last grouping of terms is also called the veloc-
ity or dynamic pressure. Parameter D
H
is determined
by the type of duct and is assumed to be given for
each available type. The density ρ of the medium is
given and considered to be constant for the whole air
distribution system. Parameter v depends on the duct
type that is selected and the pressure loss in that duct.
TheAirDistributionNetworkDesignProblem-AComplexNon-linearCombinatorialOptimizationProblem
13

Lastly, the friction factor f depends on both the se-
lected duct type and the velocity v.
The second category of constraints, i.e. external
constraints can be further subdivided in mandatory
(hard) and non-mandatory (soft) constraints, where
the latter stands for the preferences from the designer
or building owner that do not predominantly con-
tribute to the proper functioning of the system (e.g.,
a preference for smaller ducts or a specific duct lay-
out from an aesthetic point of view). Mandatory con-
straints, however, ensure that the obtained design is
feasible (limited set of commercially available duct
sizes, limited space, . . . ):
L
i
≤ D
i
≤ U
i
(4)
where:
• D
i
= diameter of duct section i, where i = 1, 2,. . . ,
n and D
i
∈ T ,
• n = the number of duct sections in the air distribu-
tion system (unitless),
• L
i
and U
i
= the lower and upper bounds of duct
section i, due to velocity or geometric constraints,
• D
i
, L
i
and U
i
are expressed in meter.
The evaluation of the physical and external con-
straints requires the simultaneous solution of a set of
non-linear equations. These equations depend on the
values chosen for the decision variables in the way
mentioned before. Solving these equations can be
done using software such as Dymola, i.e. an equation
based software with domain specific knowledge.
The ADND optimization problem is therefore a
complex combinatorial optimization problem. The
evaluation of the constraints requires the simultane-
ous solution of a set of non-linear equations. It can
be posited that such a problem is outside the realm of
exact methods and can be best approached by meta-
heuristic techniques. S
¨
orensen and Glover define
metaheuristics as “high-level, problem-independent
algorithmic frameworks that provide a set of guide-
lines or strategies to develop heuristic optimization al-
gorithms” (S
¨
orensen and Glover, 2013). Metaheuris-
tics are also particularly well-suited in a simulation-
optimization environment where either the objective
function or the constraints (such as in this case) re-
quire a run from a simulation module to be evaluated.
The development of such a simulation module or a
metaheuristic for the ADND optimization problem,
however, is outside the scope of this paper.
3.2 Generation of Artificial Air
Distribution Networks (Benchmark
Instances)
Currently a database of benchmark instances is lack-
ing and thus the performance of existing and new
ADN optimization methods cannot be evaluated and
compared properly. The software tool developed in
this paper attempts to address this shortcoming by
generating realistic artificial ADN, based on insight
into real-life building plans and typical ADN design
procedures. By means of adjustable parameters, in-
stances of arbitrary size and characteristics are gener-
ated. To this end, supply ADN in multi-storey office
buildings and universities or school buildings can be
simulated. Although these types of buildings differ in
their demand pattern, they generally share a similar
layout. Each building can be subdivided in different
zones, depending on their heating, cooling and venti-
lation needs, where each zone contains several rooms,
which are interconnected through hallways. The sup-
ply ductwork runs typically from the centralized AHU
or fan(s), located in a technical room or on the roof,
vertically through the shafts to the several floors of the
building. From there the air ducts run horizontally
above the false ceiling of the corridors to the differ-
ent zones and rooms that need to be ventilated and/or
conditioned. The dimensions of the shafts (height and
width) and the false ceiling (height) influence both the
sizing and the layout of the ductwork significantly.
The network generator developed in this paper and
written in C++ is based on this layout principle.
Basically the generation of the benchmark in-
stances is carried out in two main phases. First, input
is required from the user about the characteristics of
the building, including the building type, number and
dimensions of the shafts and the number and size of
the different zones that need to be ventilated and/or
conditioned. Second, the ADN are generated algo-
rithmically whereby sequentially the nodes and edges
are generated in the graph. The edges represent the
air ducts in the network.
The second step is described in detail in the fol-
lowing subsections and shown graphically. Figures 4
to ?? illustrate step by step the generation of ADN
for a multi-storey office building with four shafts and
consisting of eight zones.
3.2.1 Generation of the Nodes in the Graph
Per fan, a rectangular grid is created, whereby only
a percentage of the grid points will be allocated as
hallway nodes, i.e. junctions. Both the size of the
grid and the percentage are adjustable parameters.
ICORES2015-DoctoralConsortium
14
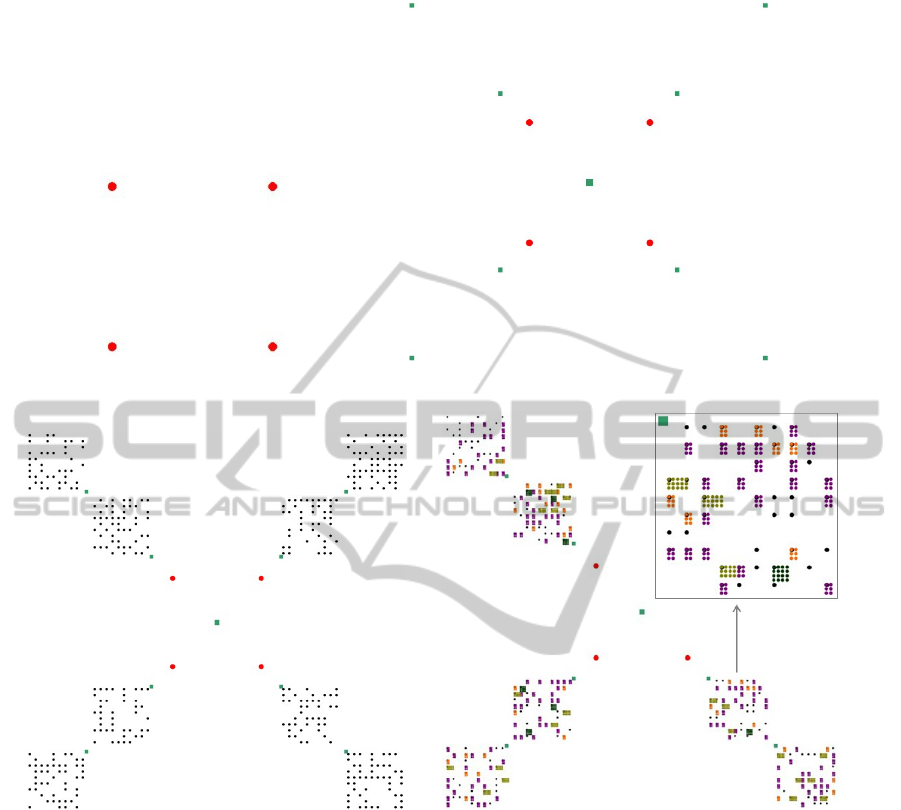
Figure 4: generation of shafts (left) and supply nodes (right).
Figure 5: generation of hallway nodes (left) and room nodes (right).
Generation of Shafts. Nodes of the type ‘shaft’ are
characterized by a set of coordinates (x, y) and a
demand that equals zero m
3
/h. Additionally, maxi-
mum dimensions (height and width) are assigned to
these types of nodes, which will determine the maxi-
mum permitted diameter of the incoming and outgo-
ing ducts.
As can be seen in figure 4, the shafts are gener-
ated on the perimeter of a rectangle with the origin
(0,0) as centre. Up to eight shafts can be generated
per building.
Generation of All Potential Supply Nodes. In a
second step, the (potential) fan locations are gener-
ated, including a discrete set of potential fan types that
can be installed at the corresponding locations. Each
fan type is represented by its performance curves. The
first supply node, i.e. the primary fan, is generated in
the origin (0,0) of the graph. Additionally, for ev-
ery zone in the building, secondary supply nodes are
generated, where each fan and thus zone is associ-
ated with a shaft. Besides the number of zones, the
distances between the zones and the shafts can be ad-
justed as well by the user.
Generation of Zones. As mentioned in section 3.2,
a zone contains multiple rooms which are intercon-
nected through hallways.
• Hallway Nodes (Junctions). Per fan, a rectangu-
lar grid is created, whereby only a percentage of
the grid points will be allocated as hallway nodes,
i.e. junctions. Both the size of the grid and the
percentage are adjustable parameters.
TheAirDistributionNetworkDesignProblem-AComplexNon-linearCombinatorialOptimizationProblem
15
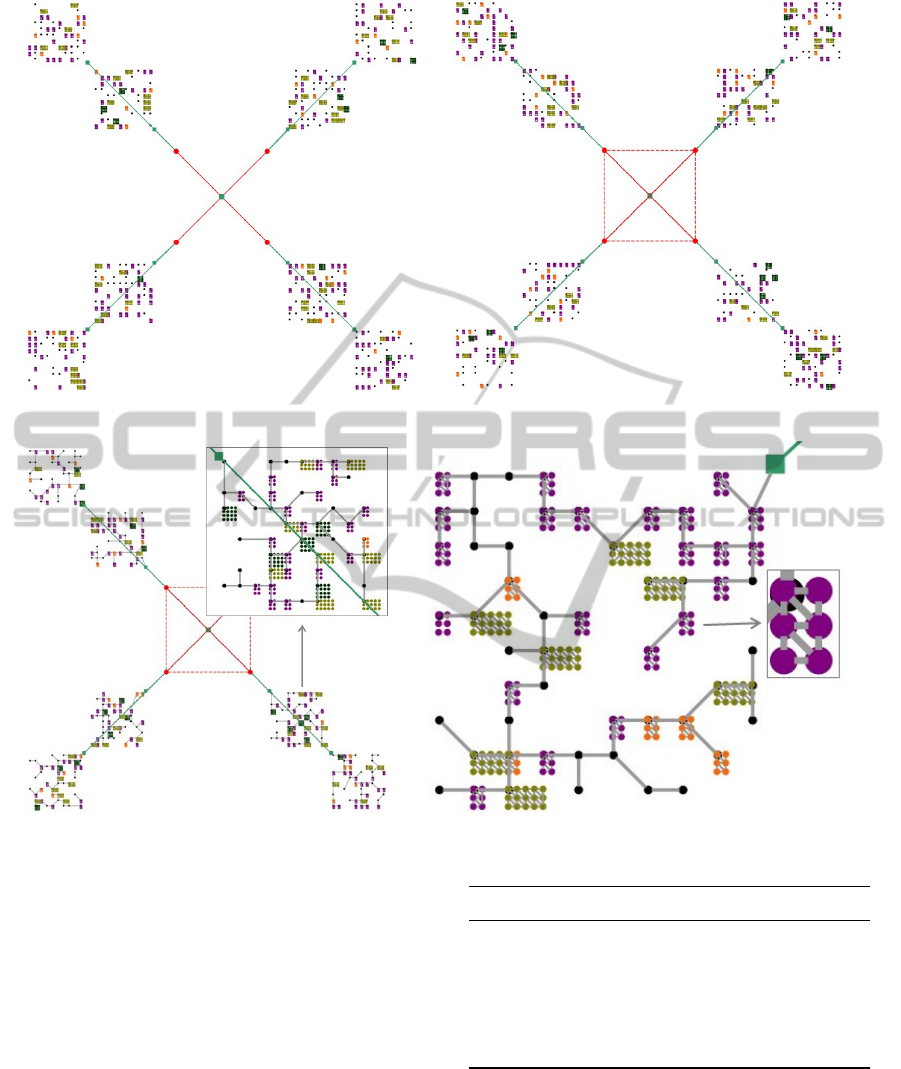
Figure 6: Generation of main ducts.
Figure 7: Generation of hallway ducts (left) and room ducts (right).
• Room Nodes. All spaces in non-residential build-
ings can be classified into different types. De-
pending on the function of the building, some
types of rooms may be more or less present. The
ratio between the room types is given in table 1,
where only the spaces with an airflow demand are
taken into account. The percentages given in ta-
ble 1 are assumed average values based on multi-
ple real-life building plans. However, since these
percentages can vary considerably from building
to building, they are represented as adjustable pa-
rameters in the software tool.
Every hallway node generated in the previous
step, has a γ% chance to get assigned a room type,
where γ is an adjustable parameter. Which room
type that is assigned depends on the percentages
given in table 1. For instance, in the case of an
Table 1: Occurrence of different room types in a building.
Room types Office building Universities
Small office 65% 20%
Open office 15% /
Meeting room 15% 20%
Restaurant 5% 10%
Class room / 30%
Auditorium / 20%
office building, a small office has a 65% chance
of being generated, an open office and reception
each 15% and a cafeteria or restaurant 5%.
The characteristics of the various room types are
given in table 2. The airflow rates and floor ar-
eas in are calculated based on the occupancy rate
per room type, using to the European standard EN
ICORES2015-DoctoralConsortium
16

Table 2: Characteristics of the different room types.
Room type Max. occupancy Floor area # nodes Airflow rate/node Total airflow rate
(no. of people) (m
2
) (-) (m
3
/h/node) (m
3
/h)
Small office 10 150 6 50 300
Open office 20 300 15 40 600
Meeting room 16 56 6 80 480
Restaurant 165 250 16 300 4800
Class room 40 160 15 80 1200
Auditorium 200 800 29 200 5800
Table 3: Classification of indoor air quality or IAQ (typical
range of outdoor air for a non-smoking area).
Category Description Rate of outdoor air
(m
3
/h/person)
IDA 1 High IAQ > 54
IDA 2 Medium IAQ 36 - 54
IDA 3 Moderate IAQ 22 - 36
IDA 4 Low IAQ < 22
13779, which applies to the design and implemen-
tation of ventilation and room conditioning sys-
tems for non-residential buildings subject to hu-
man occupancy. It focuses on the definitions of
the various parameters that are relevant for such
systems. The air rates used in this paper are those
that are associated with an acceptable air quality
IDA 3 in a non-smoking area (table 3).
3.2.2 Generation of the Edges in the Graph
In a second phase, the software tool generates all po-
tential edges or ducts in the graph. Similar to the
nodes, the ducts are characterized by a set of param-
eters such as a roughness coefficient, a start and end
node, a length (i.e. the Euclidian distance between the
start and end node) and a maximum (hydraulic) diam-
eter. The last parameter implies that all smaller duct
sizes can be installed as well at this location. Since
supply ADN are subjected to a telescopic constraint,
i.e. the diameter of an upstream duct must not been
less than the diameter of a downstream duct, the size
of the set of potential ducts will reduce when going
downstream in the system.
Generation of Main Ducts. First, ducts are created
which connect the shafts with the centralized supply
node and the corresponding secondary supply nodes.
Moreover the shafts and secondary fans are connected
mutually as well. As mentioned in before, the max-
imum diameter of these ducts is determined by the
dimensions of the shafts in the building.
Generation of Ducts in the Zones:
• Hallway Ducts
For every set of hallway nodes generated, a mini-
mum spanning tree, connecting all hallway nodes
associated with one fan, is drawn, using Prim’s
algorithm. The begin-nodes and end-nodes of the
edges or ducts are assigned to these edges while
drawing the spanning tree. The edge weights or
duct lengths equal the Euclidean distances be-
tween the begin-nodes and end-nodes.
• Room Ducts
All demand nodes within a room are connected
by triangulation. The begin-node, end-node and
length of each duct are defined by the triangula-
tion itself. The maximum diameter of the ducts,
however, depends on the room type as every room
type has a different demand (table 2). The char-
acteristics of the artificial ADN that are generated
by the software tool and described in the previ-
ous subsections are available in both Graph ML
and text file format, which can serve as input file
for optimizations methods developed in future re-
search.
4 STAGE OF THE RESEARCH
4.1 Conclusions and Accomplishments
Since the 1960s, much research has been dedicated to
the simulation and optimization of ADN. Numerous
design methods have been developed to support the
design engineer in the second phase of the design pro-
cess, namely the duct sizing and fan selection, start-
ing from a given ductwork layout. This paper pro-
vides a thorough critical review of previously devel-
oped methods for duct size optimization and proposes
some recommendations for future research in the field
of ADN optimization.
Moreover, two of the four objectives outlined in
section 2, have already been accomplished. First, the
TheAirDistributionNetworkDesignProblem-AComplexNon-linearCombinatorialOptimizationProblem
17

air distribution network design (ADND) problem is
represented as a non-linear combinatorial optimiza-
tion problem, which can best be solved with meta-
heuristic optimization techniques. Previous research
is extended by integrating the network layout into
the formulation of the optimization problem. Ad-
ditionally, the need for realistic artificial benchmark
instances is motivated and a software tool to gen-
erate these kinds of instances is proposed. To this
end, instances for multiple-floor office building and
school or university buildings can be generated. In the
very near future, the software tool will be extended to
generate instances for other non-residential buildings
such as sport complexes and industrial buildings. The
tool will become freely available to foster research in
the field ADND optimization and will be useful for
testing purposes.
4.2 Pointers for Future Research
As mentioned in section 2 ‘Outline of Objectives’,
the next step in this research is developing a simu-
lation model in Dymola that can simulate large ADN
of arbitrary complexity. It will be used during the op-
timization phase to calculate the simplified objective
function and the constraints of a given network con-
figuration as formulated in section 3.1. Subsequently
an efficient metaheuristic algorithm will be developed
for this simplified ADND optimization problem.
Since the design of air distribution systems de-
pends strongly on the requirements of the end user,
the long term aim of this research is to represent the
ADND optimization problem as a multi-objective op-
timization problem with the minimization of the life
cycle cost, energy consumption and initial material
cost as conflicting objective functions. Conflicting in
the sense that, for example, a larger cross-section of
the ductwork induces higher material costs, but lower
energy consumption. A Pareto-set of non-dominated
solutions will be generated by the optimization algo-
rithm and it is up to the decision taker to make a trade-
off between the different solutions.
5 EXPECTED OUTCOME
The final outcome of this research is an efficient op-
timization method that supports the decision-making
of the contractor, engineering office or architect dur-
ing the design phase of large, complex air distribution
networks in non-residential buildings.
ACKNOWLEDGEMENTS
This research was partially supported by the Interuni-
versity Attraction Poles (IAP) Programme initiated by
the Belgian Science Policy Office (COMEX project).
REFERENCES
Arkin, H. and Shitzer, A. (1979). Computer aided optimal
life-cycle design of rectangular air supply duct sys-
tems. ASHRAE Transactions, 85.
ASHRAE (2009). ASHRAE Handbook - Fundamen-
tals, chapter 21: Duct design, pages 21.1–21.67.
American Society of Heating, Refrigeration and Air-
Conditioning Engineers.
Asiedu, Y. (2000). Life-cycle cost analysis and probabilis-
tic cost estimating in engineering design using an air
duct design case study. PhD thesis, University of
Saskatchewan.
Bouwman, H. B. (1982). Optimum air duct system design.
PhD thesis, Technische Hogeschool Delft.
Fong, K. F., Yuen, S. Y., Chow, C. K., and W., L. S. (2010).
Energy management and design of centralized air-
conditioning systems through the non-revisiting strat-
egy for heuristic optimization methods. Applied En-
ergy, 87:3494–3506.
ISSO (1994). Luchtkanalen drukverlies-, thermische en
akoestische berekeningen. ISSO.
Kashyap, M. (2013). Carbon fiber composites for duct de-
sign based on vav network in hvacs system. Interna-
tional Journal of Emerging Trends in Engineering and
Development, 2:67–73.
Kim, T. (2001). Optimum duct design for variable air vol-
ume systems. PhD thesis, Oklahoma State University.
Mitchel, J. W. and Braun, J. (2012). Heating, ventilation
and air conditioning in buildings. Wiley.
Shiu, H., Ou, F., and Chen, S. (2003). Optimization de-
sign of exhaust duct system in semiconductor factory
using dynamic programming method. Building and
Environment, 38:533–542.
S
¨
orensen, K. and Glover, F. (2013). Metaheuristics. In
Gass, S. and Fu, M., editors, Encyclopedia of OR/MS,
3rd edition, New York. Springer.
Taecheol, K., Spitler, J. D., and Delahoussaye, R. D. (2002).
Optimum duct design for variable air volume systems
- part 1: problem domain analysis of vav duct sys-
tems and part 2: optimization of vav duct systems.
ASHRAE Tran, 108:96–127.
Tsal, R. J. and Adler, M. S. (1987). Evaluation of numer-
ical methods for ductwork and pipeline optimization.
ASHRAE Transactions, 93.
Tsal, R. J. and Behls, H. F. (1986). Evaluation of duct de-
sign methods. ASHRAE transactions, 92.
Tsal, R. J., Behls, H. F., and Mangel, R. (1988). T-
method duct design - part 1: optimization theory and
part 2: calculation procedure and economic analysis.
ASHRAE transactions, 94:90–151.
ICORES2015-DoctoralConsortium
18

Vitooraporn, C. and Kritmaitree, P. (2003). Modified t-
method duct design for use in thailand. ASHRAE Jour-
nal, pages 10–24.
Wang, F. (1986). Computer aided optimal design of duct
system using simulated annealing. Master’s thesis,
Oklahoma State University.
TheAirDistributionNetworkDesignProblem-AComplexNon-linearCombinatorialOptimizationProblem
19
