
Tunable Transmission Power to Improve 2D RSSI Based Localization
Algorithm
D. Polese, L. Pazzini, A. Minotti, L. Maiolo and A. Pecora
IMM-CNR, Via del Fosso del Cavaliere 100, 00133 Roma, Italy
Keywords: Indoor Localizazion Algorithm, RSSI, Wireless Sensor Network.
Abstract: Radio frequency wireless technology is surely one of the most used technologies in indoor localization. RF-
signals have been utilized in several ways to estimate the distances among the anchor nodes and the mobile
nodes and, probably the methods based on the measure of the Received Signal Strength (RSS) are the most
explored ones. RSS depends on the transmission medium and environment and this affects also the distance
measurement performances. To mitigate the external influences, transmission parameters, as for example
the transmission channel and transmission power, can be tuned. To this purpose, in this work the influence
of the power transmission on the localization algorithm performance is investigated. In particular a method
to select the power transmission that allows the best localization performance is presented. The results show
that the localization performance depend on the transmission power. Moreover, a method to establish the
best power transmission for the specific environment is presented and tested.
1 INTRODUCTION
Nowadays, localization of objects or humans in
indoor environment is gaining growing interest. It is
used in a huge number of applications, from the
indoor navigation to the logistic, up to the
environmental monitoring (Fu et al., 2009,
Mainwaring et al. 2002, Vicentini et al. 2014, García-
Hernández et al. 2007). These kinds of applications
are generally based on radio frequency (RF) wireless
technologies, even if examples of applications based
on infrared and ultrasound technologies have been
also developed (Randell and Muller, 2001). The RF
technologies have the main advantages of a wider
range of use compared to other technologies, and
moreover, a direct line of sight between anchors
nodes and mobile node is not required.
Although many algorithms for the evaluation of
the mobile nodes position have been introduced, they
can be roughly classified in angulation and lateration
algorithms. The former uses the angle of arrival of
the signals measured from the anchor respect to the
same reference (typically the magnetic North) while
the latter uses the distances from the anchor nodes.
Due to simpler hardware that is required to evaluate
the distance, the lateration algorithms are largely the
most utilized. Whichever positioning algorithm is
implemented, several methods can be used to
estimate the anchor to mobile node distances: Time
of Arrival (TOA), Time Difference of Arrival
(TDOA) and Received Signal Strength (RSS).
Among them, mainly due to its simplicity of
implementation, the measurement of the RSS has
been extensively investigated.
The principal advantage of the measurements of
the RSS to estimate the distances between two
antennas is due to the integration of this
measurement in the more recent RF transceivers.
Indeed, the measurement of RSS is defined and
sometimes mandatory required and standardized by
the last communication protocols (IEEE 802.11-
2012, IEEE 802.15.4f-2012). Moreover, another
reason relies in the simple relation that connects
Received Signal Strength Indicator (RSSI) and
distance:
RSSI 10∙η∙log
dA
(1)
where
is the signal propagation constant, d is the
distance between sender and receiver and A is the
RSSI at a distance of one meter. The two parameters
and A depend on the medium and on
environmental factors. Therefore, several error
factors can affect the RSSI estimation as multipath,
presence of barriers between source and receiving
antennas, angle among them, environmental
electromagnetic interferences and interferences of
151
Polese D., Pazzini L., Minotti A., Maiolo L. and Pecora A..
Tunable Transmission Power to Improve 2D RSSI Based Localization Algorithm.
DOI: 10.5220/0005330801510156
In Proceedings of the 4th International Conference on Sensor Networks (SENSORNETS-2015), pages 151-156
ISBN: 978-989-758-086-4
Copyright
c
2015 SCITEPRESS (Science and Technology Publications, Lda.)

other transmitting systems.
In order to limit these problems some
transmission parameters can be modified or some
misbehavior can be compensated (Polese et al., 2014,
Wu et al. 2012). For example the transmission
frequency and power are two easily accessible and
tunable parameters that could improve the
localization performance.
In transmission systems, the choice of the
transmission frequency depends on the analysis of
the quality of the transmission channel. A largely
used parameter to estimate the better transmission
frequencies in presence of noise and/or interference
is the Signal to Interference plus Noise Ratio (SINR)
(Jeske and Ashwin, 2004, Shin et al, 2007). An
estimation of this parameter allows to choose the best
working frequency. On the other hand, the
transmission power is generally chosen considering
only the power consumption or the maximum
transmission distance. However, more often,
transmission power and frequency are not selected
with any regards to the goodness of the distance
measurements.
In this paper, we take into consideration the effect
of the power transmission on the correct distance
estimation. In particular, a method to estimate the
best power transmission will be presented and a
classical lateration algorithm will be used to compare
the localization performances adopting different
transmission powers to show the goodness of the
method.
The remainder of this paper is organized as
follows: in section 2 the method for the estimation of
the best transmission power is presented. In section 3
the localization algorithm is explained. In section 4
the experimental set-up is described. In section 5 the
results are shown and finally, section 6 concludes the
paper.
2 HOW TO ESTIMATE THE
BEST POWER TRANSMISSION
The signal between the transmitting and the receiving
antenna can follow different paths in addition to the
direct line of sight. Thus, the power of the signal
detected by an antenna is a weighted sum of the
power of the signals coming from the different
directions. In indoor application, the two parts, the
power carried by the reflected signals and the direct
signal, can be comparable. This effect, in addition to
the limit of detection of the transceivers can produce
different profiles of power decay inside the close
environment that are highlighted by .
To perform a better estimation, the sensibility
(D'Amico and Di Natale, 2001) of the RSSI on the
distance should be maximized inside the working
area. Practically, a greater sensibility allows to detect
smaller variation of the antennas distance.
The sensibility can be easily calculated using
equation 1:
S
∂RSSI
∂d
10
ln10
∙η∙
1
d
(2)
and it is maximized for the power transmission that
maximizes .
However, even if each anchor independently
performs the RSSI measurements and, in this way,
also the estimation of the distance from the mobile
node, the localization algorithm uses the whole set of
distances to evaluate the position of the mobile node,
so, the performances of the localization algorithm
could be invalidate by the less efficient antenna. To
take into account the behavior of the whole system
and to estimate the best transmission power, a single
parameter that considers the magnitude of the
and
its variability among the different anchors has been
chosen:
N
μη
∙
A
RSSI
σ
η
∙
A
RSSI
(3)
where
∙
represents the mean operation among the
anchors,
and
are the signal propagation
constants of the i
th
anchor, whereas,
∙
represents
the standard deviation operation among the anchors
and finally,
is the minimum RSSI detectable
by the transceiver. The transmission power used by
the mobile node to communicate on the network that
maximizes N should also improve the performance
of the localization algorithm.
3 LOCALIZATION ALGORITHM
To investigate the influence of the transmission
power on the localization performance a classical
localization algorithm based on lateration is used to
compare the localization performances as function
of the mobile node transmission power.
Localization algorithm uses an optimization
procedure to seek the coordinates that minimize the
error between the distance measured using a signal
characteristic, in our case the RSSI (R
i
), and the
Euclidian distances calculated with the estimated
mobile node coordinates (D
i
) (Zanca et al. 2008):
SENSORNETS2015-4thInternationalConferenceonSensorNetworks
152
E
min
wi
D
R
∈
(4)
It is important to note that the coordinates of the
anchor nodes are known. In this case the weight w(i)
are chosen quantized inversely proportional to the
distance experimentally measured through the
equation 1, i.e. each weight is taken in the set
,
,
,
,
as they are ordered by distances R
i
.
In this way, each weight contributes exactly the half
of the previous and the double of the next one in the
Equation 4. The result of this approach is that nearer
anchors contribute more in the position estimation.
4 EXPERIMENTA SET-UP
A standard office room, furnished with classical
furniture as desks, cabinets and work bench is
arranged with a wireless sensor network composed of
5 nodes. Inside the working space several testing
points, at well-known position, have been installed.
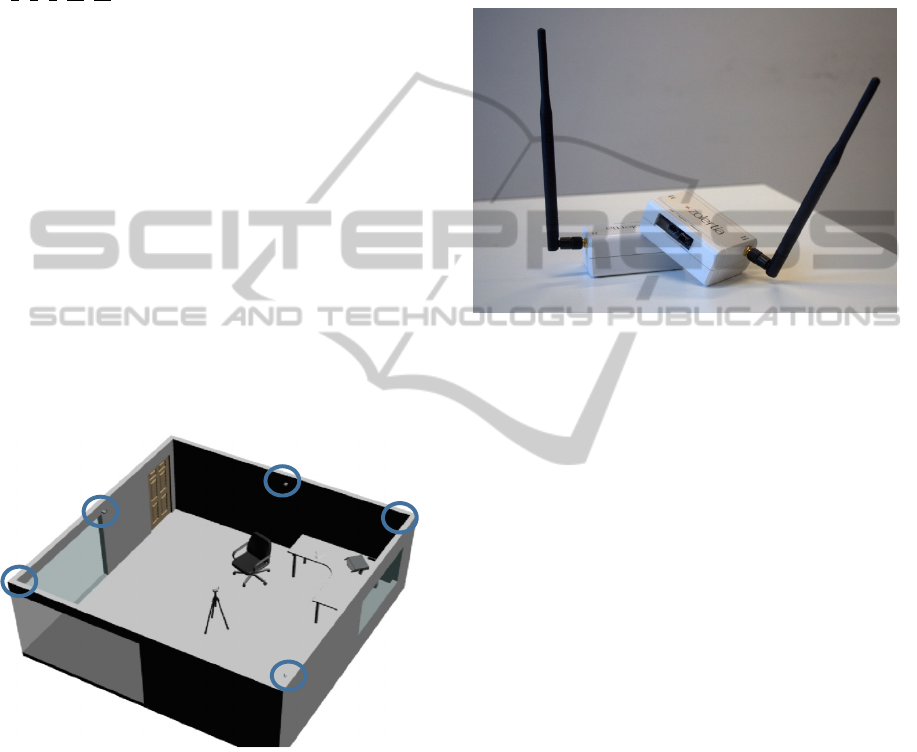
In figure 1 a schematic representation of the room is
shown, it is important to note the mobile node placed
on a tripod and the anchor nodes placed on the room
walls.
Figure 1: Schematic representation of the test room
arrangement. It is possible to note the mobile node on a
tripod and the anchors node attached on the walls
highlighted by the circles.
The network is composed of commercial wireless
sensor nodes Z1 Zolertia (Zolertia, 2013) equipped
with an external pigtail antenna (see figure 2). In this
experiment, only one mote acts as a mobile node,
whereas the others are used as anchor nodes. The
anchor nodes are disposed along the walls.
During the experiment, the mobile mote has been
put in six different testing points and the RSSI values
of the mobile node signal is measured by the
different anchor nodes. The gateway node collects
100 RSSI values for each one of the 8 transmission
power levels available on the CC2420 transceiver.
The RSSI values are measured by the anchor node
according to transceiver specifications. The whole set
of RSSI data is sent to the PC through a USB
connection.
Figure 2: The two wireless sensor nodes equipped with
external pigtail antenna.
5 RESULTS
5.1
Calibration
Equation 1 connects distance and RSSI
measurements using two parameters that have to be
evaluated in the working environment, namely A and
.
The parameter A is easily estimated using its
definition i.e. the received power when the antennas
are placed at 1 meter of distance. Therefore, to
estimate the diverse A parameters the mean values of
100 RSSI packets measured placing the mobile node
at 1 m of distance from each anchor are used.
To estimate
the mobile node is placed at
different known positions and 100 RSSI packets are
measured by the anchor nodes for each position.
Using the equation 1, the value of that best fits the
experimental data is implemented in the following
localization algorithm. The fitting has been
performed in MATLAB environment.
5.2
Test Points
The mobile node is placed in six different positions
inside the working area. For each position and for
each power level the RSSI is measured by the anchor
TunableTransmissionPowertoImprove2DRSSIBasedLocalizationAlgorithm
153
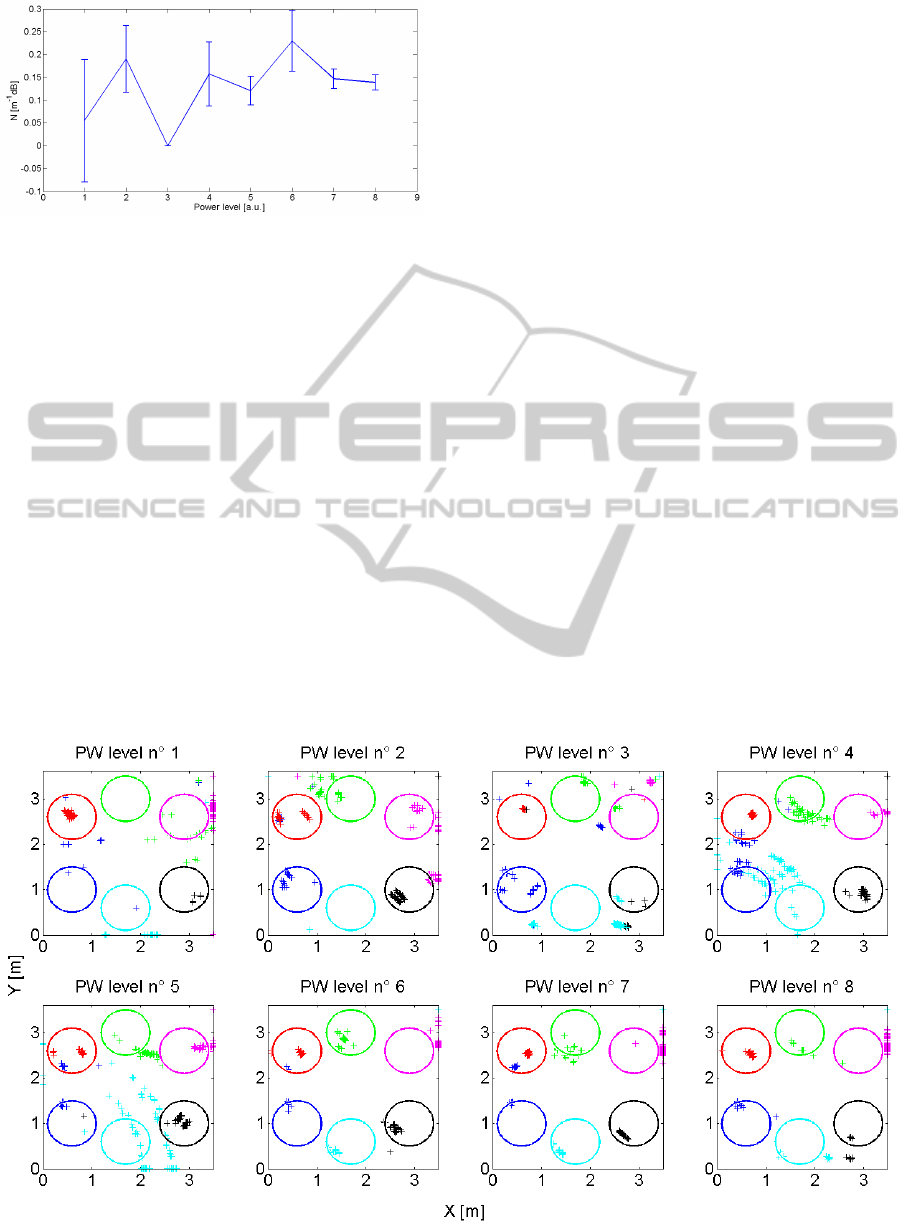
Figure 3: Variation of the parameter N for different power
levels.
nodes and stored. Five of the six data sets are used to
estimate the parameter and the sixth position is
used to validate the result. This kind of approach is
called Leave One Out Cross Validation (LOO-CV)
and it has the main advantage of allowing an
estimation of the prediction error when the dataset is
not very large (Hastie, 2009).
Figure 3 shows the values of the parameter N for
the different eight power levels provided by the
CC2420 transceiver. Since for each power level six
possible calibration subsets can be used, the standard
deviation showed in figure 3 takes into account the
variation of the parameter N along the subsets.
Finally, it is important to note that the maximum of
the parameter N is obtained for the 6th power level.
5.3 Position Estimation
Following a LOO-CV approach, the position of each
testing point is evaluated using the previously
described localization algorithm adopting the
parameters A and
estimated during the calibration
procedure. Figure 4 shows the points classified using
the algorithm when the transmission power is
changed. The circles show an area of 0.5 m around
the correct testing point where the algorithm should
classify the point. It is possible to note that the
performance of positioning changes accordingly with
the chosen transmission power.
To evaluate the different performances of
positioning as function of the transmission power, the
mean error between the estimated position and the
real position is reported. In the figure 5, the mean
error and its standard deviation calculated on the 100
measurements performed for each position, are
shown. It is possible to observe that the positioning
error has different behaviors depending on the test
positions. In particular, position 2 and 5, that are in
opposite corners of the testing area, have a better
positioning performance with an error around 0.5 m
or even less for position 2. However, the figure
shows that for each position there is a power
transmission that minimizes the mean error.
Figure 6 summarizes the results of figure 4
showing the Root Mean Square Error Cross
Validation (RMSECV) for the different transmission
powers. The profile of the RMSECV shows that the
Figure 4: In the figure the point estimated using the different transmission powers are shown.
SENSORNETS2015-4thInternationalConferenceonSensorNetworks
154
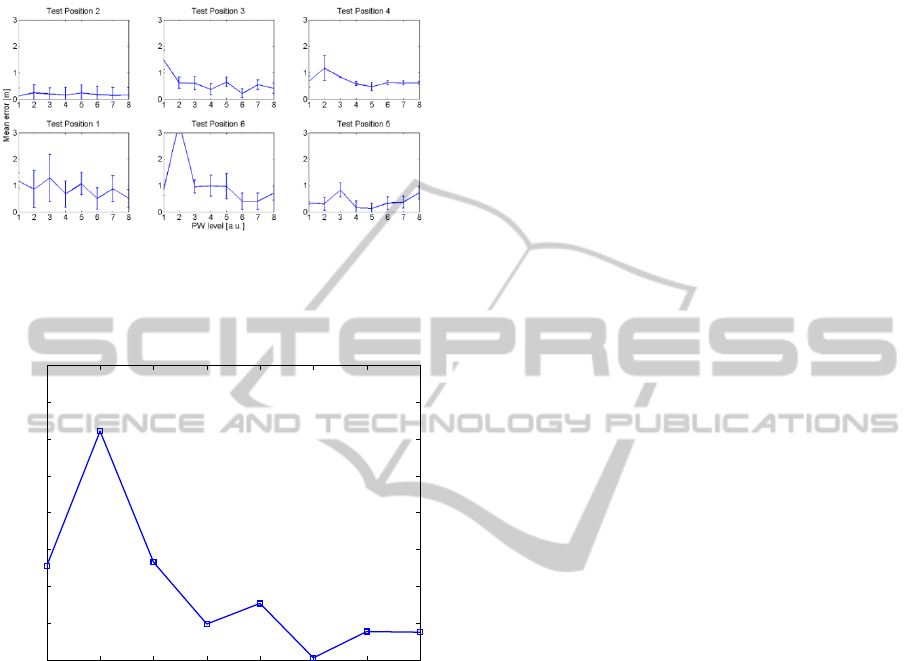
transmission power PW level 6 provides the better
positioning results with a RMSECV error less than
0.5 m.
Figure 5: Mean positioning error and its standard deviation
calculated on 100 measurement performed for each
position are shown as function of the different power
levels.
Figure 6: RMSECV for the different power levels.
Comparing the results of figure 6 with the results
of figure 3 it is possible to note that the parameter N
was maximized by the 6
th
power level, as expected.
6 CONCLUSIONS
In this work the possibility to improve the indoor
localization by selecting the most suitable
transmission power has been investigated. In
particular, a simple calibration method that takes
into account also the best transmission power related
to the specific indoor environment has been
presented. The final results have shown that the
mean error in the localization decreases almost three
times respect to the worst power selection.
ACKNOWLEDGMENTS
This research was partially supported by the Flagship
Project "Factory of the Future" FACTOTHUMS of
the National Research Council.
REFERENCES
Fu, S., Hou, Z. G., & Yang, G. (2009, March). An indoor
navigation system for autonomous mobile robot using
wireless sensor network. In Networking, Sensing and
Control, 2009. ICNSC'09. International Conference on
(pp. 227-232). IEEE.
Mainwaring, A., Culler, D., Polastre, J., Szewczyk, R., &
Anderson, J. (2002, September). Wireless sensor
networks for habitat monitoring. In Proceedings of the
1st ACM international workshop on Wireless sensor
networks and applications (pp. 88-97). ACM.
Vicentini, F., Ruggeri, M., Dariz, L., Pecora, A., Maiolo,
L., Polese, D., Pazzini, L., Molinari Tosatti, L. (2014,
June). Wireless sensor networks and safe protocols for
user tracking in human-robot cooperative workspaces.
In Industrial Electronics (ISIE), 2014 IEEE 23rd
International Symposium on (pp. 1274-1279). IEEE.
García-Hernández, C. F., Ibarguengoytia-Gonzalez, P. H.,
García-Hernández, J., & Pérez-Díaz, J. A. (2007).
Wireless sensor networks and applications: a survey.
IJCSNS International Journal of Computer Science
and Network Security, 7(3), 264-273.
Randell, C., & Muller, H. (2001, January). Low cost
indoor positioning system. In Ubicomp 2001:
Ubiquitous Computing (pp. 42-48). Springer Berlin
Heidelberg.
IEEE 802.11™-2012 PDF format IEEE Standard for
Information technology--Telecommunications and
information exchange between systems Local and
metropolitan area networks--Specific requirements
Part 11: Wireless LAN Medium Access Control
(MAC) and Physical Layer (PHY) Specifications.
IEEE 802.15.4f™-2012 IEEE Standard for Local and
metropolitan area networks-- Part 15.4: Low-Rate
Wireless Personal Area Networks (LR-WPANs)
Amendment 2: Active Radio Frequency Identification
(RFID) System Physical Layer (PHY).
Polese, D., Pazzini, L., Minotti, A., Maiolo, L., Pecora, A.
(2014). Compensation of the Antenna Polarization
Misalignment in the RSSI Estimation. In
SENSORNETS (pp. 263-267).
Wu, K., Xiao, J., Yi, Y., Gao, M., Ni, L. M. (2012,
March). Fila: Fine-grained indoor localization. In
INFOCOM, 2012 Proceedings IEEE (pp. 2210-2218).
IEEE.
Jeske, Daniel R., and Ashwin Sampath. "Signal-to-
interference-plus-noise ratio estimation for wireless
communication systems: Methods and analysis."
Naval Research Logistics (NRL) 51.5 (2004): 720-
740.
1 2 3 4 5 6 7 8
0.4
0.6
0.8
1
1.2
1.4
1.6
1.8
2
PW level [a.u.]
RMSECV [m]
TunableTransmissionPowertoImprove2DRSSIBasedLocalizationAlgorithm
155

Shin, Soo Young, Hong Seong Park, and Wook Hyun
Kwon. "Mutual interference analysis of IEEE 802.15.
4 and IEEE 802.11 b." Computer Networks 51.12
(2007): 3338-3353.
D'Amico, A., & Di Natale, C. (2001). A contribution on
some basic definitions of sensors properties. IEEE
Sensors Journal, 1(3), 183-190.
Zanca, G., Zorzi, F., Zanella, A., & Zorzi, M. (2008,
April). Experimental comparison of RSSI-based
localization algorithms for indoor wireless sensor
networks. In Proceedings of the workshop on Real-
world wireless sensor networks (pp. 1-5). ACM.
Zolertia Z1 http://www.zolertia.com/products/z1 CC2420
(2013) 2.4 GHz IEEE 802.15.4 / ZigBee - ready RF
Transceiver, SWRS041c datasheet,
http://www.ti.com/general/docs/lit/getliterature.tsp?ge
nericPartNumber=cc2420&fileType=pdf.
Hastie, T. Tibshirani, R. Friedman J., (2009) The Elements
of Statistical Learning: Data Mining, Inference, and
Prediction. Second Edition.
SENSORNETS2015-4thInternationalConferenceonSensorNetworks
156
