
Sense2Health
A Quantified Self Application for Monitoring Personal Exposure to Environmental
Pollution
Sara Hachem
1
, Georgios Mathioudakis
2
, Animesh Pathak
2
, Val
´
erie Issarny
1
and Rajiv Bhatia
3
1
Inria@Silicon Valley, Berkeley, U.S.A.
2
Inria Paris-Rocquencourt, Le Chesnay, France
3
The Civic Engine, Berkeley, U.S.A.
Keywords:
Mobile Sensing, Quantified Self, Environment Monitoring, Well-being, Noise Sensing.
Abstract:
Sense2Health is a Quantified Self application that monitors personal exposure to environment pollution and
assesses its heath-related risks. The novelty of the application is that it requires little to no active involvement
by users and unlike existing applications, it correlates the individual’s well-being to their environment as
opposed to their physical activity alone. Consequently, when health and environment data are acquired, our
application enables users to better identify behavior changes towards enhancing their health by enhancing their
environments. Furthermore, Sense2Health is an open platform for integrating existing domain-specific sensing
applications (environmental and health monitoring) focused on decreasing required specialized development
efforts. We present in this paper the design of Sense2Health in addition to a proof-of-concept implementation
for a noise-monitoring use case. Afterwards, we assess its performance while integrating it with a dedicated
open source noise sensing application.
1 INTRODUCTION
In Quantified Self applications, individuals are en-
gaged in monitoring their well-being by tracking spe-
cific physical or biological information, such as heart
rate, daily physical activity, or sleep quality through
their mobile devices (Swan, 2013). There are vari-
ous reasons for the ongoing success of such applica-
tions. Specifically, in this information-oriented era, in
addition to decreasing health risk factors and gener-
ating highly valuable information (Fritz et al., 2014),
tracking one’s data is considered fun and becoming
an accepted social activity. However, work remains
to be done towards personalizing the feedback loop
between the application and users towards behavior
change for better health. Additionally, a common
trend in such applications is the focus on personal
physical factors alone, while lacking efforts in ana-
lyzing/tracking the effects of the surrounding environ-
ment itself on individuals’ well-being with the feed-
back representing environmental risks on health.
In fact, environment pollution is a major issue in
cities, especially since 7 out of 10 people are expected
to be living in urban areas by 2050 within a drastically
increasing number of megacities consisting of a pop-
ulation exceeding 10 million people.
1
As such, the
health of the city has a direct impact on the health
of the citizen, for example through exposures to envi-
ronmental agents such as air pollutants (Burnett et al.,
2014; Brauer et al., 2012).
2
Additionally, monitor-
ing environmental pollution and increasing personal
awareness on the matter —albeit mostly restricted to
air monitoring with no assessment of the exposure
repercussions— has been gaining momentum as il-
lustrated by an increasing number of industrial ef-
forts motivating users to perform the monitoring tasks
(http://www.plumehq.com, http://www.clarify.io).
The best approach to understanding, visualizing
and assessing the aftereffect of direct exposure to
—and conversely fighting against— an environmen-
tally polluted surrounding is by constantly monitor-
ing one’s health (blood pressure, heart rate, etc.). A
few years back, such a requirement would have been
a dreadful, if not an impossible task. However, with
today’s proliferation of biosensors, self monitoring
1
http://www.who.int/gho/urban health/situation trends/
urban population growth text/en
2
http://www.who.int/phe/health topics/outdoorair/
databases/AAP BoD results March2014.pdf
36
Hachem S., Mathioudakis G., Pathak A., Issarny V. and Bhatia R..
Sense2Health - A Quantified Self Application for Monitoring Personal Exposure to Environmental Pollution.
DOI: 10.5220/0005332100360044
In Proceedings of the 4th International Conference on Sensor Networks (SENSORNETS-2015), pages 36-44
ISBN: 978-989-758-086-4
Copyright
c
2015 SCITEPRESS (Science and Technology Publications, Lda.)

is turning into a trivial task that simply requires the
user to own a recent smartphone, smartwatch or smart
bracelet. Yet, little to no effort has been provided to-
wards integrating personal health data with urban data
in order to assess well-being while inducing behavior
change for a healthier environment, healthier commu-
nity, and consequently a healthier life.
To assist users in tracking their well-being with
respect to environmental pollution and understand
its effect on their health, we provide an application
that can leverage, altogether, biosensors and available
domain-specific environment monitoring mobile ap-
plications that track a phenomenon of interest, such
as noise pollution. The latter is a critical health-
jeopardizing source of environmental pollution. Yet,
it has been tackled mostly for city planning purposes
with little effort to enable users to understand the ef-
fects of their own exposure to noise. Evidently, there
are various sources of pollution that, to our day, can-
not yet be measured with mobile sensors alone, such
as chemical pollutants. However, given the fast pace
of technical advancements and increasing number of
sensors integrated in mobile devices, we consider this
to not be an issue.
Our contribution in this paper is threefold:
1. Design Sense2Health as an environmental
pollution-oriented Quantified Self application
that requires little active involvement from end
users.
2. Design Sense2Health to be a resource-efficient
and development-efficient platform, i.e., decrease
required coding efforts. The latter is ensured by
leveraging existing efforts in the area of mobile
sensing for environment and health monitoring
and integrating domain specific sensing applica-
tions with ours.
3. Assessment of the performance of Sense2Health,
through a noise monitoring proof-of-concept im-
plementation and integration with a dedicated
noise sensing application. Our goal is to better un-
derstand the effects of integrating various sensing
applications on the device’s resources and inform
future design and implementation work.
The paper is structured as follows: Section 2 gives
an overview of the literature. In Section 3, we present
the architecture of Sense2Health, followed by the
noise-specific implementation in Section 4. The per-
formance evaluation of Sense2Health is presented in
Section 5. Finally, in Section 6, we give a summary
of our contributions and planned future work.
2 RELATED WORK
Well-being applications are rather popular. They
allow users to track their physical activity and fit-
ness and share it along their social networks. How-
ever, they still suffer from various drawbacks. We
present the drawbacks in this section as we review
several existing well-being applications, followed by
an overview of solutions for noise monitoring, which
is our use case for environment-related well-being
monitoring.
2.1 Mobile Applications for Well-being
Well-being assessment applications are still growing
in popularity, especially with the increasing aware-
ness of the importance of health monitoring and the
easier access to various types of sensors. However,
this trend is still limited by two characteristics: the
sensing is manual and/or relies on external devices
that mainly provide heath-related data (Swan, 2013).
Among such devices, Fitbit (http://
www.fitbit.com) is a bracelet that allows users
to monitor their sleep habits and physical activity.
DirectLife (http://www.directlife.com) is an activity
program with an activity monitoring device that
coaches the user towards creating a personal activity
plan. Authors in (Seong et al., 2014) propose the
use of smartwatches to collect data from external
devices through peer to peer communication to
enable users to track their physical activities. Authors
in (Angelini et al., 2013) present a smart bracelet
for elderly people to act as a personal assistant and
monitory their health status, remind them to take
their medications, etc. Balance (Denning et al.,
2009) is a system that automatically detects the user’s
caloric expenditures via sensor data provided by a
sensing unit on the user’s hip. Users are required to
manually input information on food intake through
the mobile application. AndWellness (Hicks et al.,
2010) is a personal data collection system that
uses mobile phones to collect and analyze data.
However, data is collected through surveys with
context data and sensor data, mainly GPS location
and physical activity inference. The Mobile Coach
is a well-being application presented in (Ahtinen
et al., 2009), which similar to above, also relies on
manual user provided input. It generates training
plans based on user provided personal goals and
performed workouts, which are also input manually.
Google Fit (http://developers.google.com/fit/) is
a platform to integrate various health monitoring
applications that leverage biosensors. Similar efforts
are provided by Apple within the HealthKit tool
Sense2Health-AQuantifiedSelfApplicationforMonitoringPersonalExposuretoEnvironmentalPollution
37

(https://developer.apple.com/healthkit/). Microsoft
Health Vault (http://www.healthvault.com/fr/en)
service combines a cloud-based service with a
device-hosted middleware to provide developers of
fitness applications and devices the ability to upload
all data to a central clearinghouse.
As illustrated by the applications above, in ad-
dition to being manual, the majority of the solu-
tions focus on fitness and physical activity as the ba-
sis of well-being assessment without accounting for
environment-related health nuisances.
2.2 Noise Monitoring
Unlike the above well-being applications which re-
quire, in many cases, active involvement of users,
noise pollution monitoring constitutes an adequate
example for automatic sensing where data is collected
from microphones on users’ devices without neces-
sarily requiring their active involvement in the pro-
cess. However, existing noise sensing applications
are restricted to basic feedback that shows users noise
values in Decibels (Bennett et al., 2010) or noise
maps (Bennett et al., 2010; Rana et al., 2010; Maison-
neuve et al., 2010) with basic graphs that plot noise
values over time. For instance, NoiseSPY (Kanjo,
2010) is a mobile platform for urban noise monitor-
ing and mapping that allows users to measure, an-
notate and localize noise pollution in a city through
crowd sensing. The platform provides them with ac-
cess to maps and a noise plot graph for a certain time
duration or along a trip. NoiseTube (Maisonneuve
et al., 2010) is a participatory noise monitoring so-
lution focusing on real-time exposure to noise expe-
rienced by citizens. Noise is sensed through users’
smartphones and complemented with user generated
contextual data (location, time, and noise source),
along with machine-based automatic classifiers for
e.g., time, location, weather and activity identifica-
tion. The output is a noise map and a log of personal
exposure to noise with a graph that plots the value of
noise throughout the day. While such information is
important, it is not sufficient as users need a qualifi-
cation rather than quantification of the noise pollution
along with better vizualization to be able to form an
informed opinion.
Furthermore, focus in existing solutions
e.g., (Rana et al., 2010; D’Hondt et al., 2013;
Bennett et al., 2010) is mostly on noise measurement
itself, especially in terms of sensor calibration or
measurement/maps accuracy and quality while work
remains to be done in order to properly represent the
results to users so as to increase their awareness of
their surrounding environment pollution, which can
be a major harming factor to their well-being.
3 Sense2Health APPLICATION
DESIGN
As stated earlier, the main purpose of the
Sense2Health application is to enable users to
track, analyze and correlate well-being states with
personal exposure levels to an environmental phe-
nomenon, e.g., noise, and do so with the least active
involvement possible through automatic sensing
(and bio-sensing). Our goal is not to deliver yet
another application that performs the actual sensing.
In more detail, our design rational was to provide
a platform that communicates with and integrates
sensing applications and their measurements, and
also enables users to personalize the application
according to their own habits (to better assess their
well-being) and grants them access to processed and
visual data, while simultaneously ensuring resource
efficiency. All those requirements are satisfied by
the various Sense2Health components depicted in
Figure 1 and presented, in more detail, below. It
should be noted that we distinguish between two
types of data: raw data, which is the measurement
provided by the sensing application and consists
of a numerical value that quantifies the state of the
feature of interest and aggregated data which is a
(set of) raw measurement(s) that underwent some
processing within the Sense2Health application. Data
related to the user’s health is referred to as health data
and data related to the environment is referred to as
environmental data.
The Profile Manager allows users to specify their
preferences and setup their profile. The preferences
include information on whether or not the user de-
sires to enable automatic sensing and enable power
saving options to dynamically modify sensing proper-
ties according to available resources. Creating a pro-
file is essential, as it includes information on users’
daily schedules, such as sleeping hours and working
hours which enables the application to better assess
the impact of the phenomenon on their well-being.
For instance, an average noise exposure of 60 db may
be acceptable during the daytime, however, the same
level can disturb sleep in a portion of the population
at night (Hurtley, 2009).
The Measurement Manager is the component that
assists with the integration of various sensing applica-
tions, as it directly interacts with them to acquire their
measurements based on the sensing settings provided
by the Resource Manager and the user preferences
in the Profile Manager. Sensing applications gener-
SENSORNETS2015-4thInternationalConferenceonSensorNetworks
38

Mobile Phone
Sensing
Application
Sensor
Measurement
Manager
Profile
Manager
Data
Analyzer
Resource
Manager
User
Preferences
Measurements
Storage
Sense2Health
set preferences
inform data analysis
send raw values
send processed values
control measurement process
store preferences
store raw/processed values
1
1
2
2
3
3
4
4
5
5
6
6
7
set sampling frequency
monitor user’s environment
7
8
8
send aggregated values
9
10
9
10
Figure 1: The Sense2Health architecture.
ate environmental data by leveraging ambient sensors
(e.g., NoiseDroid
3
monitors noise using microphones,
Plume monitors air quality using dedicated sensors,
etc. ) and health data by leveraging biosensors (e.g.,
FitBit). The component manages the automatic sens-
ing process and enables users to request manual sens-
ing. It periodically forwards appropriate data from
bio and ambient sensors to the Data Analyzer.
The Data Analyzer handles the processing and ag-
gregation of health and urban data to generate ex-
posure and health risk assessment graphs, personal-
ized based on users’ profiles to dynamically deter-
mine whether or not the phenomenon is considered
to be harmful. The graphs should enable users to vi-
sualize their hourly, daily and monthly exposure to
the phenomenon, and view historical data spanning
previous days and months. The component also pro-
vides statistics on the frequency of potentially harm-
ful noise exposures. This component can be perceived
as the component that closes the feedback loop by
providing the relevant information to the user. It is
worth mentioning that there are various medical stud-
ies and research efforts that we can leverage when as-
sessing and correlating environmental pollution and
health risks (Miedema, 2007).
4
The Resource Manager ensures the efficiency of
the application by tracking power and resource con-
sumption in order to modify the sensing frequency
and sampling duration dynamically. In particular, the
3
https://wiki.52north.org/bin/view/
SensorWeb/OpenNoiseMap
4
http://www.who.int/phe/health topics/outdoorair/
databases/AAP BoD results March2014.pdf
sampling should stop if the battery’s resources are low
while its frequency is increased if the phone is being
charged. There are various solutions that can be ex-
ploited for optimized resource consumption, such as
the approach proposed in (Lane et al., 2013) to pig-
gyback on running applications in order to decrease
sensory data collection overhead or the solution pro-
posed in (Priyantha et al., 2011) to save energy by
exploiting low-power sensing processors.
The Storage component holds all measurements
(raw and aggregated values) and user profile informa-
tion along with their preferences. We do not require
data to be stored on the phone indefinitely. An option
should be available to allow users to specify whether
or not they want the raw data to be stored. However,
to increase the application’s efficiency when display-
ing the graphs, all aggregated data will be stored (so
as to not be obliged to recompute all the displayed
values at every request) until the observation history
is cleared by the user. Additionally, periodic backups
will take place by sending data to a remote store.
4 USE CASE: Sense2Health FOR
NOISE MONITORING
Sense2Health is a prototype mobile application for
the Android platform through which users can mon-
itor their health and their exposure to environmental
factors by leveraging the sensing functionality pro-
vided by their mobile devices. Sense2Health intro-
duces a Sensing API that enables the integration of
several domain-specific sensing applications. In ad-
Sense2Health-AQuantifiedSelfApplicationforMonitoringPersonalExposuretoEnvironmentalPollution
39

dition, it offers an intuitive user interface to facilitate
the visual representation of the data and aggregated
information. The interface was designed based on the
guidelines in (Gong and Tarasewich, 2004). Data are
stored locally on the device by the Storage component
and can be transmitted to a backup server for more
permanent storage. Sense2Health acts as a clearing-
house of data collected by other domain-specific ap-
plications. Its functionality can be accessed through
the Java methods available in a companion .jar file
that other applications can import and use. Internally,
this library is a wrapper that uses standard Android
inter-process communication through AIDL to con-
nect to the Sense2Health application installed on the
phone, which then stores the data.
4.1 The Sensing API
To provide an appropriate platform for hosting al-
ready existing sensing applications, a set of interfaces
and methods, presented below, is introduced to de-
fine the Sensing API. The latter is designed based
on the APIs of available open-source sensing appli-
cations such as NoiseDroid.
• void monitoringSetUp() - Includes tasks re-
quired for running the sensing application.
• void monitoringShutDown() - Includes tasks
required for shutting down the sensing applica-
tion.
• MonitoringValue conceptCapture() - Is used
to perform a single sensing task and returns an ob-
ject representing the state of the phenomenon to
monitor. The sampling duration is parameterized.
• void addValueChangedListener() - Attaches
listeners to track sensing events that may occur.
• void removeValueChangedListener() - Re-
moves the specified listener.
• boolean isCapturing() - Checks if there is an
ongoing sensing task.
The data requests to the sensing tasks are per-
formed by the MeasurementsManager, an orchestra-
tor class, which also transfers the data to the local
storage component and a backup server. Addition-
ally, the class enables Sense2Health to automatically
request sensing tasks, even while running in the back-
ground, by leveraging Android built-in functionali-
ties.
However, resources on mobile devices are
rather limited. Therefore, Sense2Health should be
modest on resource consumption (CPU & Mem-
ory), thus leading to better satisfied users. The
ResourceManager tracks the available resources
and monitors their changes through a set of de-
fined methods such as, getCPUUsage(). After-
wards, taking into account all available informa-
tion, the sensing processes are adjusted accordingly
through adjustAutomaticSensing(), which is trig-
gered asynchronously. Note that if the battery per-
centage is lower than 30% and the device is not charg-
ing, all sensing tasks are suspended.
The Noise Sensing Case. The noise sensing case is
most suitable for evaluating Sense2Health since, on
the one hand, the needed sensor (i.e., microphone) is
available in any mobile device, and on the other hand,
there is a plethora of Android applications that per-
form sound monitoring.
We leverage the NoiseDroid application, which is
an open source project, used for collecting informa-
tion on noise pollution. Its straightforward implemen-
tation and high accuracy on sound capturing made it
the ideal candidate for integration with Sense2Health.
In fact, the components responsible for the sensing
task were integrated seamlessly with Sense2Health
using the interfaces presented above. The noise-
specific monitoring is performed by implementing the
sensing methods as follows.
• monitoringSetUp(): Loads the audio set-
tings (e.g., rate, channel, format of audio to
be recorded) and initializes any functionalities
needed by the recorder.
• monitoringShutDown(): Stops recording and
releases the native AudioRecord resources.
• addValueChangedListener(): Informs listen-
ers of value updates. Consequently, during a
recording, NoiseDroid can report new sound val-
ues, enabling activities to track and display them.
• removeValueChangedListener(): Removes
listeners.
• isCapturing(): Checks if the recorder has an
ongoing sensing task.
Prior to further aggregation and storage, the values
originating from the sensing tasks are structured in-
ternally using a Measurement class. A Measurement
instance holds the specifics of the sensing task, which
include the min/max/average sound level (in Deci-
bels) along with metadata provided by Sense2Health
to describe the context of each measurement (e.g., lo-
cation, date & time, sensing duration, etc.).
4.2 Data Aggregation
The goal of data aggregation is to extract valuable in-
sights by processing environmental and health data
SENSORNETS2015-4thInternationalConferenceonSensorNetworks
40

(a) The Home activity (b) Home during sensing (c) The Graphs activity
Figure 2: GUI of the Sense2Health mobile application.
and closing the feedback loop by returning the in-
formation to the user. Users will have the means to
track their physical state and exposure to urban phe-
nomena (noise) over time and identify situations that
affect their well-being and update their behavior to-
wards a better environment and healthier community
accordingly. In this first implementation, we focus on
environmental data only. We introduce two forms of
aggregated information. The first uses a simple aver-
age mechanism to showcase exposure over short and
long time periods (hour, day, month, etc.) inform-
ing the users of their subjections to an environmen-
tal factor over time. The task is carried out by the
calculateAverages() method, which takes as in-
put the measurement (i.e., noise values), start/end date
and the calculation unit.
The second form of aggregated information, pre-
sented as a counter, Disturbing Situation Counter
(DSC), is used to keep track of those unpleasant mo-
ments where the sensing values reveal significant,
potentially harmful, exposure. For instance, in the
noise sensing example, the DSC identifies such inci-
dents using a set of predefined thresholds (expressed
in Decibels and extracted from medical studies by
WHO on noise disturbance
5
), which are employed
to classify noise levels (quiet, normal, loud, extreme)
and then, disturbance. To generate the results for the
counter, the generateDSC() method is used. The
method takes as input the measurement (i.e., noise
values), the start/end date and the unit (e.g., hour, day,
etc.). All aggregated data are presented through inter-
active graphs (Figure 2(c)).
5
http://whqlibdoc.who.int/hq/1999/a68672.pdf
4.3 Data Management - Local Storage
Sensing applications often produce large
amounts of data that need to be tracked,
thus leading to an information-rich data store.
Sense2Health addresses such need by introducing
a DatastoreManager class that wraps an SQLite
(http://www.sqlite.org/) database and provides meth-
ods to create/update/delete entries on it. The use of
SQLite not only ensures high performance but also
provides means for efficient information retrieval.
To prevent the database from occupying consider-
able storage space on a mobile device, we defined a
policy to filter the data to be stored and the data to
be removed. According to this policy, raw data are
safe to be deleted after one month of their creation
date, while aggregated data produced by the Data
Analyzer are stored locally up to one year. Further-
more, the user can request, at any time, the removal
of all the data, raw and aggregated, produced by the
application. In particular, the DatastoreManager
includes, among others, the following methods:
insertMeasurement() - used to add a new mea-
surement instance, updateMeasurement() - used
to update attributes in a stored measurement and
periodicCleanUp() - executed once a day to re-
move raw data from the database.
4.4 Information Visualisation
To ensure a user-friendly experience when interact-
ing with Sense2Health, we introduce a balanced user
interface defined by involving users and preventive
medicine practitioners in the design process. The in-
terface (Figures 2(a), 2(b)) comprises 3 main parts: (i)
Sense2Health-AQuantifiedSelfApplicationforMonitoringPersonalExposuretoEnvironmentalPollution
41

The Measurements Slider including the most recent
measurements (up to 24-hours old), (ii) The hourly
average graph of the current day and the (iii) Sense
Now button for triggering an immediate sensing task.
Each item contained in the Measurements Slider in-
cludes a respective icon to visualise the sound level
classification and a short hint providing a quick way
for the user to understand the level of exposure with-
out having to interpret the domain-specific metrics
(e.g., Decibels).
The Statistics and Graphs screen (Figure 2(c)) can
be accessed through the Show more button in the
Home screen. As described in Section 4.2, two cat-
egories of graphs are included to showcase the expo-
sure of the user to a phenomenon: The (hourly and
daily) averages levels and the (hourly and daily) Dis-
turbing Noise Counter. The different colors on the
bars of the graphs represent the respective levels of
the monitored feature (i.e., noise).
5 RESOURCE CONSUMPTION
To acquire a better understanding and clearer
guidelines for the design of a platform such as
Sense2Health, which has its own performance (in
terms of phone resources) depending on that of inte-
grated applications, we assess the resource consump-
tion that results from running Sense2Health with in-
tegrated NoiseDroid, in terms of CPU resource con-
sumption and memory usage. We evaluated the appli-
cation performance on Samsung Galaxy S3 Android
phones with 2GB RAM. The results are presented
throughout this section. It is worth noting that there
are two distinct runtime phases in our application: the
idle phase where no sensing/processing is performed,
and the active phase when the actual sampling and
processing take place. The active phase has a duration
of 5 seconds every 10 minutes. We compare our ap-
plication’s resource consumption to that required by
BeWell (Lane et al., 2011), a highly cited resource-
efficient well-being application. The application was
evaluated on a Nexus One smartphone.
5.1 CPU Usage Benchmarks
We monitored CPU usage by Sense2Health, each sec-
ond over a duration of 3 hours. The results are pre-
sented in the graph in Figure 3. The CPU usage varies
along the idle and active phases. The application re-
quires around 2% of CPU resources in the idle phase
while, during sensing and processing, it requires at
most 22%. Consequently, during the active phase, our
application leads to a 20% increase, at most, in CPU
0%#
5%#
10%#
15%#
20%#
25%#
1#
177#
353#
529#
705#
881#
1057#
1233#
1409#
1585#
1761#
1937#
2113#
2289#
2465#
2641#
2817#
2993#
3169#
3345#
3521#
3697#
3873#
4049#
4225#
4401#
4577#
4753#
4929#
5105#
5281#
5457#
5633#
5809#
5985#
6161#
6337#
6513#
6689#
6865#
7041#
7217#
7393#
7569#
7745#
7921#
8097#
8273#
8449#
8625#
8801#
8977#
9153#
9329#
9505#
9681#
9857#
10033#
10209#
10385#
10561#
10737#
CPU$Usage$
Time$in$Seconds$
CPU$Usage$Over$Time$
Figure 3: The percentage of CPU usage by Sense2Health.
usage. As compared to the BeWell application, which
requires up to 31% of CPU resources and an MP3
player requiring up to 16% of the resources (Lane
et al., 2011), we consider ours to have an acceptable
CPU usage.
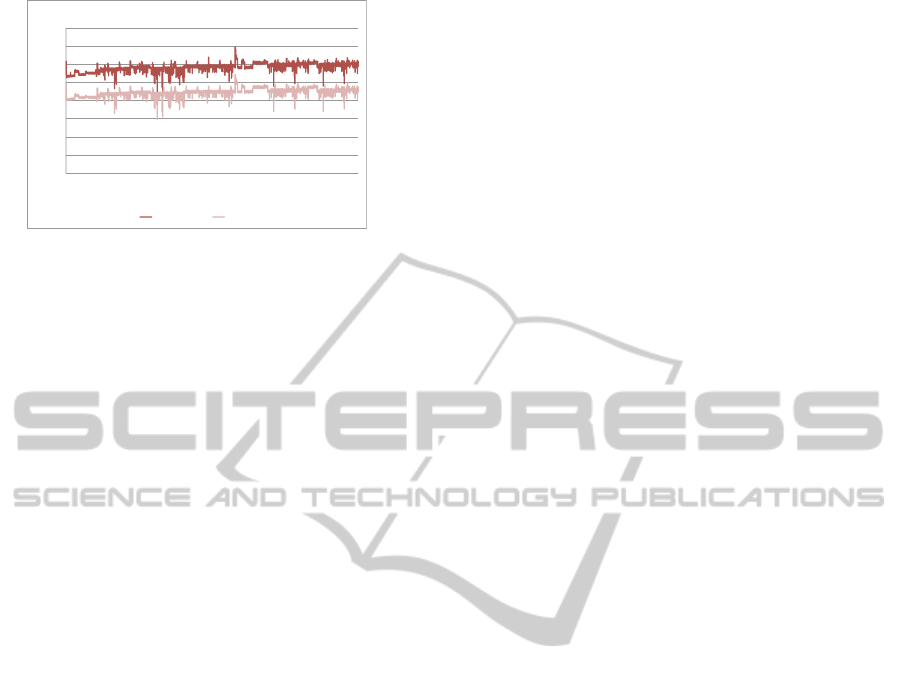
5.2 Memory Usage Benchmarks
We inspected the memory used by the Sense2Health
process (Figure 4) by leveraging the ADB
6
(Android
Debug Bridge) tool, which reports the several types
of memory allocation, namely, Proportional Set Size
(PSS) and Private Dirty (PD).
The PSS is a measurement of the application’s
RAM usage, which accounts for sharing pages across
processes. It is a good measure for the actual RAM
weight of a process and for comparison against that of
other processes. For Sense2Health the PSS is stable
around 11.5MB with small variations due to garbage
collection. The PD is the memory used by the pro-
cess of interest alone (i.e. the Sense2Health process).
This is the bulk of the RAM that the system can re-
claim when the application’s process is destroyed. For
Sense2Health, the PD is stable around 9MB with vari-
ations, again due to garbage collection. As compared
to BeWell, which requires up to 16MB and the MP3
player, which requires up to 26MB, we consider the
application’s memory consumption to be low.
6 CONCLUSION & FUTURE
WORK
We presented in this paper Sense2Health, an applica-
tion that enables individuals to monitor environmen-
tal data and assess its influence on their well-being
in order to modify their behavior for a better, health-
ier environment and community. Sense2Health is de-
6
http://developer.android.com/tools/help/adb.html
SENSORNETS2015-4thInternationalConferenceonSensorNetworks
42
!"
#!!!"
$!!!"
%!!!"
&!!!"
'!!!!"
'#!!!"
'$!!!"
'%!!!"
'"
#('"
)$'"
&''"
'!&'"
'*)'"
'%#'"
'&+'"
#'%'"
#$*'"
#(!'"
#+('"
*#$'"
*)''"
*(&'"
$!)'"
$*#'"
$)+'"
$&%'"
)'*'"
)$!'"
)%('"
)+$'"
%#''"
%$&'"
%()'"
(!#'"
(#+'"
()%'"
(&*'"
&'!'"
&*('"
&%$'"
&+''"
+'&'"
+$)'"
+(#'"
+++'"
'!#%'"
'!)*'"
Memory'(RAM)'in'Kilobytes'
Time'in'Seconds'
Memory'Usage'Over'Time'
,-./.-0.123"456"4785" ,-79265":7-6;"
Figure 4: The Memory usage by Sense2Health.
signed as an open platform to enable seamless integra-
tion of available urban/health monitoring solutions by
leveraging ambient and biosensors. We presented the
conceptual design of the platform and the companion
application, followed by a description of a proof-of-
concept implementation with noise monitoring. We
also evaluated the performance of the application in
terms of resource consumption, to better inform fu-
ture enhancements when integrating various sensing
applications.
As part of our Future Work, we plan on integrat-
ing biosensors to acquire physical data and provide
further information on the correlation between urban
pollution and the disturbance and harm inflicted on
the user’s health. We also plan on investigating other
pollution use cases, such as air quality and identify
potential enhancements to our platform. Additionally,
we intend on extending our backup server into a scal-
able cloud-based store that can handle an ultra large
number of users, store large volumes of data and pro-
tect user’s privacy. To that end, we are investigating
complementary solutions, such as Microsoft Health-
Vault, which enables users to store and share health
information. Last but not least, we intend to integrate
various domain specific sensing applications to iden-
tity and address potential constraints when various ap-
plications are simultaneously running within our plat-
form.
REFERENCES
Ahtinen, A., Mattila, E., Vaatanen, A., Hynninen, L., Salmi-
nen, J., Koskinen, E., and Laine, K. (2009). User
experiences of mobile wellness applications in health
promotion: User study of wellness diary, mobile
coach and selfrelax. In Pervasive Computing Tech-
nologies for Healthcare, 2009. PervasiveHealth 2009.
3rd International Conference on, pages 1–8. IEEE.
Angelini, L., Caon, M., Carrino, S., Bergeron, L., Nyf-
feler, N., Jean-Mairet, M., and Mugellini, E. (2013).
Designing a desirable smart bracelet for older adults.
In Proceedings of the 2013 ACM conference on Per-
vasive and ubiquitous computing adjunct publication,
pages 425–434. ACM.
Bennett, G., King, E. A., Curn, J., Cahill, V., Bustamante,
F., and Rice, H. J. (2010). Environmental noise
mapping using measurements in transit. In Interna-
tional Conference on Noise and Vibration Engineer-
ing, pages 1795–1810.
Brauer, M., Amann, M., Burnett, R. T., Cohen, A., Den-
tener, F., Ezzati, M., Henderson, S. B., Krzyzanowski,
M., Martin, R. V., Van Dingenen, R., et al. (2012). Ex-
posure assessment for estimation of the global burden
of disease attributable to outdoor air pollution. Envi-
ronmental science & technology, 46(2):652–660.
Burnett, R. T., Pope, C. A., Ezzati, M., Olives, C., Lim,
S. S., Mehta, S., Shin, H. H., Singh, G., Hubbell, B.,
Brauer, M., et al. (2014). An integrated risk function
for estimating the global burden of disease attributable
to ambient fine particulate matter exposure.
Denning, T., Andrew, A., Chaudhri, R., Hartung, C., Lester,
J., Borriello, G., and Duncan, G. (2009). Balance:
towards a usable pervasive wellness application with
accurate activity inference. In Proceedings of the 10th
workshop on Mobile Computing Systems and Appli-
cations, page 5. ACM.
D’Hondt, E., Stevens, M., and Jacobs, A. (2013). Partici-
patory noise mapping works! an evaluation of partici-
patory sensing as an alternative to standard techniques
for environmental monitoring. Pervasive and Mobile
Computing, 9(5):681–694.
Fritz, T., Huang, E. M., Murphy, G. C., and Zimmermann,
T. (2014). Persuasive technology in the real world:
a study of long-term use of activity sensing devices
for fitness. In Proceedings of the 32nd annual ACM
conference on Human factors in computing systems,
pages 487–496. ACM.
Gong, J. and Tarasewich, P. (2004). Guidelines for handheld
mobile device interface design. In Proceedings of DSI
2004 Annual Meeting, pages 3751–3756. Citeseer.
Hicks, J., Ramanathan, N., Kim, D., Monibi, M., Selsky, J.,
Hansen, M., and Estrin, D. (2010). Andwellness: an
open mobile system for activity and experience sam-
pling. In Wireless Health 2010, pages 34–43. ACM.
Hurtley, C. (2009). Night noise guidelines for Europe.
WHO Regional Office Europe.
Kanjo, E. (2010). Noisespy: A real-time mobile phone plat-
form for urban noise monitoring and mapping. Mobile
Networks and Applications, 15(4):562–574.
Lane, N. D., Chon, Y., Zhou, L., Zhang, Y., Li, F., Kim,
D., Ding, G., Zhao, F., and Cha, H. (2013). Pig-
gyback crowdsensing (pcs): energy efficient crowd-
sourcing of mobile sensor data by exploiting smart-
phone app opportunities. In Proceedings of the 11th
ACM Conference on Embedded Networked Sensor
Systems, page 7. ACM.
Lane, N. D., Mohammod, M., Lin, M., Yang, X., Lu, H.,
Ali, S., Doryab, A., Berke, E., Choudhury, T., and
Campbell, A. (2011). Bewell: A smartphone applica-
tion to monitor, model and promote wellbeing. In 5th
International ICST Conference on Pervasive Comput-
ing Technologies for Healthcare, pages 23–26.
Sense2Health-AQuantifiedSelfApplicationforMonitoringPersonalExposuretoEnvironmentalPollution
43

Maisonneuve, N., Stevens, M., and Ochab, B. (2010). Par-
ticipatory noise pollution monitoring using mobile
phones. Information Polity, 15(1):51–71.
Miedema, H. M. (2007). Annoyance caused by environ-
mental noise: Elements for evidence-based noise poli-
cies. Journal of social issues, 63(1):41–57.
Priyantha, B., Lymberopoulos, D., and Liu, J. (2011). Lit-
tlerock: Enabling energy-efficient continuous sens-
ing on mobile phones. Pervasive Computing, IEEE,
10(2):12–15.
Rana, R. K., Chou, C. T., Kanhere, S. S., Bulusu, N., and
Hu, W. (2010). Ear-phone: an end-to-end participa-
tory urban noise mapping system. In Proceedings of
the 9th ACM/IEEE International Conference on In-
formation Processing in Sensor Networks, pages 105–
116. ACM.
Seong, K. E., Lee, K. C., and Kang, S. J. (2014). Self M2M
based wearable watch platform for collecting personal
activity in real-time. In Big Data and Smart Comput-
ing (BIGCOMP), 2014 International Conference on,
vol., no, volume 286, pages 15–17.
Swan, M. (2013). The quantified self: Fundamental disrup-
tion in big data science and biological discovery. Big
Data, 1(2):85–99.
SENSORNETS2015-4thInternationalConferenceonSensorNetworks
44
