
Study on Influence of Pumping Spectrum on Stable Uniform
Pumping in a Side-Pumped Nd:YAG Amplifier
Tianzhuo Zhao, Hong Xiao,
Ke Huang, and Zhongwei Fan
Opto-Electronics System Department, Academy of Opto-electronics, Chinese Academy of Sciences,
Haidian, Beijing, 100094, China
Keywords: Laser Amplifier, Absorption Coefficient, Side-Pump, Pumping Spectrum.
Abstract: A new method to realize temperature-stable uniform pumping was presented. Concept of effective
absorption coefficient is introduced at first, which is used to indicate actual absorption coefficient of
Nd:YAG working materials that concerned the influence of laser diode pumping spectrum characters. After
this, flattop and Gaussian as a typical pumping spectrum shaping are discussed, and experimental measured
laser diode spectrum is also used to calculate effective absorption coefficient as a comparison. Next,
experimental results of pump laser diode deviating from absorption peak of neodymium ion are also
numerical analysed, and these results are used to guide pumping central wavelength control. Finally, an
optimized laser diode pumping spectrum shape is put forward. With such a pumping spectrum shape,
effective absorption spectrum can be optimized to flattop shape, and temperature-stable uniform pumping
can be realized.
1 INTRODUCTION
Laser pulses with flattop energy distribution are
known to present significant advantages for laser
machining and various nonlinear optical processes
(Shealy and Chao, 2004). To amplify signal laser
with a flattop energy distribution, a uniform spatial
pumping profile can improve population inversion in
laser amplifiers, reduce thermally induced stress
birefringence, and diminish depolarization loss
(Mashaiekhyasl 2012, Park et al. 2006, Kojima et al.
1999). Flattop pumping energy distribution has been
performed by a variety of means to realize this,
including uniformly arrange laser diodes and
optimize structural parameters (Kotlyar et al. 2008,
Borghi 2013), or using special optical elements such
as waveguide, diffuse-reflective cavity or hollow
duct (Taghizadeh et al. 2000, Baker et al. 2009,
Zhao et al. 2012). However, spectrum is another
important associated factor shall be considered to
realize uniform spatial pumping profile. As we know,
absorption peaks of Nd:YAG are centered at 808.6
nm, and the FWHM (full width at half maximum) of
absorption coefficient is less than 2 nm (Kaufman &
Oppenheim 1974). If central wavelength of the
pump light seriously deviated from absorption peak,
pumping energy distribution would change
obviously, and this would induce serious gain
distribution inconformity on cross-section of the
working material. Hence, it is generally important to
maintain stable spectrum characters of the pump
light to obtain high beam quality, minor distortion
and high transmission accuracy laser. As far as we
know, there is few report about the spectrum
optimization of the pump light to gain stable
uniform pumping in a side-pump amplifier.
Uniform extraction of flattop beams from side-
pumped laser rods in amplifiers suffers from the
trade off of gain distribution stability and pump
efficiency caused by pump spectrum bandwidth. If
pump spectrum bandwidth was too small, deviation
of central pump wavelength would obviously
decrease pumping efficiency, and deteriorate pump
uniformity. On the contrary, if pump bandwidth was
too large, pump efficiency would be too low,
although environmental suitability would be better.
In this paper, concept of effective absorption
spectrum is put forward, which is used to analysis
the amplification system that pumping spectrum of
laser diodes should be carefully considered. Here,
effects of pumping spectrum bandwidth and specific
shape are calculated. Further, relations between
spectrum of the pump light and stability of pump
177
Zhao T., Xiao H., Huang K. and Fan Z..
Study on Influence of Pumping Spectrum on Stable Uniform Pumping in a Side-Pumped Nd:YAG Amplifier.
DOI: 10.5220/0005334501770183
In Proceedings of the 3rd International Conference on Photonics, Optics and Laser Technology (PHOTOPTICS-2015), pages 177-183
ISBN: 978-989-758-093-2
Copyright
c
2015 SCITEPRESS (Science and Technology Publications, Lda.)
energy distribution are discussed. Influences of
central wavelength of the pump light deviate from
absorption peak of Nd:YAG are analysed. By
simulative and experimental results, optimized pump
spectrum shape is put forward, and a proper
temperature-stable uniform pumping method is
presented.
2 ABSORPTION SPECTRUM
AND EFFECTIVE
ABSORPTION SPECTRUM
To realize a precisely absorption spectrum
measurement, a 2.5mm thickness slab is taken from
the same crystal ingots of the Nd:YAG rod that used
in the amplifier. Optical absorption coefficient
measurements were carried out by using an ANDO
AQ-6315A optical spectrum analyzer and an ANDO
AQ-4303B white-light source. Absorption
coefficient
can be expressed as
-2
2
01
01
0
-1ln
1
nn
nn
I
I
L
(1)
Where,
0
I
is the incident light power,
I
is the
transmitted light power,
L
is the thickness of the
slice,
1
n
is the refractive index of the Nd:YAG slice,
0
n
is the refractive index of air. Experimental results
indicate that
1
n
is 1.822, and Fresnel loss on the
refractive surface is 8.49%. In this way, average
absorption spectra from 800nm to 820nm can be
calculated, and the results are shown in Table 1.
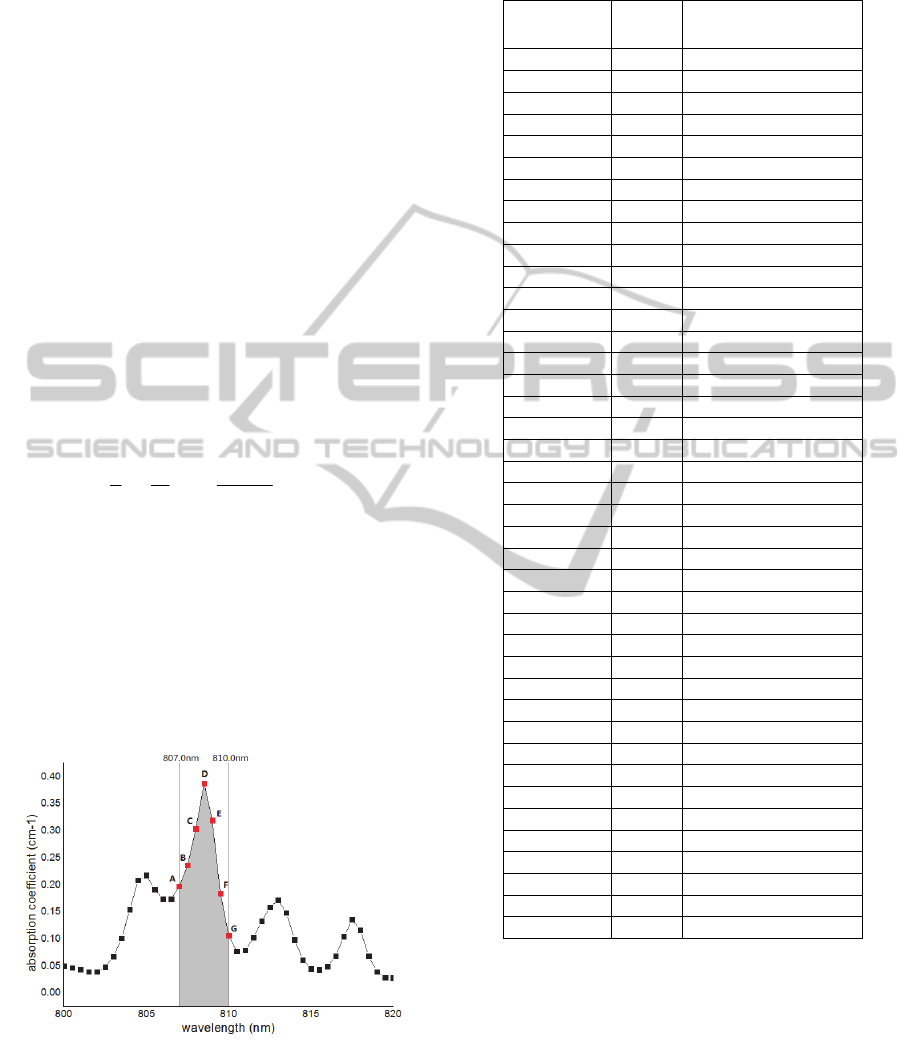
Figure 1: Measuring result about absorption coefficient of
the Nd:YAG rod in experimental.
As we know, atoms rise from the ground state
4
I9/2
to the state
4
F5/2 induces a series of absorption
peaks. 808.6nm are always regarded as the central
Table 1: Measuring result of
0
/
II
and absorption
coefficient of the Nd:YAG rod in experimental.
Wavelength
(nm)
0
/
II
(a.u.)
absorption coefficient
(mm
-1
)
820.0 0.2188 0.0278
819.5 0.2203 0.0286
819.0 0.2408 0.0392
818.5 0.2941 0.0684
818.0 0.3736 0.1161
817.5 0.4035 0.1357
817.0 0.3553 0.1046
816.5 0.2945 0.0685
816.0 0.2592 0.0490
815.5 0.2471 0.0426
815.0 0.2513 0.0448
814.5 0.2811 0.0610
814.0 0.3453 0.0985
813.5 0.4214 0.1479
813.0 0.4551 0.1719
812.5 0.4365 0.1584
812.0 0.3989 0.1326
811.5 0.3515 0.1023
811.0 0.3123 0.0788
810.5 0.3093 0.0770
810.0 0.3575 0.1060
809.5 0.4717 0.1842
809.0 0.6231 0.3194
808.5 0.6821 0.3874
808.0 0.6083 0.3039
807.5 0.5362 0.2364
807.0 0.4889 0.1975
806.5 0.4578 0.1739
806.0 0.4580 0.1740
805.5 0.4813 0.1916
805.0 0.5140 0.2177
804.5 0.5034 0.2090
804.0 0.4308 0.1544
803.5 0.3495 0.1010
803.0 0.2925 0.0674
802.5 0.2576 0.0482
802.0 0.2408 0.0392
801.5 0.2403 0.0390
801.0 0.2483 0.0432
800.5 0.2544 0.0465
800.0 0.2617 0.0504
wavelength for pumping. But spectrum width and
other absorption peaks (such as 804.5nm or 814.0nm)
also have influences on absorption efficiency. High
power laser diode arrays typically have a spectral
full width at half maximum (FWHM) of 3~5 nm,
and this will influence absorption obviously. For
example, when the central wavelength is 808.5nm,
and pumping spectrum width is 3nm, it means that a
region from 807.0nm to 810.0nm will be covered.
As shown in Fig.1, each point in the effective region
PHOTOPTICS2015-InternationalConferenceonPhotonics,OpticsandLaserTechnology
178
has different contribution to absorption. In this
paper, we regard the absorption spectrum which
considering pumping spectrum width of laser diode
as the effective absorption spectrum.
3 CHARACTERS ABOUT
EFFECTIVE ABSORPTION
SPECTRUM
If regarded the spectrum of the pumping light as an
ideal flattop distribution, each point will has the
same contribution to absorption. Effective
absorption coefficient can be calculated from the
geometric averages
n
i
ieff
n
1
1
(2)
Where,
i
is the absorption coefficient on effective
points,
eff
is the effective absorption coefficient,
n
is the number of effective points. If interval between
two sampling point is 0.5nm,
12
dn
,
d
is the
FWHM of pumping spectrum. In Fig.1, absorption
coefficient of point A (807.0nm) is 0.1975/mm, B
(807.5nm) is 0.2364/mm, C (808.0nm) is
0.3039/mm, D (808.5nm) is 0.3874/mm, E
(809.0nm) is 0.3194/mm, F (809.5nm) is
0.1842/mm, and G (810.0nm) is 0.1060/mm.
Therefore, for the case of 3nm spectrum width from
807.0nm to 810.0nm,
eff
is 0.2478/mm.
In most cases, the pumping spectrum is similar to
Gaussian distribution. That means each point will
have a contribution coefficient. If regarded the
pumping spectrum as an ideal Gaussian distribution,
then
2
2
2
exp)(
c
x
xf
(3)
and FWHM
ccd
3548.22ln22
(4)
If interval between two sampling point is 0.5nm, and
contribution coefficient of central wavelength point
is normalized as 1, contribution coefficient of others
points can be calculated. To the situation of
d
is
1nm, 3nm, 6nm, and 10nm, if regards central
wavelength point as the origin, contribution
coefficient on positive axis can be calculated.
Contribution coefficients lower than 0.01 are
ignored.
Effective absorption coefficient can be calculated
as following
i
i
i
eff
c
c
(5)
Where,
i
c
is the contribution coefficient on each
effective point. To the situation of flattop
distribution and Gaussian distribution, effective
absorption spectrums are plotted in Fig.2 and Fig.3.
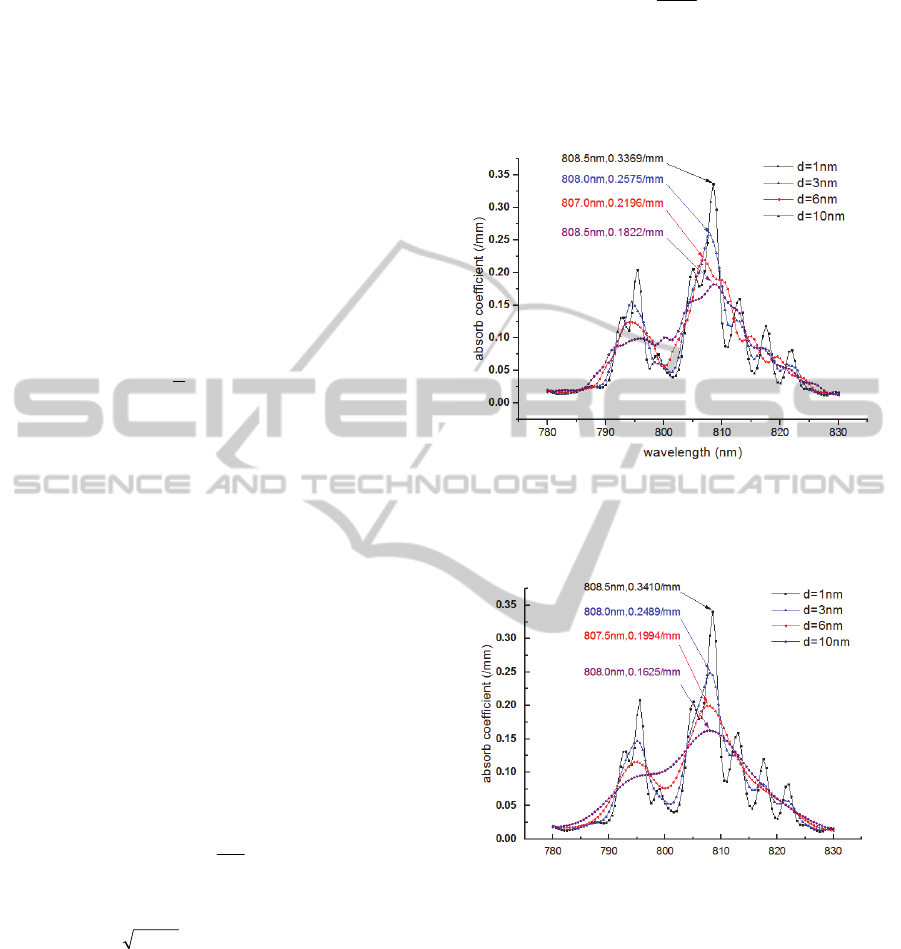
Figure 2: Effective absorption coefficient of flattop
distribution pumping spectrum with FWHM=1, 3, 6,
10nm.
Figure 3: Effective absorption coefficient of Gaussian
distribution pumping spectrum with FWHM=1, 3, 6,
10nm.
These two figures show that: If
d
is smaller,
effective absorption spectrum is more similar to
Nd:YAG absorption spectrum. In most cases, if
d
is
smaller than 1nm, effective absorption spectrum can
be regarded similar as absorption spectrum, but peak
point of effective absorption coefficient drops
obviously. Such as to the situation of Gaussian-
distribution pumping spectrum, effective absorption
coefficient on 808.5nm is 0.3410/mm (
d
=1nm), but
peak point of actual absorption coefficient
0.3874/mm, there is a 12% decrease.
StudyonInfluenceofPumpingSpectrumonStableUniformPumpinginaSide-PumpedNd:YAGAmplifier
179
If
d
is over 3nm, effective absorption spectrum
will be obviously reshaped. Peak point of the
effective absorption spectrum is deviated from the
absorb spectrum center. In Fig.2, to the situation of
d
=1nm, 3nm, 6nm, 10nm, peak point of the
effective absorption spectrum is 808.5nm
(0.3369/mm), 808.0nm (0.2575/mm), 807.0nm
(0.2196/mm), 808.5nm (0.1822/mm). In Fig.3, peak
point of the effective absorption spectrum is
808.5nm (0.3410/mm), 808.0nm (0.2489/mm),
807.5nm (0.1994/mm), 808.0nm (0.1625/mm). That
means wider pumping spectrum will induce lower
peak point of effective absorption coefficient, and
this is obvious in the situation of narrow pumping
spectrum. If regards peak effective absorption
coefficient of FWHM=1nm as 100%(808.5nm,
0.3410/mm), it would be 83.0% (FWHM=2nm,
808.5nm, 0.2831/mm), 73.0%(FWHM=3nm,
808.0nm, 0.2489/mm), 66.8%(FWHM=4nm,
808.0nm, 0.2277/mm), 62.3%(FWHM=5nm,
807.5nm, 0.2124/mm), (FWHM=6nm, 807.5nm,
0.1994/mm), 52.3%(FWHM=8nm, 808.5nm,
0.1785/mm), 47.7%(FWHM=10nm, 808.5nm,
0.1625/mm).
When
d
is enlarged from 1 to 10nm, effective
uniform region of effective absorption coefficient is
enlarged. To the situation of flattop distribution, and
d
=1nm, 3nm, 6nm, 10nm, width of 80% peak point
of effective absorption coefficient is 1.0nm
(808.0~809.0nm), 3.0nm (806.5~809.5nm), 6.0nm
(805.5~810.5nm), 8.0nm (804.0~812.0nm),
respectively. To the situation of Gaussian
distribution, width of 80% peak point of effective
absorption coefficient is 1.0nm (808.0~809.0nm),
3.5nm (806.0~809.5nm), 5.5nm (805.0~810.5nm),
9nm (803.5~812.5nm), respectively. Making a
contrast between Fig.2 and Fig.3, 80% peak point
width of Gaussian and flattop distribution is similar.
While, if regard 90% peak point of effective
absorption coefficient as a kind of uniform standard,
to the situation of flattop distribution,
d
=1nm, 3nm,
6nm, 10nm, width of 90% peak point of effective
absorption coefficient is <1.0nm (808.5nm one
point), 1.5nm (807.0~808.5nm), 2.0nm
(806.0~808.0nm), 3.0nm (807.0~810.0nm),
respectively. To the situation of Gaussian
distribution, width of 90% peak point of effective
absorption coefficient is <1.0nm (808.5nm one
point), 2.0nm (807.0~809.0nm), 3.5nm
(806.0~809.5nm), 6.0nm (805.0~811.0nm),
respectively. It should be pointed out that absorb
spectrum measuring precision is 0.5nm.
Thus it can be seen that pumping spectrum
distribution has obvious impact on global shape of
pumping. The best way to decrease error from
pumping spectrum shape is getting the pumping
spectrum data by experiment.
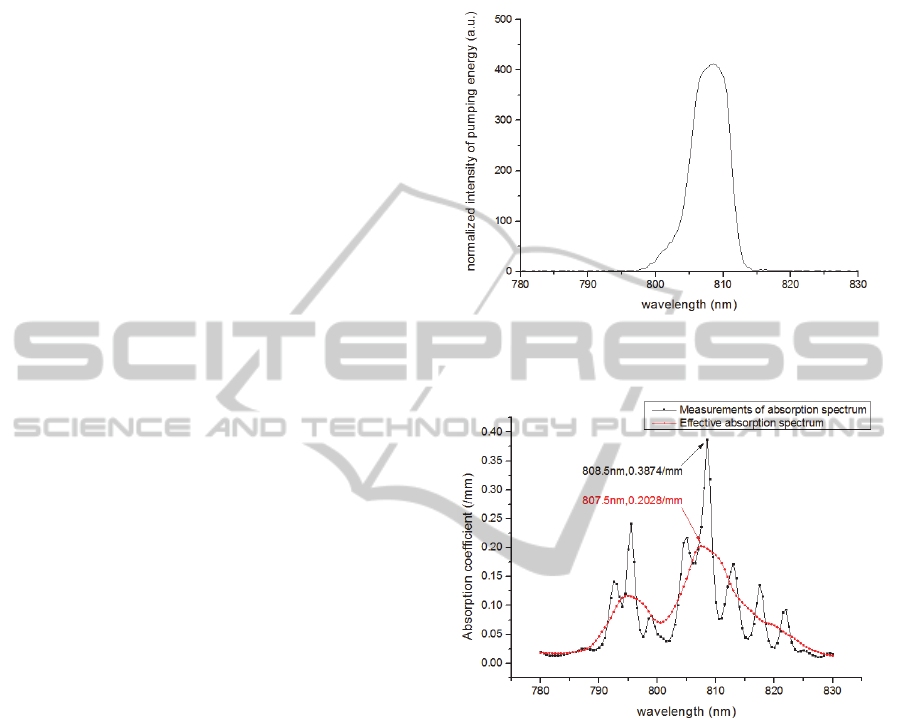
Figure 4: Measurement result of pumping spectrum to the
side-pumping amplifier.
Figure 5: Effective absorption spectrum calculated from
experimental pumping spectrum.
The experimental scheme of the pumping spectrum
measurement contains three parts which are the side-
pumped amplifier, focusing lens, and spectrometer.
Focal length of the lens is 150mm, and diameter is
25.4mm. The distance between the amplifier and
focusing lens is 910mm. Model of the spectrometer
is AVaSpec-3648 (Avantes Co. Ltd), and it is placed
on focusing point of the lens. A piece of optical filter,
which can absorb 1064nm, and let 808nm laser
transmit is used in front of the receiver of the
spectrometer. Absorption spectrum measurements
result is shown in Fig.4. It is a typical pumping
spectrum, and FWHM of the pumping spectrum is
6.3nm. By the same calculation method, effective
absorb coefficient is distributed to each points, and
effective absorb spectrum is plotted in Fig.5. The
PHOTOPTICS2015-InternationalConferenceonPhotonics,OpticsandLaserTechnology
180
shape of effective absorption spectrum calculated
from measurements result of pumping spectrum is
an intermediate state between Fig.2 and Fig.3. Peak
point is 0.2028/mm, and the central wavelength is
807.5nm. Range of 80% peak point is 5.5nm (from
806.0nm to 811.5nm), and range of 90% peak point
is 3.5nm (from 806.5nm to 810.0nm).
Table 2: Contrasting between effective absorption
coefficients with different pumping spectrum distributions.
Wavelength
(nm)
eff
-F
(mm
-1
)
eff
-G
(mm
-1
)
eff
-E
(mm
-1
)
820.0
0.0687 0.0601 0.0656
819.5
0.0712 0.0629 0.0676
819.0
0.07 0.0658 0.0689
818.5
0.0661 0.0686 0.0704
818.0
0.0628 0.0715 0.0728
817.5
0.0632 0.0745 0.0762
817.0
0.0681 0.0776 0.0807
816.5
0.0773 0.0810 0.0859
816.0
0.0883 0.0848 0.0911
815.5
0.0975 0.0889 0.0957
815.0
0.1024 0.0937 0.1003
814.5
0.1014 0.0990 0.1054
814.0
0.097 0.1050 0.1107
813.5
0.0949 0.1117 0.1173
813.0
0.0977 0.1192 0.1261
812.5
0.1081 0.1274 0.1372
812.0
0.1294 0.1363 0.1498
811.5
0.1558 0.1459 0.1627
811.0
0.1745 0.1558 0.1738
810.5
0.1851 0.1658 0.1819
810.0
0.1889 0.1754 0.1872
809.5
0.1891 0.1841 0.1911
809.0
0.1903 0.1913 0.1946
808.5
0.1948 0.1966 0.1983
808.0
0.2037 0.1994 0.2014
807.5
0.2137 0.1994 0.2028
807.0
0.2196 0.1967 0.2002
806.5
0.2193 0.1913 0.1918
806.0
0.2103 0.1835 0.1781
805.5
0.1894 0.1736 0.1622
805.0
0.1626 0.1622 0.1466
804.5
0.1422 0.1499 0.1324
804.0
0.1274 0.1371 0.1199
803.5
0.1158 0.1244 0.1088
803.0
0.1063 0.1125 0.0987
802.5
0.0978 0.1017 0.0891
802.0
0.0894 0.0925 0.0809
801.5
0.0787 0.0852 0.0753
801.0
0.0669 0.0800 0.0717
800.5
0.0586 0.0769 0.0701
800.0
0.0553 0.0759 0.0714
Table 2 makes a contrast about effective
absorption coefficient among three different
situations.
eff
-F is the effective absorption
coefficient with flattop distribution pumping
spectrum and FWHM=6nm.
eff
-G is the effective
absorption coefficient with Gaussian distribution
pumping spectrum and FWHM=6nm.
eff
-E is the
effective absorption coefficient with experimental
LD pumping spectrum and FWHM=6.3nm.
4 INFLUENCE OF EFFECTIVE
ABSORPTION COEFFICIENT
ON UNIFORM PUMPING
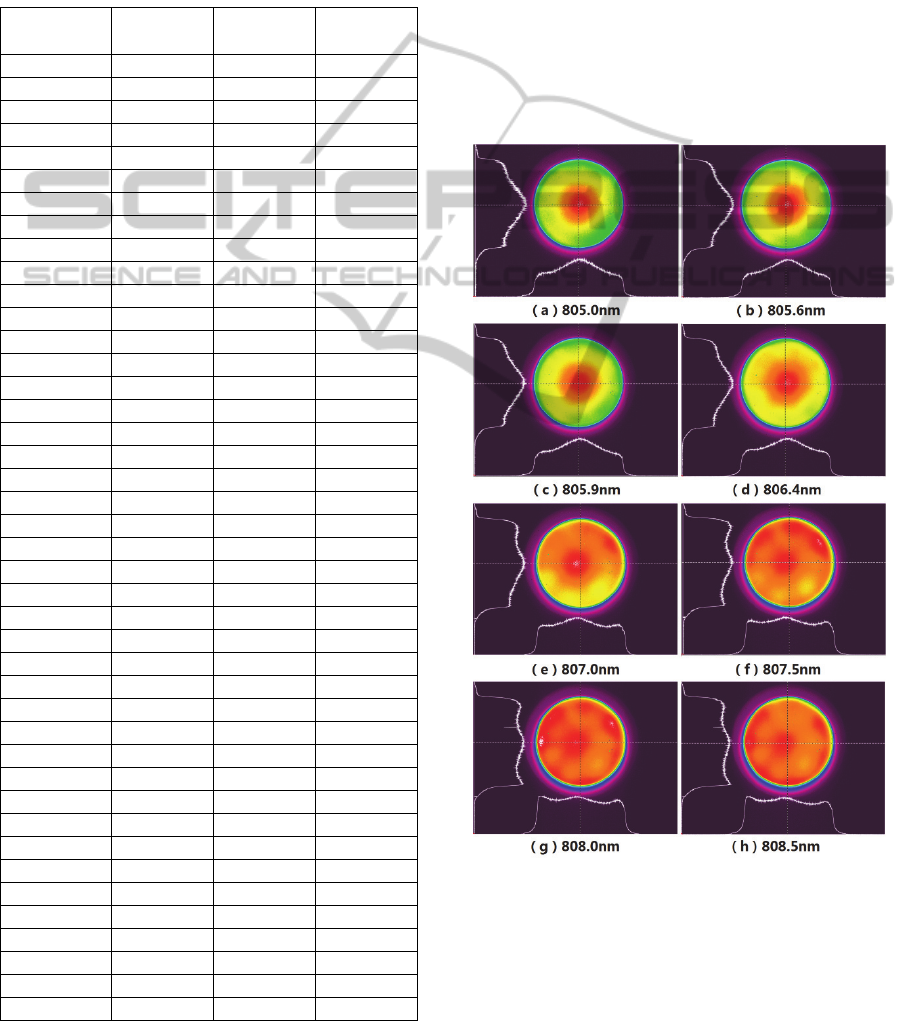
Figure 6: Influence of central wavelength of pumping
spectrum on pumping energy distribution.
Measurement scheme of pumping energy
distribution is similar to pumping spectrum, but only
a silicon CCD camera (SP620U, Ophir Co. Ltd.) is
StudyonInfluenceofPumpingSpectrumonStableUniformPumpinginaSide-PumpedNd:YAGAmplifier
181
used to substitute spectrometer. In the amplifier, 7
laser diode arrays are placed around the working
material in circle, and fast axis is paralleled with the
rod. The fluorescence distribution images of central
pumping wavelength from 805.0nm to 808.5nm are
shown in Fig.6. Experimental results illuminate that
central pumping wavelength has effected
fluorescence distribution obviously. When central
pumping wavelength increasing, fluorescence
density in the centre of the rod drops obviously.
After converse measuring results in Fig.6 to
grayscale, normalized fluorescence density on
horizontal and vertical cross-section are presented.
Making a contrast between gray level of central
point and average of the four edge points, sketchy
quantitative analysis results can be gained. From
805.0nm to 808.5nm, gray level of the central point
is 136, 137, 134, 136, 138, 134, 138, 137, and
average of edge points are 78, 81, 80, 91, 110, 122,
131, 128. There is an increasing from 57.4%, 59.1%,
59.7%, 66.9%, 79.7%, 91.0%, 94.9%, 93.4%.
Experimental results indicate that deviation of
central pumping wavelength affects pumping energy
distribution on cross-section of the rod obviously.
When environment temperature rise or drop,
pumping power increase or decrease, central
wavelength will fluctuate, flattop distribution on
cross section of the rod would be changed in
agreement of experimental results.
5 STABLE UNIFORM PUMPING
DEIGN
To diminish effect of central wavelength drift, a
special coating on flow tube can be used. If a 5nm,
10nm, 15nm, 20nm flattop region is expect to be
realized in effective absorption coefficient, coating
curve can be calculated from the data in Fig.5. If
minimum point of the effective absorption spectrum
is
)min(
eff
in the designed region, a coefficient
eff
eff
)min(
(6)
should be overlapped on the effective absorption
coefficient to realized a region of flattop
distribution. By overlapping
on pumping
spectrum, a special designed pumping spectrum can
be gotten. If this kind of pumping spectrum is
realized by laser diode control or coating, a flattop
effective absorption coefficient can be gotten. Fig.7
is the optimized pumping laser diode spectrum,
which performed on the pumping spectrum in Fig.4.
In Fig.7,
d
is the flattop region to be designed in
effective absorption coefficient spectrum.
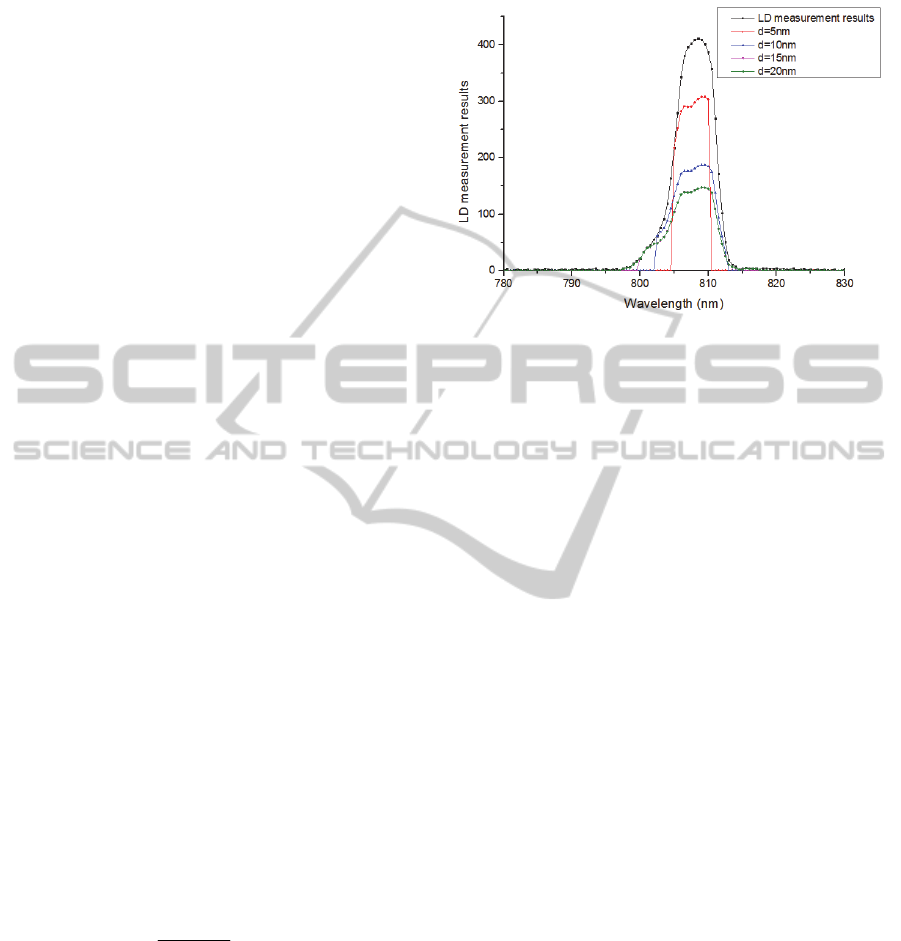
Figure 7: Optimized pumping spectrum with different
flatten region.
In conclusion, we present a pumping spectrum
shaping idea about side-pumped Nd:YAG amplifier
that can realized temperature-stable uniform
amplification. By optimizing pumping laser diode
spectrum shape, effective absorption coefficient can
be controlled to flattop shape, and temperature-
stable can be realized. However, the most important
fact is how to loading such kind of spectrum on
working materials.
ACKNOWLEDGEMENTS
This work was financially supported by the scientific
research equipment development project of the
Chinese Academy of Sciences under contract
No.YZ201216, and national key scientific and
research equipment development project of China
under contract No.ZDYZ2013-2.
REFERENCES
D. L. Shealy and S. H. Chao (2004), “Design of GRIN
laser beam shaping system,” Proc. of SPIE 5525, 138–
147.
I. Mashaiekhyasl (2012), “Design and Construction of a
700-W CW Diode-Pumped Nd:YAG rod laser with
high beam quality and highly efficient concentrator of
Pump-Light,” in Quantum Information and
Measurement Conference (QIM), JT2A.51.
Y. Park, M. Kulishov, R. Slavík, and J. Azana (2006),
“Picosecond and sub-picosecond flat-top pulse
generation using uniform long-period fiber gratings,”
Opt. Express, Vol.14 No.26, 12670–12678.
PHOTOPTICS2015-InternationalConferenceonPhotonics,OpticsandLaserTechnology
182

T. Kojima, S. Fujikawa, K. Yasui (1999), “Stabilization of
a high-power diode-side-pumped intracavity-
frequency-doubled CW Nd:YAG laser by
compensating for thermal lensing of a KTP crystal and
Nd:YAG rods,” Quantum Electronic, Vol.35 No.3,
377 – 380.
V. V. Kotlyar, A. A. Kovalev, R. V. Skidanov, S. N.
Khonina, and J. Turunen (2008), “Generating
hypergeometric laser beams with a diffractive optical
element,” Appl. Opt., Vol.47 No.32, 6124–6133.
R. Borghi (2013), “Uniform approximation of paraxial
flat-topped beams,” J. Opt. Soc. Am. A, Vol.30 No.6,
1099–1106.
M. R. Taghizadeh, P. Blair, K. Balluder, A. J. Waddie, P.
Rudman, and N. Ross (2000), “Design and fabrication
of diffractive elements for laser material processing
applications,” Opt. Lasers in Eng., Vol.34 No.4-6,
289–307.
K. L. Baker, D. Homoelle, E. Utternback, E. A.
Stappaerts, C. W. Siders, and C. P. J. Barty (2009),
“Interferometric adaptive optics testbed for laser
pointing, wave-front control and phasing,” Opt.
Express, Vol.17 No.19, 16696–16709.
T. Z. Zhao, J. Yu, C. Y. Li, K. Huang, Y. M. Ma, X. X.
Tang, and Z. W. Fan (2012), “Beam shaping and
compensation for high-gain Nd:glass amplification,” J.
Mod. Opt., Vol.60 No.2, 109–115.
Y. J. Kaufman and U. P. Oppenheim (1974), “Rate
Equations of High Gain Lasers and Determination of
Laser Parameters,” Appl. Opt., Vol.13 No.2, 374–378.
StudyonInfluenceofPumpingSpectrumonStableUniformPumpinginaSide-PumpedNd:YAGAmplifier
183
