
Interest Area Localization using Trajectory Analysis in Surveillance
Scenes
D. P. Dogra
1
, A. Ahmed
2
and H. Bhaskar
3
1
School of Electrical Sciences, Indian Institute of Technology, Bhubaneswar, India
2
Department of Computer Sc. & Engineering, Haldia Institute of Technology, Haldia, India
3
Department of Electrical and Computer Engineering, Khalifa University of Science Technology and Research,
Abu Dhabi, U.A.E.
Keywords:
Interest Area Detection, Trajectory Analysis, Surveillance, Clustering.
Abstract:
In this paper, a method for detecting and localizing interest areas in a surveillance scene by analyzing the
motion trajectories of multiple interacting targets, is proposed. Our method is based on a theoretical model
representing the importance distribution of different areas (represented as a rectangular blocks) present in a
surveillance scene. The importance of each block is modeled as a function of the total time spent by mul-
tiple targets and their relative velocity whilst passing through the blocks. Extensive experimentation and
statistical validation with empirical data has shown that the proposed method follows the process of the the-
oretical model. The accuracy of our method in localizing interest areas has been verified and its superiority
demonstrated against baseline methods using the publicly available: CAVIAR, ViSOR datasets and a scenario-
specific in-house surveillance dataset.
1 INTRODUCTION
Scene understanding in video(s) for surveillance ap-
plications has received significant attention in recent
years. Considerable amount of research is carried on
improving models for the detection and tracking of
moving targets in a scene and by analyzing the mo-
tion characteristics of such moving targets, perform
behavioral analysis (Brun and Vento, 2014), anomaly
detection (Suzuki and Fujino, 2007; Xu and Chen,
2013; Zhou and Huang, 2007; Piciarelli and Foresti,
2008), trajectory clustering (Piciarelli and Foresti,
2006), semantics analysis (Wang and Grimson, 2006)
and even scene classification (Morris and Trivedi,
2008). Whilst such methods have been largely suc-
cessful in human and insect behavior understanding;
not much research efforts has been spent in modeling
the underlying semantic relationships between mov-
ing targets and static objects for scene understanding.
Moving target detection is widely supported by the
development of the state-of-the-art algorithms (Dinh
and Medioni, 2011). However, on the other hand,
the static objects in the scene have either been ne-
glected from video analysis and usually left-out as
a part of the background or detected using object-
specific global models. It is important to acknowl-
edge that the movements of targets in any uncon-
strained environment is often governed by the pres-
ence of static objects in the scene. For example, in
a common room environment, the presence of a cof-
fee vending machine and its location influence a spe-
cific motion pattern in that scene. By localizing such
interest areas where static objects are located and ac-
cessed by moving targets, it is often possible to make
more informed decisions on the behavior and activi-
ties of moving targets in that scene. The purpose of
localizing interest areas may intuitively be equivalent
to motion invariant generic object detection, which
is ideal; however is often impractical as it would re-
quire models for countless number of objects that can
be present in any surveillance environment. In this
paper, we propose a technique for the detection and
localization of those interest areas in the scene con-
taining static objects that influence the motion char-
acteristics of other moving targets during autonomous
surveillance. The structure of the paper is as follows.
We begin by outlining some of the main contributions
and distinguishing aspects of the paper in compari-
son to baseline strategies in Section 2. A theoretical
model of target behavior with an appropriate research
hypothesis and a novel trajectory analysis technique
with relevant modeling and parametrization are pre-
478
Dogra D., Ahmed A. and Bhaskar H..
Interest Area Localization using Trajectory Analysis in Surveillance Scenes.
DOI: 10.5220/0005334704780485
In Proceedings of the 10th International Conference on Computer Vision Theory and Applications (VISAPP-2015), pages 478-485
ISBN: 978-989-758-090-1
Copyright
c
2015 SCITEPRESS (Science and Technology Publications, Lda.)

sented in Section 3. We then conduct experiments on
the chosen datasets (in Section 4) to investigate the
effect of key system parameters and demonstrate the
superiority of the proposed strategy in comparison to
other baseline techniques. Finally, the research hy-
pothesis is verified in Section 4 before we conclude
in Section 5.
2 CONTRIBUTIONS &
DISTINGUISHING ASPECTS
The fundamental purpose of the proposed research
is to detect interest areas that are potential loca-
tions of those static objects which influence mov-
ing targets and localize them using the trajectories
of multiple moving targets, for natural scene under-
standing. In other words, while the areas of scene
labeling (Farabet and LeCun, 2013), object detec-
tion (Sharma and Nevatia, 2013) and object track-
ing (Dinh and Medioni, 2011) have been the focus
of scene understanding research in the recent past, it
is proposed that significant impact can be made by
solving these problems jointly. The localization of
such interest areas can facilitate automatic scene re-
construction and help to make informed decisions on
the behavior of moving targets. A key novelty of our
method is the integration of target behavioral seman-
tics into a theoretical distribution of area importance.
Such an integration allows building a realistic statis-
tical model of target motion and interaction in an un-
restricted environment. In addition, the importance
estimation of areas in a surveillance scene is based
on a novel ”entry-exit” motion model of multiple tar-
gets through the measurement of time spent between
entry-to-exit and the relative velocity changes. Fur-
thermore, we also provide detailed analysis and com-
parison of our results on different datasets that permit
bench-marking of similar strategies, in the future.
Given the breadth of techniques for scene un-
derstanding; we highlight some of the critical dis-
tinguishing aspects of our proposed method against
other available state-of-the-art strategies, particularly
from the trajectory analysis and salient object detec-
tion perspectives. In the light of trajectory analysis
techniques: a) our method does not explicitly model
motion flow as in (Morris and Trivedi, 2008), b) our
method is invariant to partial trajectories and the sam-
ple size that constitutes the motion trajectory of the
targets in a scene in comparison to (Wang and Grim-
son, 2006), c) our method does not build variances by
measuring similarities or distances between different
motion trajectories of multiple targets like the method
of (Zhou and Huang, 2007), instead builds essential
Figure 1: (a) A typical representation of the surveillance en-
vironment with one object of interest. (b) Rectangular sub-
division of the surveillance environment assuming the ob-
ject of interest is located at the center. (c-f) Typical motion
pattern followed by a target while approaching the static ob-
ject of interest. (g-h) Estimation of importance of a block
as a function of the motion dynamics.
statistics by considering all the motion trajectories of
multiple targets, and d) the proposed method does
not adopt any highly computational intensive multi-
scale trajectory analysis techniques such as (Yang and
Shah, 2009). In another dimension, from the salient
object detection point-of-view: a) our method does
not perform generic global salient object detection
such as in (Rahtu and Heikkila, 2010), instead at-
tempts to localize salient areas in the scene that in-
fluences the motion dynamics of targets, b) target in-
teraction in our method is modeled using trajectory
analysis and not through the typical connected com-
ponent analysis (Pan and Pankanti, 2011) and (c) our
method is also deterministic and independent of learn-
ing or training for interest area localization with min-
imal parametrization as against (Saleemi and Shah,
2009; Xu and Chen, 2013; Yang and Shah, 2009).
3 PROPOSED METHODOLOGY
In the proposed methodology, we assume that
moving targets are only restricted by the presence
of boundary walls and other static objects in the
scene, not otherwise. Some of these static objects
present inside the surveillance scene are of much
interest to moving targets and it is assumed that, any
normal target will be more attracted towards these
specific static objects than the other areas of the scene.
Theoretical Model and a Hypothesis
For simplicity, let us consider a single static object
of interest to be located inside a chosen surveillance
scene. Assuming that a target can reach the static
InterestAreaLocalizationusingTrajectoryAnalysisinSurveillanceScenes
479

object of interest from any direction, it is obvious
to expect its movement to follow the shortest path.
This typical scenario is illustrated in Fig. 1(a). The
intermediate space is unconstrained and the target can
move freely while heading towards the static object
of interest. A block based geometry, as depicted in
Fig. 1(b), is used to illustrate the different motion
configurations possible within such an environment.
That is, let us consider that the environment is
partitioned into a rectangular grid of a predefined
size. Therefore, as a target moves towards the static
object of interest, the path is through the intermediate
blocks (C
1
,C
2
,C
3
) considering its initial position
is in one of the outer layer blocks, e.g. B
1
, ..., B
5
.
There can be different ways a target can reach to a
particular inner block from a set of outer blocks. For
example, if the initial location of the target is in (B
1
),
and if the shortest path assumption holds, then the
target must go through (C
1
) as depicted in Fig. 1(c).
Other possibilities are described in the successive
images. Under these conditions, a theoretical model
can be used to describe the movement. Suppose, the
probability of a target being in one of the outermost
blocks is represented as P. It can easily be verified
from the images shown in Figs. 1(c-f) that, a target
can reach to one inner block from an outer block
in three possible ways. Therefore, probability of
reaching any of the inner block becomes three times
the probability of an outer block. Since the static
object of interest is at the center and surrounded by
eight equip-probable blocks, the possible ways of
reaching the target is eight times higher than of its
immediate neighboring blocks. Figs. 1(g-h) illustrate
the method for a three layer geometry. However, this
can easily be extended for any desired number of
layers.
Figure 2: (a) Division of a space assuming the object of in-
terest is located at the center and corresponding frequency
of a block being used while a target approaches the object
of interest. (b) pdf of the importance of a block in terms
of number of times a block is accessed while a target ap-
proaches the object of interest located at center.
The Hypothesis. Suppose, x is a random variable that
denotes the probability of a target visiting a particular
block while approaching an object of interest. If we
plot the different number of ways an inner block
can be reached from an outer block, the normalized
probability computed shall represent a distribution of
the importance of the blocks. Now, we hypothesize
that, given a scenario where sufficient number of
targets approach towards an object of interest, if the
surveillance space is divided into rectangular blocks
as shown in Fig. 2(a), then the target motion model
will usually follow the theoretical distribution shown
in Fig. 2(b).
Proposed Trajectory Analysis. The proposed
trajectory analysis method has been designed with
the knowledge of the theoretical model described
earlier. We have used the target detection and
tracking algorithm proposed in (Dinh and Medioni,
2011) to extract the trajectories of moving targets.
A spatial domain heuristic, where-in a point on
the trajectory is removed if it deviates abruptly
from its usual path, has been applied to remove
noise/outliers from the trajectories. Further, the
importance of a block is estimated from the cleaned
trajectories using the steps detailed below. During
pre-processing, the surveillance scene is divided
into a rectangular grid of uniform dimension as
shown in Fig. 1(b) where the total number of blocks
is denoted by M. Assuming that N trajectories of
multiple targets are available for analysis; it can be
represented as a set, say T = {t
1
,t
2
...,t
N
} such that
t
i
= (< x
1
, y
1
>, < x
2
, y
2
>, ......, < x
m
i
, y
m
i
>
) is a
trajectory of length m
i
. The importance of a block is
estimated as:
• Step I. The average velocity (V
O
i
avg
) of a target
(O
i
) is estimated from the uniformly sampled seg-
ments of its trajectory. First, the minimum and
maximum values of the velocity of the targets are
calculated using (1) and (2) such that p
j
and p
j+1
denote successive points on the trajectory t
i
that is
bounded by 0 < j <
|
t
i
|
.
V
O
i
min
= min |p
j
− p
j+1
| (1)
V
O
i
max
= max |p
j
− p
j+1
| (2)
Next, range of the velocity [V
O
i
max
− V
O
i
min
] is di-
vided into R uniform segments and a histogram of
the instantaneous velocity is generated. Finally,
the mean of all instantaneous velocities under the
largest bin is taken as the average velocity of the
target. This will remove any bias that may occur
due to fast moving segments within a given trajec-
tory.
• Step II. Next, the total number of times a block is
visited by various targets is computed. We call it
global visit (G
M
k
) where M
k
is the block. Initially,
global visit parameter for all the blocks are set to
zero. However, when a target enters into a new
block, we increment its global visit value by one.
VISAPP2015-InternationalConferenceonComputerVisionTheoryandApplications
480

• Step III. The global visit parameter is then used
to filter out some of the unimportant blocks. We
calculate the minimum and maximum values of
G
M
k
and apply a a methodology similar to the one
described in Step I to construct a histogram. Now,
all such blocks where the value of G
M
k
is less
than the average of G
M
k
’s of the largest bin are
discarded. This essentially discards those blocks
where a target rarely visited or did not visit at all.
• Step IV. Next, the per visit weight (W
M
l
) of the
remaining blocks represented in terms of the rela-
tive average velocity of the moving targets is cal-
culated. Initially, per visit weight of all the blocks
is set to zero. It is assumed that a target usually
moves slower than its average velocity when it
approaches the location of a static object of in-
terest. That is, the instantaneous velocity (V
O
i
j
) is
expected to be less as compared to its average ve-
locity V
O
i
avg
and the weight of that particular cell is
updated using (3).
W
M
l
= W
M
l
+
V
O
i
avg
−V
O
i
j
V
O
i
avg
(3)
Above step guarantees that, if a target moves rel-
atively slower than its average velocity in a par-
ticular block, it contributes more to the value of
average weight of that block.
• Step V: Using the per visit weight of a block and
the global count described in the previous steps,
a probabilistic estimation of the presence a tar-
get inside a block is made. For this, we define
a term called Importance (I) that is computed us-
ing (4). To filter out blocks where the global
visit count is higher due to unintended visits, (e.g.
blocks that cover entry / exit areas are expected
to have large global visit values) we discard all
such blocks where I is less than the average per
visit weight (I
avg
). The cell importance of such
discarded blocks are expected to be small because
targets usually do not spend much time in such
blocks. Finally, normalized importance is taken
as the probability of a block.
I(M
k
) =
W
M
l
G
M
k
(4)
Therefore, a peak in the distribution of importance
can be indicative of the presence of an object of in-
terest and the presence of several peaks may be ob-
served if multiple interesting objects are found inside
the surveillance area.
4 RESULTS & ANALYSIS
We have selected the CAVIAR
1
and ViSOR
2
datasets
that contains several videos of surveillance scenes to
benchmark our model against baselines. Videos un-
der the ”Browsing” category of the CAVIAR dataset
were chosen for analysis as they typically represent
events mentioned in the research hypothesis. Each of
these videos were 240 seconds clips in average with 2
or 3 freely moving targets that are randomly access-
ing a vending machine and an ATM present within the
open environment. From ViSOR dataset, we have se-
lected videos from the ”Outdoor Unimore D.I.I. Setup
- Multicamera - Disjoint Views” set (Vezzani and
Cucchiara, 2010). These videos are of longer duration
(typically in the order of 40-60 minutes). We have
extracted trajectories of several moving targets from
these videos and used them in our analysis. We have
also collected 100+ trajectories from the Fish dataset
and applied them to our proposed methodology to an-
alyze the fish behavior in underwater videos (Beyan
and Fisher, 2013). In addition to that, a custom in-
house dataset that mainly contains free movement of
human targets accessing a center table within a lab-
oratory environment, has been used for testing. The
above mentioned datasets have been used for indepen-
dent as well as comparative analysis.
The baseline algorithms used for comparison
are carefully selected and can be categorized into
two classes: a) saliency based techniques in-
cluding: discriminative regional feature integra-
tion(DRFI) (Jiang and Li, 2013),principal compo-
nent analysis (PCA) (Margolin and Zelnik-Manor,
2013) and saliency map (SM) (Rahtu and Heikkila,
2010), and b) abandoned object detection (AOD)
3
.
The saliency based methods used in our comparison
are mainly image based techniques, hence, we have
extended them for detecting salient objects in video
frames by combining them with a trajectory density
(TD) estimation method. Thus the salient objects de-
tected on a frame-by-frame basis is correlated with
those spatial locations where the trajectory density is
maximum and the interest areas are further localized.
The abandoned object detection algorithm used for
comparison in this paper is based on connected com-
ponent analysis. We present the comparative results
with all four state-of-the-art techniques to demon-
strate the superiority of the proposed algorithm.
In Figure 3, the results of the proposed method in
1
CAVIAR: Context Aware Vision using Image-based
Active Recognition
2
ViSOR:www.openvisor.org.
3
http://www.mathworks.in/help/vision/examples/
abandoned-object-detection.html.
InterestAreaLocalizationusingTrajectoryAnalysisinSurveillanceScenes
481
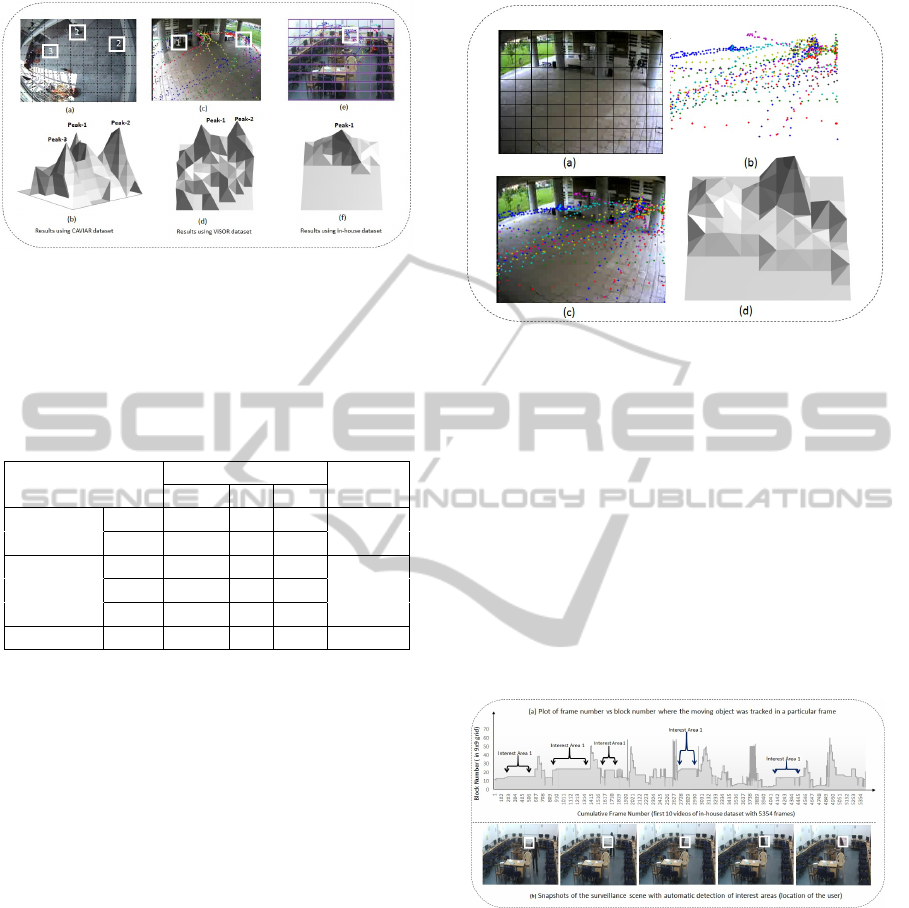
Figure 3: Results and analysis using videos from datasets.
(a-b) Localization of interest areas of the surveillance scene
of CAVIAR Browsing dataset. (c-d) Results of interest area
localization using ViSOR dataset trajectories. (e-f) Results
using in-house dataset.
Table 1: Performance of the proposed interest area local-
ization technique with respect to ground truths. IA: Interest
Area, V: Visited, NV: Not-Visited, D-Rate: Detection Rate.
Dataset Trajectories
D-Rate
Total V NV
ViSOR
IA 1 62 28 34
100%
IA 2 62 11 51
CAVIAR
IA 1 4 2 2
75%
IA 2 4 2 2
IA 3 4 3 1
In-house IA 1 17 9 8 100%
localizing interest areas from ViSOR, CAVIAR, and
in-house datasets are presented first.
It is evident from Figure 3 that the proposed tech-
nique was successful in localizing interest areas. The
corresponding locations of the peaks are highlighted
with a bounding box and when compared to the
ground truth, the proposed technique is found to be
accurate in localizing areas. A summary of results
using the three datasets are presented in Table 1. It
can be observed that the proposed algorithm has mis-
classified one area of the CAVIAR scene as interest-
ing, marked as peak-3 in Figure 3(b) or interest area
3 in the table. This mis-classification is the result of
the protocol behavior (motion pattern) of targets in the
CAVIAR dataset. Although we perceive this a ”non-
interest area” from a behavior analysis point of view,
this disagreement between the stopping of targets in
the middle of a room, and lack of sufficient evidence
of an interest area, can itself be useful to detecting
suspicious activity. However, from an interest area
localization point of view, we classify the third peak
as a false positive or falsely detected interest area.
Our observations with the chosen datasets confirm
that the proposed importance metric, composed of ve-
locity changes and time spent is robust and our as-
Figure 4: Additional results using ViSOR dataset videos
that were captured from another viewing angle on the same
surveillance area at different time instance. (a) Scene with
a rectangular grid. (b) Time varying trajectories of some of
the targets. (c) Trajectories superimposed on the original
scene. (d) Peak detected using the proposed algorithm.
sumptions for interest-area localization holds true for
a large selection of scenarios in surveillance applica-
tions.
Additional results of localization using a set of
videos from the ViSOR dataset is presented in Fig-
ure 4. It may be observed that the peak representing
the interest area has higher density of trajectory points
which is quite natural since many targets is likely to
have visited that area.
Figure 5: (a) Evidence of the presence of interest point in
temporal domain on a set of trajectories selected from the
in-house dataset. (b) A few snapshots of the surveillance
scene where the interest point was automatically marked
when a person reached the location of interest.
Our algorithm was successful in detecting the cor-
rect interest areas and successfully reject false pos-
itives (e.g. locations with high trajectory density)
where the baseline techniques failed. In Figure 5(b),
we present some of the video frames of in-house
data where the interest area was localized automati-
cally. Localization of interest area in temporal domain
is shown in Figure 5(a). We have considered 5354
frames of the in-house dataset videos to highlight the
VISAPP2015-InternationalConferenceonComputerVisionTheoryandApplications
482
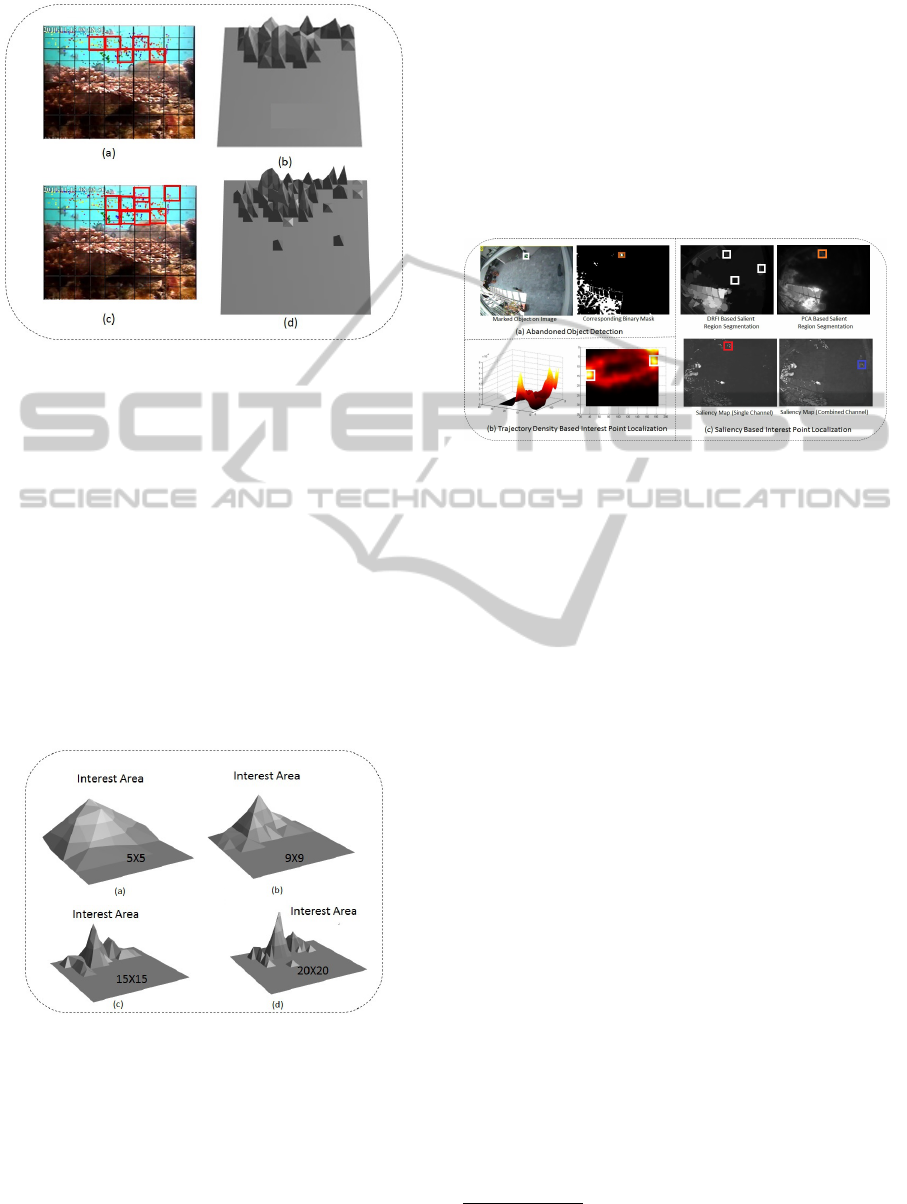
Figure 6: Results using the scene from the Fish trajectory
dataset and localised interest area.
relevant time-sequences that correspond to the inter-
est areas represented by block numbers. This experi-
ment demonstrates the effectiveness of our algorithm
even when applied on a sufficiently large number of
frames.
Our analysis on Fish video dataset suggests that a
conclusion based on a single peak is complicated be-
cause, the movement of fish inside water may be gov-
erned by the rules of their world. Several peaks were
detected as shown in Figure 6, where a high density of
fish population was found. However, the environmen-
tal significance of the interest area needs to be studied
more in detail before conclusive remarks can be made
on such datasets.
Figure 7: (a-d) Effect of block size on performance of the
interest area localization process, e.g. block size = 5 × 5,
9 × 9, 15× 15, and 20 × 20.
In our study we have found that our proposed lo-
calization algorithm is sensitive to block size. In Fig-
ure 7, distributions of I(M
k
) using varying block size,
e.g. 5 × 5, 9 × 9, 15 × 15, and 20 × 20 is presented. It
is evident that the peaks become more prominent with
the increase in the number of divisions (or reduction
of grid sizes). As expected, a larger block size effec-
tively reduces the total number of inter-block move-
ments and hence results in the inclusion of the regions
surrounding the interest area within the peak proxim-
ity. However, in contrary, if the block size is reduced
beyond a scene-specific threshold, larger number of
closely located peaks are produced thus making the
segmentation of the interest area difficult. After suffi-
cient validation, a grid size of 9 × 9 was found to be
optimal for the choice of videos in our datasets.
Figure 8: (a) Abandoned object detection on CAVIAR
dataset. (b) Trajectory density based interest point local-
ization on another in-house dataset. (c) Various techniques
of saliency based interest point segmentation on CAVIAR
dataset.
Next, we present the results of comparisons of
the proposed approach against the baseline algorithms
mentioned at the beginning of this section. Figure 8
presents the results of interest localization obtained
when applied on CAVIAR dataset. It may be observed
that, although the saliency based techniques (Jiang
and Li, 2013; Margolin and Zelnik-Manor, 2013;
Rahtu and Heikkila, 2010) when combined with tra-
jectory density estimation method is able to localize
some of the interest areas, these baselines were found
to contain a larger number of false positives and is
highly influenced by noise in measurements. In ad-
dition, the localization of the interest areas were only
possible after the integration of the temporal analysis
through trajectory density estimation and in the ab-
sence of the which, the baselines could not closely
match with the proposed. Figure 8a illustrates the
interest areas obtained using the abandoned object
detection algorithm based on connected component
analysis
4
that was successful in detecting the reading
desk only. In addition in Figure 8b, we have also ap-
plied the trajectory density based interest area local-
ization algorithm on our in-house dataset, which was
able to identify two locations as denoted by the peaks
in the density map presented. A summary of local-
ization done using the selected baseline algorithms is
presented in Table 2.
4
http://www.mathworks.in/help/vision/examples/
abandoned-object-detection.html
InterestAreaLocalizationusingTrajectoryAnalysisinSurveillanceScenes
483

Table 2: Localization of interest areas using baseline algo-
rithms on CAVIAR dataset videos. GT: Ground Truth, TP:
True Positive (Correctly Detected Interest Areas), TN: True
Negative ( Interest Areas Missed or Omitted), FP: False
Positive (Areas Incorrectly Detected as Interest Locations).
Method GT TP TN FP
TD 2 2 2 0
DRFI 2 0 0 2
DRFI+TD 2 2 0 1
PCA 2 0 0 2
PCA+TD 2 1 1 0
SM 2 0 0 2
SM+TD 2 1 1 0
AOD 2 1 1 0
Proposed 2 2 0 1
Table 3: Comparison of computational complexity of the
proposed method against chosen baselines calculated on
average per-frame on the sequences from the CAVIAR
dataset.
Method Time (sec.)
Proposed Method 0.015
TD 3.3452
DRFI 8.5640
PCA 5.3923
SM 8.2116
AOD 0.0307
In Table 3, we provide a comparison of the com-
putational complexity of the proposed method against
the chosen baseline strategies. The proposed method
is a seamless integration of tracking and trajectory
analysis for interest area localization that provides an
undue time advantage of 0.015sec. This time gain is
primarily attributed to the spatial independence of the
dynamic motion features that the proposed algorithm
relies-on for localizing interest areas. In contrast, the
other baseline methods use computationally intense
study of spatio-temporal relationships for detecting
interest areas. The experiments have been performed
on an Intel i7 2.8GHz machine running Matlab 2014b.
Verification of the Hypothesis
Let, the importance of a block based on the the-
oretical analysis be represented using a discrete
random variable, say y. A histogram considering
a window of M × N around the center of an object
of interest is generated. The histogram represents
the discrete probability distribution of the random
variable. Assume that the distribution is denoted
as Q(y). Similarly, a histogram around the peak of
the probability values computed, is produced. Let
this distribution be represented as P(y). According
to the hypothesis, a target usually approaches the
location of a static object following the shortest
path. Therefore, given adequate number of such
trajectories, the probabilistic model computed from
the data is expected to follow the theoretical model.
We have used Kullback-Leibler Divergence (KLD)
(dis)similarity metric to validate our hypothesis.
Theoretically, D
KL
(P(y)||Q(y)) is a measure of loss
of information when P(y) is approximated by Q(y)
and it is defined using (5).
D
KL
(P||Q) =
∑
y
ln
P(y)
Q(y)
P(y) (5)
Since it is a non-symmetric measure, we have used
the symmetric version of the KLD (6). The quantity is
often used for feature selection in classification prob-
lems, where P(y) and Q(y) represent conditional pdf
of a feature under two different classes.
D
KL
=
∑
y
ln
P(y)
Q(y)
P(y)+
∑
y
ln
Q(y)
P(y)
Q(y) (6)
To verify the hypothesis, the distribution shown in
Figure 2(b) was taken as P(y) and the distributions
shown in Figure 7 were taken as Q(y). The following
values of D
KL
for various grid configurations: 0.6956
(5 × 5), 0.5497 (9 × 9), 0.9619 (15 × 15), and 0.8668
(20 × 20) were recorded. However, this confirms that
the proposed algorithm produces best result in view of
the theoretical model when a 9 × 9 grid size is used.
We also performed correlation analysis between P(y)
and Q(y) and recorded the coefficients using different
grid sizes. The values are 0.01 (5 × 5), 0.77 (9 × 9),
0.63 (15 × 15), and 0.37505 (20 × 20). It is found
that both the metrics behave consistently and 9 ×9 has
been found to be optimum validating our test results
that ”a very large or small sized grid may not be ideal
since it deviates more from the theoretical model”.
5 CONCLUSION & FUTURE
WORK
In this paper, we proposed a technique of localiz-
ing interest areas from a video using the motion tra-
jectories of multiple moving targets in the environ-
ment. The proposed method was based on a theo-
retical model of natural human behavior in an un-
constrained environment that was further statistically
verified and validated using various datasets. The re-
sults of the method have demonstrated its ability to lo-
calize key elements in the scene that govern changes
in the motion characteristics of target in the environ-
ment. We strongly anticipate the future of this paper
VISAPP2015-InternationalConferenceonComputerVisionTheoryandApplications
484

to throw insight into natural behavior understanding
in surveillance taking into consideration not just the
motion of targets but equally the knowledge of the
other elements in an unconstrained scene, that govern
such movements within that environment.
REFERENCES
Beyan, C. and Fisher, R. (2013). Detection of abnormal fish
trajectories using a clustering based hierarchical clas-
sifier. In British Machine Vision Conference, pages
21.1–21.11.
Brun, L., S. A. and Vento, M. (2014). Dynamic scene un-
derstanding for behavior analysis based on string ker-
nels. In IEEE Transactions on Circuits and Systems
for Video Technology.
Dinh, T., V. N. and Medioni, G. (2011). Context tracker:
Exploring supporters and distracters in unconstrained
environments. In Computer Vision and Pattern Recog-
nition (CVPR), pages 1177–1184.
Farabet, C., C. C. N. L. and LeCun, Y. (2013). Learning hi-
erarchical features for scene labeling. In IEEE Trans-
actions on Pattern Analysis and Machine Intelligence,
pages 1915–1929.
Jiang, H., W. J. Y. Z. W. Y. Z. N. and Li, S. (2013). Salient
object detection: A discriminative regional feature in-
tegration approach. In Computer Vision and Pattern
Recognition (CVPR), pages 2083–2090.
Margolin, R., T. A. and Zelnik-Manor, L. (2013). What
makes a patch distinct? In Computer Vision and Pat-
tern Recognition (CVPR). 1139-1146.
Morris, B. and Trivedi, M. (2008). Learning and clas-
sification of trajectories in dynamic scenes: A gen-
eral framework for live video analysis. In Inter-
national Conference on Advanced Video and Signal
Based Surveillance (AVSS), pages 154–161.
Pan, J., F. Q. and Pankanti, S. (2011). Robust abandoned ob-
ject detection using region-level analysis. In Interna-
tional Conference on Image Processing (ICIP), pages
3597–3600.
Piciarelli, C. and Foresti, G. (2006). On-line trajectory clus-
tering for anomalous events detection. Pattern Recog-
nition Letters, 27(15):1835 – 1842. Vision for Crime
Detection and Prevention.
Piciarelli, C., M. C. and Foresti, G. (2008). Trajectory-
based anomalous event detection. Circuits and Sys-
tems for Video Technology, IEEE Transactions on,
18(11):1544–1554.
Rahtu, E., K. J. S. M. and Heikkila, J. (2010). Segmenting
salient objects from images and videos. In European
Conference on Computer Vision (ECCV), pages 366–
379.
Saleemi, I., S. K. and Shah, M. (2009). Probabilistic mod-
eling of scene dynamics for applications in visual
surveillance. In IEEE Transactions on Pattern Anal-
ysis and Machine Intelligence, number 31(8), pages
1472–1485.
Sharma, P. and Nevatia, R. (2013). Efficient detector adap-
tation for object detection in a video. In Computer
Vision and Pattern Recognition (CVPR), 2013 IEEE
Conference on, pages 3254–3261.
Suzuki, N., H. K. T. K. K. Y. S. Y. and Fujino, Y. (2007).
Learning motion patterns and anomaly detection by
human trajectory analysis. In International Confer-
ence on Systems, Man and Cybernetics, pages 498–
503.
Vezzani, R. and Cucchiara, R. (2010). Video surveillance
online repository (visor): an integrated framework.
In Multimedia Tools and Applications, number 50(2),
pages 359–380.
Wang, X., T. K. and Grimson, E. (2006). Learning seman-
tic scene models by trajectory analysis. In European
Conference on Computer Vision (ECCV), pages 110–
123.
Xu, D., W. X. S. D. L. N. and Chen, Y. (2013). Hierarchical
activity discovery within spatio-temporal context for
video anomaly detection. In International Conference
on Image Processing (ICIP), pages 3597–3601.
Yang, Y., L. J. and Shah, M. (2009). Video scene under-
standing using multi-scale analysis. In Computer Vi-
sion and Pattern Recognition (CVPR), pages 1669–
1676.
Zhou, Y., Y. S. and Huang, T. (2007). Detecting anomaly in
videos from trajectory similarity analysis. In Interna-
tional Conference on Multimedia and Expo (ICME),
pages 1087–1090.
InterestAreaLocalizationusingTrajectoryAnalysisinSurveillanceScenes
485
