
Spectroscopic Study of Some IED’s Precursors by Means of Laser
Photoacoustic Spectroscopy Combined with Multivariate Analysis
A. Puiu, G. Giubileo and A. Palucci
ENEA, UTAPRAD-DIM, Via E. Fermi 45, 00044, Frascati, Italy
Keywords: Photoacoustic Spectroscopy, Improvised Explosive Device, Principal Component Analysis.
Abstract: The Improvised Explosive Device (IED) is the most prevalent form of explosive device utilized by terrorists
today being easy to realize and difficult to detect. These explosive devices are made by mixing different
precursor substances that are generally cheap and commercially available. Thus, attention should be focused
on developing fast and reliable methods able to identify such substances. In this paper we applied laser
photoacoustic spectroscopy method for the spectral characterization and identification of a number of
common chemicals used as precursors of IEDs: potassium sulfate, potassium nitrate, magnesium sulfate,
ammonium perchlorate, ammonium nitrate, and acetone. The analyzed chemical species were classified by
Principal Component Analysis applied to the collected spectral data. As conclusion of the study, the laser
photoacoustic spectroscopy combined with chemometrics has confirmed to be a useful tool that could
support the fight against the increased realization of modern bombs for criminal use.
1 INTRODUCTION
The use of explosives and Improvised Explosive
Devices (IEDs) by terrorists continue to pose a
significant threat for civilians. The most prevalent
form of explosive device utilized in the attacks are
the IEDs. These mixtures are homemade, non-
conventional explosives, fabricated by combining
common chemicals to manufacture a rudimental but
efficient bomb. As traditional explosives are difficult
to obtain, bomb makers search for chemicals
commercially available in hardware stores,
pharmacies and cosmetics stores to use them as
explosives precursors. A list of some chemicals used
as precursors of IEDs is reported in Table 1. The
number of explosives which can be home-
manufactured is limited by the imagination and
knowledge as well as by the cost and availability of
these chemicals on the market. Improvised
explosives are typically mixtures of an oxidizer and
a fuel. The first substance must be rich in Oxygen
and the second one must be able to react very fast so
that it changes and multiplies its volume (Australian
Explosives Manufacturers Safety Committee Report,
1999). Nowadays, there is a need to develop new
efficient methods able of sensitive and selective
detection of such chemicals during transportation or
storing by terrorists. The fight against the increased
realization of modern bombs for criminal use is
approached by developing fast real-time easy-to-use
methods for the detection of IED precursors such as
Infrared Laser Photo-acoustic Spectroscopy (IR-
LPAS). IR-LPAS already demonstrated to be
promising in the design of an integrated optical
system for the real time detection and identification
of explosive species in traces to support homeland
security (Chaudhary at al. 2006, Giubileo et al.
2010, Giubileo et al 2012, Puiu at al. 2012).
Table 1: Chemicals used as precursors of IEDs. (Rostberg,
2005, Singapore Police Force 2007).
Acetone Hydrogen peroxide Potassium sulfate
Ammonium
nitrate
Hexamine
Potassium
perchlorate
Ammonium
perchlorate
Magnesium sulfate Sodium chlorate
Barium nitrate Nitric acid Sodium nitrate
Citric acid Nitromethane Sulphuric acid
Guanidine
nitrate
Potassium chlorate
Hydrochloric
acid
Urea Potassium nitrate
In this paper we report the LPAS analysis of a
number of common chemicals used as IED
precursors: potassium sulfate, potassium nitrate,
26
Puiu A., Giubileo G. and Palucci A..
Spectroscopic Study of Some IED’s Precursors by Means of Laser Photoacoustic Spectroscopy Combined with Multivariate Analysis.
DOI: 10.5220/0005335500260030
In Proceedings of the 3rd International Conference on Photonics, Optics and Laser Technology (PHOTOPTICS-2015), pages 26-30
ISBN: 978-989-758-092-5
Copyright
c
2015 SCITEPRESS (Science and Technology Publications, Lda.)
magnesium sulfate, ammonium perchlorate,
ammonium nitrate, and acetone. The analyzed
chemical species were classified by Principal
Component Analysis (PCA) applied to the collected
IR spectral data, which facilitate the recognition
capability of the adopted method.
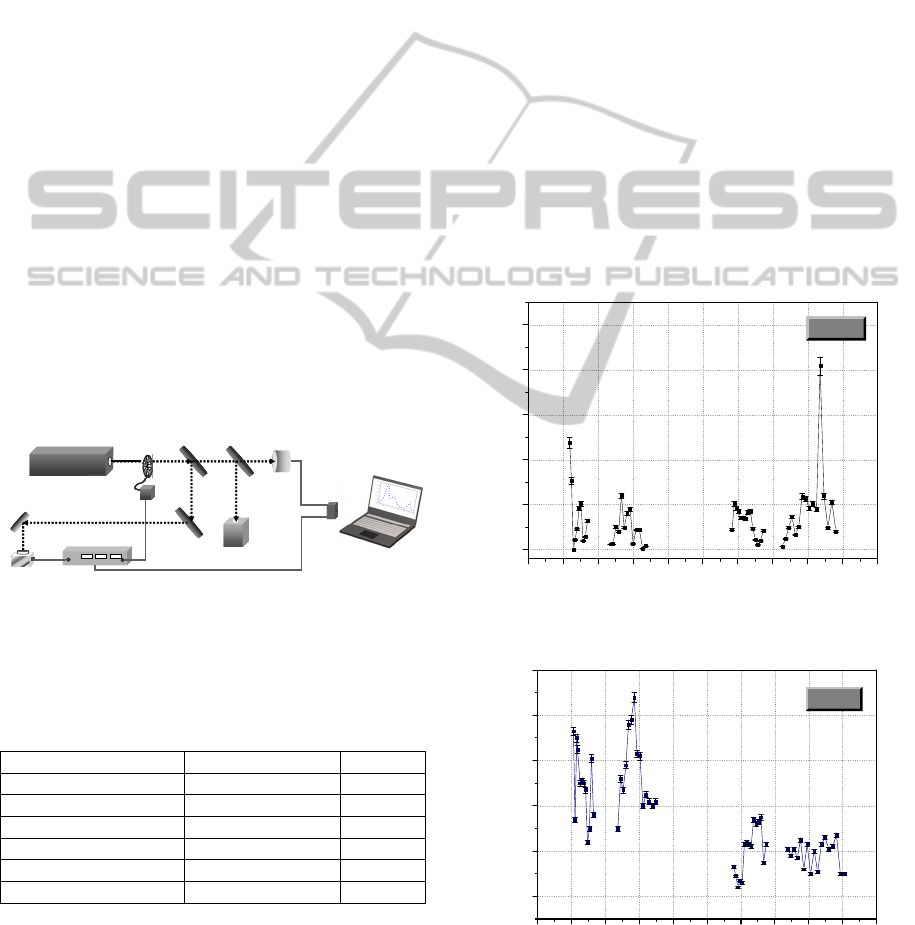
2 MATERIALS AND METHODS
The experimental work was performed by using a
home-made LPAS apparatus equipped with a line
tuneable 10 Watts Continuous Wave stabilized CO
2
laser source and with a home-made 3cc
photoacoustic (PA) cell. System control and Data
acquisition are achieved through a specialized card,
IEEE488.2 - GPIB National Instruments, with signal
processed by a lock-in amplifier, SR830 Stanford
Research Systems, in a LabView environment. A
schematic of the LPAS apparatus is shown in
Figure1. More details on the Photoacoustic facility
were reported in a previous paper (Giubileo et al.
2010). The PA signal produced by a few hundreds of
μg/cm
2
of each chemical was filtered by a low pass
pre-amplifier and selectively amplified by a lock-in
amplifier. The background signal was negligible
when compared to the sample signal.
Figure1: Schematic of the LPAS set-up.
The list of chemical substances considered in the
present experimental work is reported in Table 2.
Table 2: List of LPAS analyzed IED precursors.
Precursor Chemical formula m.p. (°C)
Acetone CH3-CO-CH
3
-95
Ammonium nitrate NH
4
NO
3
169
Ammonium perchlorate NH
4
ClO
4
200
Magnesium sulfate MgSO
4
1124
Potassium sulfate K
2
SO
4
1069
Potassium nitrate KNO
3
334
All the pure solid substances purchased from
Carlo Erba were analyzed without any pretreatment
in weighted amounts of 100 - 300 µg. The samples
were directly warmed by the incident laser beam so
that the PA signal was generated without previously
warm the sample to bring out vapours. Before each
measurement, the PA cell was shortly cleaned by
vacuum pumping.
3 RESULTS
The concept of LPAS recognition of IED precursors
has been demonstrated by performing measurements
on the selected set of chemicals reported in Table 2.
Examples of some IEDs PA spectra are shown in
Figures 2 to 5. The spectra were collected in the 9.2-
10.8 μm spectral range covered by the adopted laser
source. All the considered chemicals underwent the
same analytical procedure.
As it can be observed, characteristic absorption
peaks distribution was found in the investigated
spectral range for each analyzed sample. The error
bars in the graphs represent the standard deviation of
ten different PA signal acquisitions on the given
laser emission line.
Figure 2: Photoacoustic spectrum of acetone.
Figure 3: Photoacoustic spectrum of ammonium nitrate.
CO
2
laser
Chopper
Lock-in amplifier
PA cell
Al mirror
Cu mirror
Beam
splitter
Beam
splitter
Power-
meter
Spectrum analyzer
GPIB-USB
adapter
PC
CO
2
laser
Chopper
Lock-in amplifier
PA cell
Al mirror
Cu mirror
Beam
splitter
Beam
splitter
Power-
meter
Spectrum analyzer
GPIB-USB
adapter
PC
9,0 9,2 9,4 9,6 9,8 10,0 10,2 10,4 10,6 10,8 11,0
0,0
0,1
0,2
0,3
0,4
0,5
Wavelength [
μ
m]
PA signal [
μ
V/mW]
Acetone
9.0 9.2 9.4 9.6 9.8 10.0 10.2 10.4 10.6 10.8 11.0
0.02
0.04
0.06
0.08
0.10
0.12
PA signal [μV/mW]
Wavelength [μm]
NH
4
NO
3
SpectroscopicStudyofSomeIED'sPrecursorsbyMeansofLaserPhotoacousticSpectroscopyCombinedwithMultivariate
Analysis
27
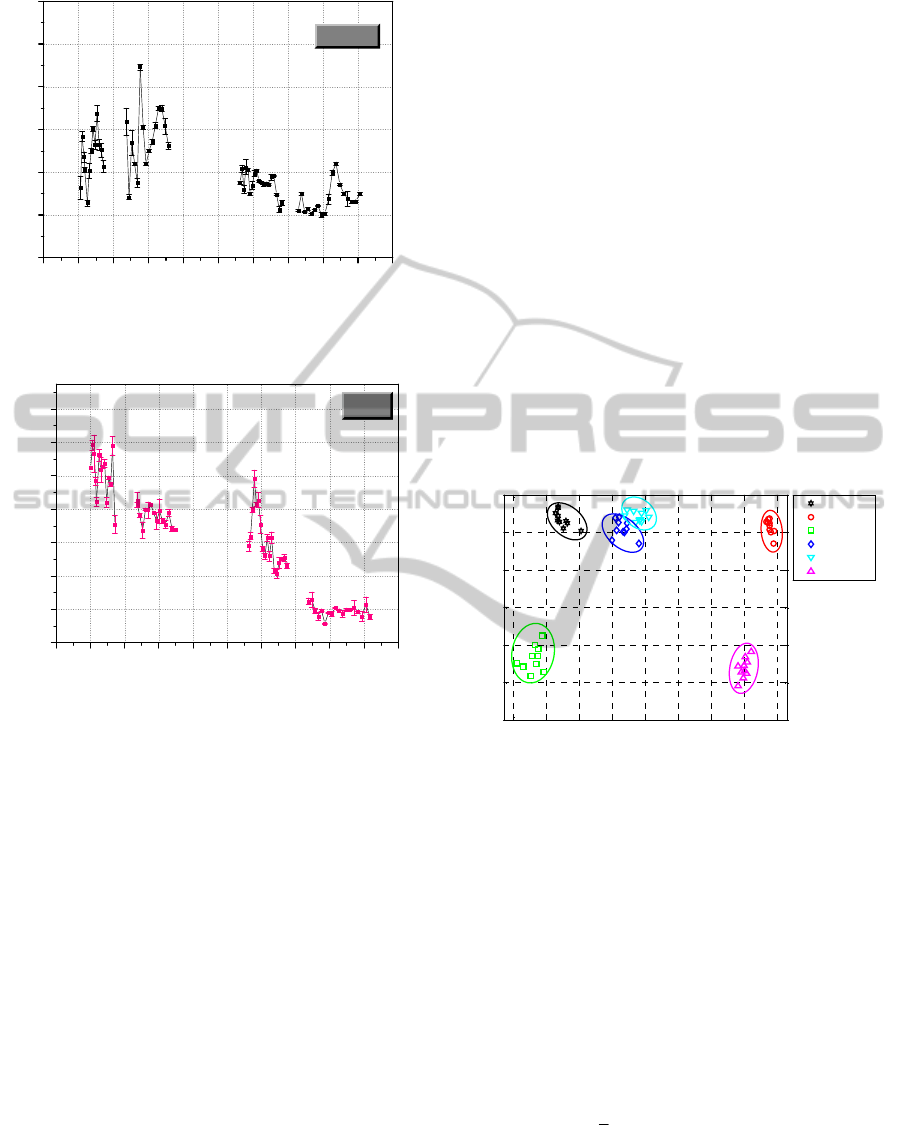
Figure 4: Photoacoustic spectrum of ammonium
perchlorate.
Figure 5: Photoacoustic spectrum of potassium sulfate.
The strong absorption band presented by
NH
4
ClO
4
(ammonium perchlorate) at 9 -10 μm
determines the relatively higher LPAS signals
recorded for this chemical in the mentioned interval.
For NH
4
NO
3
and K
2
SO
4
species, an increasing
LPAS signal going from 11μm toward 9μm was
recorded, as confirmed also by FTIR data in the
literature (Miller et al. 1952).
Despite the analyzed samples are inorganic
substances that do not possess the rich band
structure generally found for the organic species in
the fingerprint region (6-20µm), the high resolution
PA spectroscopy put in evidence different spectral
patterns characteristic for each substance in the
spectral interval covered by the CO
2
laser (9-11 µm),
even in the absence of specific absorption bands
ascribable to some roto-vibrational motions within
the molecule.
4 PRINCIPAL COMPONENT
ANALYSIS
From a first graphs examination it appears that the
spectral features of the analyzed substances are
sufficiently different from each other. Nevertheless,
a direct comparison of the collected spectra is quite
difficult in practice.
In order to achieve the unambiguous and rapid
recognition of trace explosive compounds, a
chemometric approach based on Principal
Component Analysis (PCA) was applied to the set of
experimental data. PCA gives valuable information
about the factors which mainly affect the spectral
variations among different analyzed samples.
The result of PCA treatment on the investigated
precursors is shown in Figure 6. Looking at the
graph it appears evident the discrimination
capability of the LPAS analysis coupled to the PCA
chemometric algorithm.
Figure 6: Graphical presentation of PC1 versus PC2
applied to photoacoustic spectra of different IED
precursors.
The infrared photoacoustic spectra were
previously normalized to the laser power, and then
to their maximum peak value. We recorded the PA
signal from 55 emission wavelengths of the CO
2
laser. Thus, by using a software developed in
MatLab environment, the PCA was applied to a data
matrix of 55 datapoints and 60 samples. On a data
matrix containing elements x
ik
, where index k is used
for the experimental measurements and index i for
the samples under study, the PCA model is
described by the equation (1):
=
+=−
N
j
jkjkikkij
ptexx
1
(1)
where the loadings p
jk
depend only on the
experimentally measured variables and the scores t
ij
only depend on the sample constituents; N is the
9.0 9.2 9.4 9.6 9.8 10.010.210.410.610.811.0
0.0
0.5
1.0
1.5
2.0
2.5
3.0
PA Signal [μV/mW]
Wavelength [μm]
NH
4
ClO
4
9.0 9.2 9.4 9.6 9.8 10.0 10.2 10.4 10.6 10.8 11.0
0.04
0.08
0.12
0.16
0.20
0.24
0.28
0.32
PA signal [μV/mW]
Wavelength [μm]
K
2
SO
4
-2 -1.5 -1 -0.5 0 0.5 1 1.5 2
-2
-1.5
-1
-0.5
0
0.5
1
Principal Component Analysis
PC1
PC2
K2SO4
KNO3
MgSO4
NH4NO3
NH4ClO4
acetone
-2 -1.5 -1 -0.5 0 0.5 1 1.5 2
-2
-1.5
-1
-0.5
0
0.5
1
Principal Component Analysis
PC1
PC2
K2SO4
KNO3
MgSO4
NH4NO3
NH4ClO4
acetone
PHOTOPTICS2015-InternationalConferenceonPhotonics,OpticsandLaserTechnology
28
number of significant components (Giubileo et al.
2012).
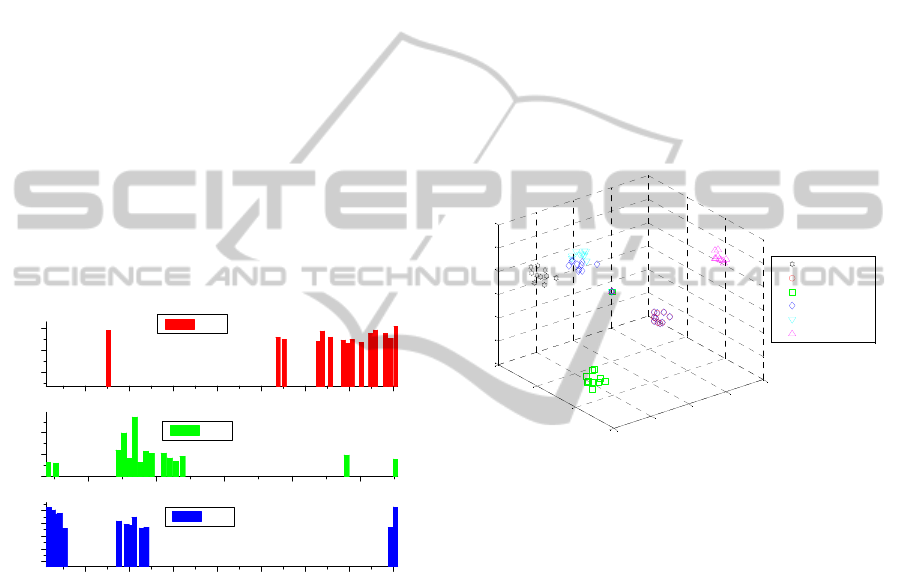
After performing the PCA resulted that the first
three principal components are explaining 78.3% of
the overall spectral variation. The corresponding
loading plots, which indicate the specific
contribution of each absorption line in the total
variance of the spectral data, are reported in the
Figure 7. The first principal component, PC1, which
accounts for the 42.8 % of spectral variance, has one
isolated peak around 9.5 µm that correspond to some
vibrations in the two nitro-compounds (NH
4
NO
3
and KNO
3
). Generally, the fingerprints of inorganic
compounds fall in the region 25 µm – 1 mm (400 –
10 cm
-1
) due to the presence of the lattice modes of
vibration which are characteristic of a specific
crystal geometry (Nyquist et al. 1997). These modes
result from the motion of one polyatomic group
relative to another within the unit cell. Thus, there
are no absorption peaks in the interval 9-11 µm
which can be ascribed to a specific mode of
vibration of some functional groups inside the
sample.
Figure 7: Loadings plots for the first three components.
In the second component, PC2, with an explained
spectral variance of 19.8 %, there is a wider band
centered around one isolated peak around 9.5 µm
that correspond to some vibrations in the NH
4
NO
3
,
NH
4
ClO
4
and KNO
3
.
The loading plot for PC3, which explains the
15.7 % of spectral variance, shows, besides the
peaks in position equivalent to those in the PC1 or
PC2, a strong band in the 9P branch of the CO
2
laser
emission wavelengths.
In general, a low number of PC able to explain
more than 60% of the spectral variances is correlated
with a large spectral difference among the samples.
Thus, in our case only two components can be
sufficient to describe the data set, as evidenced in
Figure 6, which shows the PCA plot for the PC1 and
PC2, the two largest principal components of the
dataset, which explain 62.6 % of the spectral
variance between the samples. In this plot each
sample is represented by a point, and the six groups,
each corresponding to a precursor substance, are
clearly separated.
In Figure 8 we report the 3D plot of PC1, PC2
and PC3 (78.3 % explained variance), which clearly
shows that each compound can be correctly grouped
with no misassignment. Therefore, the application of
PCA to the LPAS spectra expressed by 55 different
wavelengths allowed to reduce the output to only
three components. The score plots indicate that the
proposed model is able to correctly group the IED’s
precursors in spite of the oversimplification of LPAS
spectra.
Figure 8: PCA results in the 3D space generated by the
first three components (PC1, PC2, and PC3).
5 CONCLUSIONS
The concept of LPAS recognition of IED precursors
has been demonstrated by performing measurements
on the selected set of chemicals reported in Table 2.
PA spectroscopy put in evidence different spectral
patterns characteristic for each substance in the
spectral interval covered by the CO
2
laser.
Nevertheless, in order to simplify the daunting task
of substance identification, a multivariate statistical
analysis tool based on PCA was developed in
MatLab. In spite of the fact that inorganic
compounds identification by infrared spectroscopy is
considered somewhat less successful in the middle
infrared (MIR) region, the recognition ability of
MIR-LPAS technique coupled with a PCA data
treatment was demonstrated by the reported results.
Applying PCA to the LPAS spectra, it was found
that 78.3 % of the spectral variation was accounted
for by the first three principal components. This
9,4 9,6 9,8 10,0 10,2 10,4 10,6 10,8
-0,2
-0,1
0,0
0,1
0,2
9,4 9,6 9,8 10,0 10,2
0,0
0,1
0,2
9,4 9,6 9,8 10,0 10,2 10,4 10,6 10,8
-0,2
-0,1
0,0
loadings
Wavenumber [cm
-1
]
PC3
PC2
PC1
-2
-1
0
1
2
-2
-1
0
1
-1.5
-1
-0.5
0
0.5
1
1.5
PC1
PC2
PC3
K2SO4 - (1)
KNO3 - (2)
MgSO4 - (3)
NH4NO3 - (4)
ClO4NO4 - (5)
acetone - (6)
SpectroscopicStudyofSomeIED'sPrecursorsbyMeansofLaserPhotoacousticSpectroscopyCombinedwithMultivariate
Analysis
29

percentage obtained with only a few number of
components indicates a large spectral difference
among the samples. Even if no spectral features
attributable to specific vibrational modes of a certain
functional group are present in the LPAS spectra,
analysis of the score and loadings plot for these
components showed that the samples can be well
identified due to the presence of lattice modes of
vibration.
In conclusion, LPAS coupled with PCA could
provide an useful detection method to support the
fight to the increased realization of modern bombs
for criminal use. Moreover, an integration with
complementary methods such as Raman
spectroscopy may further increase the specificity of
detection, especially for the chemicals exhibiting
poor infrared absorption profiles.
ACKNOWLEDGEMENTS
The authors acknowledge the financial support of
the EU projects ISOTREX, BONAS and EDEN.
REFERENCES
Australian Explosives Manufacturers Safety Committee
Report,1999. Code of Good Practice, Precursors for
Explosives, 1
st
edition.
Chaudhary, A. K., Bhar, G. C. and. Das, S., 2006. Low-
limit photo-acoustic detection of solid RDX and TNT
explosives with carbon dioxide laser, Journal of
Applied Spectroscopy 73, 123-129.
Giubileo, G., Puiu, A., 2010. Photoacoustic Spectroscopy
of Standard Explosives in the MIR Region, Nucl.
Instrum. Methods A 623, 771-777.
Giubileo, G., Colao, F., and Puiu, A., 2012. Identification
of standard explosive traces by infrared laser
spectroscopy: PCA on LPAS data, Laser Physics 22,
1033-1037.
Miller, F. A. and Wilkins, C. H., 1952. Infrared spectra
and characteristic frequencies of inorganic ions,
Analytical Chemistry 24, 1253-1294.
Nyquist, R. A., Kael, R. O.,1997. Infrared Spectra of
Inorganic compounds, Vol. 4, Academic Press Inc.
Puiu, A., Giubileo, G., Nunziante Cesaro, S., 2012.
Vibrational spectrum of HMX at CO2 laser
wavelengths: a combined DRIFT and LPAS study,
International Journal of Spectroscopy, Article ID
953019, doi:10.1155/2012/953019.
Rostberg, James I., 2005. Naval Postgraduate School
Thesis, Common chemicals as precursors of
improvised explosive devices: the challenges of
defeating domestic terrorism, Monterey, California.
Singapore Police Force, June 2007. New Control
Measures, available at http://www.spf.gov.sg.
PHOTOPTICS2015-InternationalConferenceonPhotonics,OpticsandLaserTechnology
30
