
Mechanical Characterisation of the Four Most Used Coating
Materials for Optical Fibres
Yazmin Padilla Michel
1,3
, Massimiliano Lucci
2
, Mauro Casalboni
3
,
Patrick Steglich
1,3
and Sigurd Schrader
1
1
Faculty of Engineering and Natural Sciences, Technical University of Applied Sciences Wildau, Wildau, Germany
2
Dept. of Physics, University of Rome “Tor Vergata”, Rome, Italy
3
Dept. of Industrial Engineering, University of Rome “Tor Vergata”, Rome, Italy
Keywords: Fibre Optics, Coating Materials, Young’s Modulus, Nanoindentation, Attenuation.
Abstract: Optical multimode fibres have a wide variety of applications ranging from industrial to medical use.
Therefore, even if they are just used as waveguides or sensors, it is important to characterise the whole
fingerprint, including the optical and mechanical properties of such fibres. Since the stiffness/elasticity of a
material could influence the optical output of a fibre due to micro-bendings, in this paper we report the
calculated Young’s Modulus of acrylate, fluorinated acrylate, polyimide and silicone, which are the four
most used coating materials for such optical components. The results demonstrate that Young’s Modulus
does have an impact on the attenuation of propagating light along the optical fibre. However, the refractive
index of the coating materials still has a significant impact on the performance of optical fibres.
1 INTRODUCTION
There is a large list of publications from a diverse
scientific area, explaining the relation between
fibre’s throughput and its deformation, e.g. torsion,
strain and bending (Gambling, et al. 1978;
Murakami and Tsuchiya, 1978; Valiente and
Vassallo. 1989; Badar, et al. 1991; Badar and
Maclean, 1991; Boechat, et al. 1991; Renner, 1992;
Faustini and Martini, 1997; Durana, et al. 2003;
Wang, Farrell and Freir, 2005; Kovacevic and
Nikezic, et al. 2006; Wang, et al. 2007; for
mentioning some of them). Fibre characterisation in
the literature has been performed by only
considering the core and cladding of the optical
fibre, while the influence of the coating (i.e. the
protective third polymeric layer of optical fibres) on
the light transmission in the optical fibres has been
fully ignored.
With the increasing number of applications of
fibre-based devices in the chemical industry,
spectroscopy, and life sciences (where the NIR
spectrum is of high importance); besides the
constant emergence of new materials; the
mechanical and optical characterisation of coating
materials is of great importance and must be
included into the theoretical models.
In 2002 Corning Incorporated recognised the
lack of public information about their fibre coatings
and released in a white paper the Young’s Modulus
and performance of their UV-cured dual-layer
optical fibre coatings and its performance (Mitra,
Kouzmina and Lopez, 2010). In Padilla Michel, et al
(2012), it is proved that there is a strong dependency
between coating materials and the optical output of
multimode fibres (MMF) optimised for VIS-NIR
spectrum. In the same proceeding it is concluded
that, regardless of the bending diameter, the
refractive index of the fibre coating is a determining
factor for fibre throughput. Their results also show
that when the coating refractive index is higher than
that of the cladding, the attenuation increases
considerably, while it is negligible when it is lower.
From the experiment reported in the present
paper, we have obtained the Young’s Modulus (E
)
of the same four coating materials tested by Padilla
Michel, et al. (2012), which will be useful to
understand and develop more realistic fibre optics
models. Furthermore, we have proved that the E-
value of the coatings affects the performance of the
optical fibres. However, the refractive index is a
dominant parameter which determines the
throughput of a coated MMF.
96
Padilla Michel Y., Lucci M., Casalboni M., Steglich P. and Schrader S..
Mechanical Characterisation of the Four Most Used Coating Materials for Optical Fibres.
DOI: 10.5220/0005336700960102
In Proceedings of the 3rd International Conference on Photonics, Optics and Laser Technology (PHOTOPTICS-2015), pages 96-102
ISBN: 978-989-758-092-5
Copyright
c
2015 SCITEPRESS (Science and Technology Publications, Lda.)

2 MATERIALS AND METHODS
OF MEASUREMENT
For the present test, the following materials and
devices were used:
A Nanoindenter (NanoTest from Nano
Materials Ltd., Wrexham, UK) shown in
Figure 1.
5 fibre holders consisting of a 20 mm x
20 mm x 5 mm plate made of aluminium and
each of them has 5 grooves engraved (see
Figure 2).
Fast curing glue (cyanoacrylate).
5 aluminium posts (see Figure 1, right).
5 fibre samples of each material listed in
Table 1. The length of each fibre sample is
1 cm (total 25 fibres samples of 1 cm length).
Table 1: Fibre parameters provided by FibreTech GmbH
(Berlin, Germany). The material of the fibre’s core was
fused silica and that of the cladding was fluorinated fused
silica. The refractive indices of the preform were given by
the manufacturer (Heraeus Suprasil
®
) at λ=600 nm.
Coating
Materials
Core
(n
1
)
Clad
(n
2
)
Coating
(n
3
)
Core/Clad/Coating
outer diameters
[μm]
Single-coated
acrylate
1.458 1.442 1.49 200/240/380
Double-coated
acrylate
1.458 1.442
1.505 (I)
1.541 (II)
200/240/375
Fluorinated
acrylate
1.458 1.442 1.414 200/240/350
Polyimide 1.458 1.442 1.7 200/240/264
Silicone 1.458 1.442 1.409 200/240/306
Considering that the thickness of the studied
coatings in this paper range from 12 µm to 70 µm
and that the materials are elastic (E in the order of
MPa for polymers) compared to the cladding (71.7
GPa) the measurement of E was not straightforward
and several parameters had to be considered.
For the indenter, a Berkovich tip, i.e. a
three-sided diamond, was used. Thermal effects
were minimised using a temperature controller set at
23 °C. The Nanoindenter was mounted on an
anti-vibrational table to minimize the disturbances.
In Olson (2002), it is shown that the lower the E-
values to be measured, the greater the contact depth
should be. Hence for materials where E is in the
order of MPa, the indent should have at least 1 µm
of depth to consider the measurement to be accurate.
Also considering all the errors and trials reported in
Olson (2002), and the dimensions of the outer
diameter of our samples, we decided not to polish
the coatings (i.e. the side-polishing of the fibres), to
keep the coating surface as smooth and uniform as
possible.
Figure 1: On the left, a schematic showing the main
components of the Nanoindenter (the schematic was taken
from the NanoTest specifications brochure). On the right,
a picture of the machine with a mounted sample is shown.
Batches of five fibres of the same coating were
glued onto an aluminium plate (see Figure 2) using a
minimum amount of cyanoacrylate. Once the sample
was mounted on the XYZ-stage of the nanoindenter
(see Figure 1), it is important to carefully select the
area to be used for indentation, which for our
experiment is an array of 3x10 indents. The indents
were made very close to each other (separation of 15
µm), so that, the entire array was clearly focused
with the microscope. Thus, we minimise
miscalculations of the maximum depth of the
indents.
Figure 2: Schematic of the aluminium plate used for
holding the fibres and a cross-section of an optical fibre
mounted on a groove. The indentation area is on top of the
fibre centre.
After choosing the area for indentation, the
machine creates a “Contact Compliance vs Voltage”
curve to show where the inflexion point occurs. This
is an important parameter because it is taken as the
zero-point to measure the indent depth and calculate
its contact area. From the accuracy of this
measurement depends the over- or underestimation
of E. The measurements were repeated two or three
times and a total of 330 indents were done on the
samples mentioned in Table 1.
MechanicalCharacterisationoftheFourMostUsedCoatingMaterialsforOpticalFibres
97

2.1 Available Public Data
As mentioned in section 1, there are few
publications regarding E of the fibre’s coating
materials. Some available public data for acrylate
coatings are listed in Table 2. These data were used
as reference to verify the validity of our results.
Table 2: Published E-values of acrylate coatings.
Author
Young’s Modulus of double and single
coated acrylate [MPa]
Outer
Coating
Inner
Coating
Single
Coating
Mitra, et al. (2010) 650 – 950 1 – 1.7 ~ 1500
Olson (2002) 763 – 1043 3.29 – 5.06 36.8 – 60.4
3 ANALYSIS AND RESULTS
Every time a measurement is finished, the software
of the Nanoindenter (NanoTest NT1) shows an
indentation review with a “Load vs Depth” curve
together with the calculated Reduced Modulus (E
r
)
and other parameters such as Hardness (H), Elastic
Recovery, Contact Compliance and the respective
statistical errors.
The parameters H and E
r
are calculated from the
tangents slope of the resulting unloading curve. The
following equation development is taken from Olson
(2002). On one hand, H is defined as: H=P/A
r
,
where P is the Maximum Load and A
r
is the
Residual Indentation Area. For our measurements,
P=5±0.2 mN was used. On the other hand, the
quantity E
r
relates the E-values of the indenter and
the sample as follows:
1
1
(1)
where ν is the Poisson’s Ratio, E
s
and E
i
are the E-
values of the sample and indenter, respectively.
From equation 1 we isolate E
s
, as follows:
1
1
(2)
The ν-values range normally between 0 and 0.50
(for majority of materials), being 0.50 the value for
perfectly elastic materials such as rubber, hence we
have taken ν=0.50 for silicone coating. The ν-values
of single coating acrylate (ν=0.49) and double
coating acrylate (ν=0.44) are taken by averaging the
values from Olson (2002). The value ν=0.34 of
polyimide was provided by the manufacturer
DuPont™. For fluorinated acrylate the used value is
ν=0.37. This procedure is to extrapolate E from E
r
.
Finally, from equation 2, we obtained the final E
s
of each material as shown in the following
subsections.
3.1 Double-coated Acrylate
Double coated acrylate coating is a typical UV-cured
dual layer of urethane-acrylate oligomers consisting
of a very elastic inner acrylate and a second outer
layer of stiffer acrylate (see Table 2). Since we have
not polished the coatings, only the E
r
of the outer
coating was measured. As shown in table 1, the fibre
manufacturer has provided only the specification of
the outer diameter of the fibre, while there is no
information about the inner coating diameter being
provided. Therefore we have made the very
superficial indents of approximately 1 µm of depth,
assuming that the outer coating thickness is much
thicker than 1 µm.
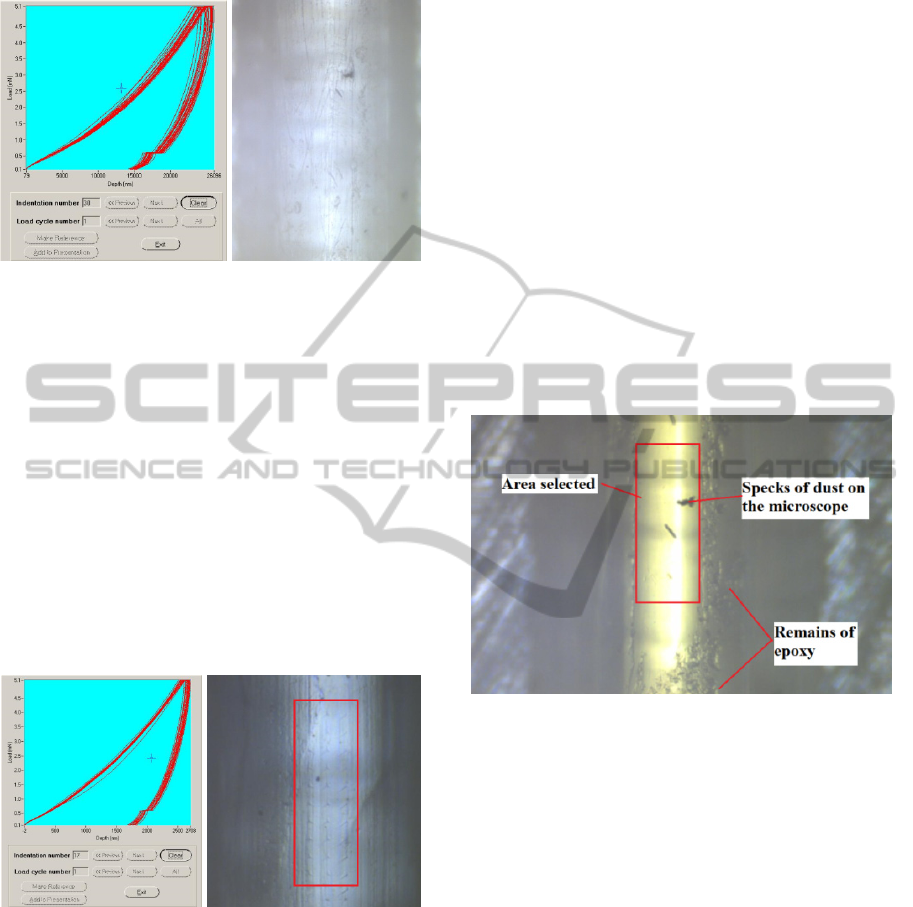
Figure 3: On the left, snapshot of the 20 best loading
curves. On the right, a picture of the area selected after
indentation, the material is so elastic that the indents are
not visible.
Figure 3 shows the results of the best
nanoindentations made on this coating. We
discarded those curves affected by error, i.e.
scratches or contaminants on the surface. The
average of the 20 selected curves (Figure 3, left) is
E
r
=2572±57 MPa and the average Maximum Depth
(MD) is 1507±27 nm, these values are comparable to
that given in Table 2. Substituting this value into
equation 2 we obtained E
s
=2079 MPa for the outer
acrylate coating.
3.2 Single-coated Acrylate
Single-coated acrylate is an epoxy acrylate (2-
phenoxyethyl acrylate), which is less stiff than the
outer coating acrylate mentioned in section 3.1, but
it must be approximately ten times stiffer than the
inner coating acrylate (based on Table 2). As well as
with the double coated acrylate, we have carried out
three series of measurements to ensure the
PHOTOPTICS2015-InternationalConferenceonPhotonics,OpticsandLaserTechnology
98
repeatability of our measurements.
Figure 4: On the left, snapshot of the 30 best loading
curves. On the right, a picture of the area selected after
nanoindentation, where indents are not visible.
The calculated E
r
of the curves on Figure 4 is
9±1 MPa at a MD of 25455±548 nm. Substituting
this value into equation 2 we obtain E
s
=7 MPa for
the single-coated acrylate.
3.3 Fluorinated Acrylate
Fluorinated acrylate is a fluorinated diacrylate
oligomer, which can be used either for coating or
cladding material of an optical fibre. This coating is
normally used for guiding high power lasers, and is
the only one compatible for medical applications,
according to the United States Pharmacopeia (USP).
Figure 5: On the left, snapshot of the 17 best loading
curves. On the right, a picture of the area selected after
nanoindentation.
In Figure 5 (right) we can see the indents, which
are tiny triangles inside the red rectangle. The fact
that the indentations could be marked, might
indicate that this material is less elastic than the
other two acrylates mentioned in sections 3.1 and
3.2; however the result does not confirm this
hypothesis.
In Figure 5 (left) the 17 best loading curves of
this material are presented. The calculated E
r
is
929±17 MPa at a MD of 2665±30 nm. By
substituting this E
r
value into equation 2 we obtain
E
s
=803 MPa for the fluorinated acrylate.
3.4 Polyimide
Polyimide (n-methyl-2-pyrrolidone) is a heat-cured
coating, unlike the acrylates which are UV-curing.
Since the heat temperature used for curing can vary,
any difference could change the mechanical/optical
properties of the cured coating; hence the final
product can be different from manufacturer to
manufacturer. As an example, the polyimide-coated
fibres from FiberTech GmbH (like our sample) have
a brilliant golden colour (see Figure 6). On the other
hand, the polyimide coating from Polymicro
Technologies™ has a toasted brown colour, and the
refractive index is 1.78. Therefore, the E
r
for this
coating is expected to be different.
Figure 6: Picture of the selected area for indentation of the
polyimide-coated fibre under test.
Noteworthy is that, even if this was the stiffest
material, curiously there were no visible indents
after the measurement.
Since polyimide coatings are usually thin (our
sample has 12 µm of thickness) and it is expected to
be the stiffest one, we made a shallower
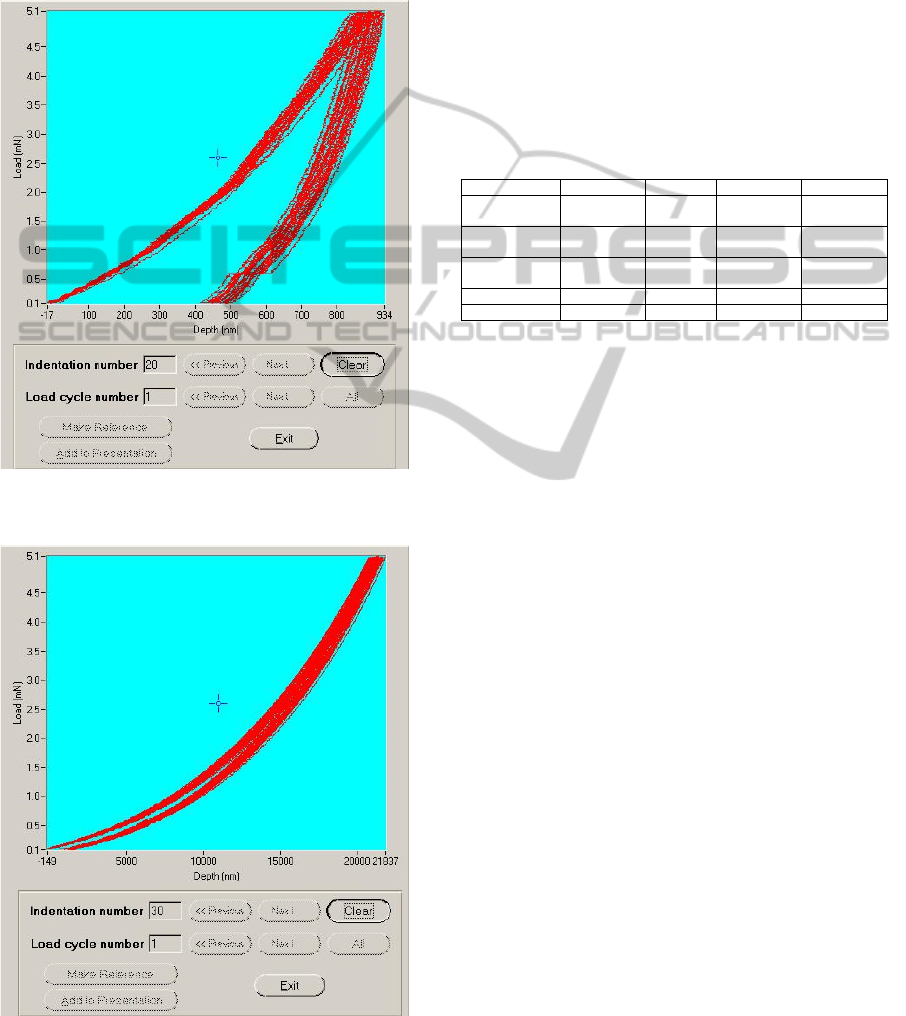
nanoindentation with a MD=901±22 nm. In figure 7
the 20 best loading curves are shown with an
average E
r
=5470±205 MPa. Finally, from equation 2
we obtain E
s
=4861 MPa. This confirms that
polyimide is the stiffest coating material that was
tested in our experiments.
3.5 Silicone
Polydimethylsiloxane, also known as silicone, is a
very rubberlike material. Hence, the resulting
loading/unloading curve had a very small depth
difference (see Figure 8), contrary to the curves of
MechanicalCharacterisationoftheFourMostUsedCoatingMaterialsforOpticalFibres
99
the previous materials. In Figure 8, the 30 best
indents obtained from this material are shown. The
curves are together in a very well-defined group.
Since it is the most elastic coating among the all
mentioned materials in this paper; we increased the
depth of the nanoindentation to MD=21248±270 nm
and the average E
r
was 7 MPa.
Figure 7: The best 20 loading curves of polyimide coating
are shown.
Figure 8: The best 30 loading curves obtained from
silicone coating.
Finally, the obtained E
s
is 5 MPa, which is
surprisingly similar to that of the single-coated
acrylate, even if it feels gummy to the touch.
3.6 Comparing All Coatings
Table 3 presents a comparison between the best
results obtained from each coating. We have
confirmed that polyimide is the stiffest material of
the all tested materials while silicone is the most
elastic one. There are differences between the
existing data (Table 2) and our results (Table 3).
Table 3: Comparative table of the best results obtained
from Load/Unload curves and equation 2.
Material MD [nm] H [MPa] E
r
[MPa] E [MPa]
Double-coated
acrylate
1507±27 123±5 2572±57 2079±46
Single-coated
acrylate
25455±548 0.44±0.0 8.80±1.00 6.70±0.70
Fluorinated
acrylate
2665±30 37.7±1.0 929±17 803±15
Polyimide 901±22 393±24 5470±205 4861±182
Silicone 21248±270 1.1±0.01 6.60±0.01 4.90±0.01
For example, E of the double-coated acrylate
turns out to be twice than the reported value and the
single coating acrylate is five times lower than the
reported one. However, considering the high
sensitivity of the Nanoindenter, the limitations of the
method for measuring elastic materials of the order
of MPa (see section 2), and curing variations
between manufacturers (see section 3.4); the
agreement can be considered good and, therefore,
the measurements are reliable.
As mentioned in section 1, the purpose of this
experiment is to find out how the E-value and the
attenuation are related. Therefore, we have taken the
attenuation data from Padilla Michel, et al. (2012)
and our data from Table 3, the resulting graph is
shown in Figure 9. In agreement with
Padilla Michel, et al. (2012), we have noticed a
considerable difference between when the coating
refractive index is higher and lower than that of the
cladding, which forms two groups.
In order to see clearly how E, refractive index
and attenuation are related, in Figure 10 we present a
graph of the coatings refractive indices as a function
of the attenuation. In both graphs (Figures 9 and 10)
the group of the higher refractive index (right side)
and the group of lower refractive index (left side) are
marked. Although, for the group with lower
refractive index, E does not influences the
attenuation, for the group with higher refractive
index, it is observed that the higher value of E, leads
to the lower attenuation value. This is completely
contrary to our expectations.
PHOTOPTICS2015-InternationalConferenceonPhotonics,OpticsandLaserTechnology
100
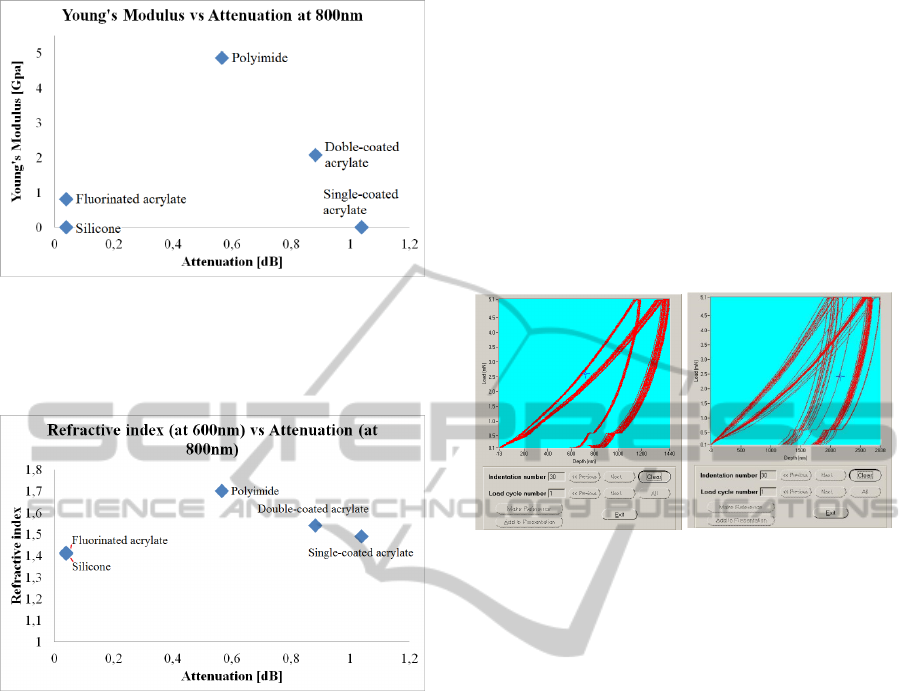
Figure 9: Resulting E of the five coatings tested in this
experiment, compared with the attenuation values of
Padilla Michel, et al. (2012). The error bars are too small
(see Table 3) to be visible in the graph. Plotting E
r
instead
of E does not change the trend of the graph.
Figure 10: Refractive index versus attenuation. The data
were obtained from Padilla Michel, et al. (2012).
Figures 9 and 10 suggest that there are other side
effects produced by coating elasticity. Analysing Fig
10, indicates that when the coating material, like
acrylate, has a high refractive index value, and a low
value of E, micro-bendings are produced in the
cladding-coating interface leading to an increase in
the attenuation (private communication with Dr.
Roberto Montanari) while the fibre is bent as
reported in Padilla Michel, et al (2012).
4 DISCUSSION
The loading curves selected to obtain the E
r
reported
in Table 3, were those forming a well-defined group.
However, in some cases the loading curves from
different series of nanoindentation had a
considerable difference, even if the same procedure
was followed (see Figure 11). These curves were
discarded for the calculation of Er and the
measurements were repeated. There are different
factors that could contribute to these differences:
The coating area used for indentation, was not
perfectly homogenous.
The 3x10 array of indents could have been
made off-side the fibre centre.
Since the cyanoacrylate used for gluing the
fibres and the coatings, both, are translucent; it
might be that some indentations were made on
an area with debris of glue, which could not
be noticed at the moment of selecting the area
for indentation.
Figure 11: On the left, loading curves of double coating
acrylate, showing a group of 10 indents dispersed from the
other group. On the right, loading curves of fluorinated
acrylate, showing some dispersed curves, as well.
As mentioned in section 3.6, since the micro-
bendings produced in the cladding-coating interface
increase the attenuation, this parameter should be
considered carefully in the case of acrylate.
Therefore an alternative method should be used in
order to calculate the attenuation without micro-
bending losses. As a good alternative we may feed
the optical fibres directly through the cladding, thus
some cladding modes will interact with the coating
without bending the fibre. This will be the next test
to corroborate our results and hypothesis.
5 CONCLUSIONS
In this paper, we presented the Young’s Modulus of
the four most used coating materials for NIR fibres.
As mentioned above, these mechanical properties
are seldom published by the manufacturers;
therefore, these results are helpful for a better
understanding of the optical fibres performance.
The principle of a waveguide is that the
surrounding media (in this case the cladding) must
have a refractive index lower than that of the
waveguide core in order to keep the modes within it.
However, when a waveguide is bent the high order
MechanicalCharacterisationoftheFourMostUsedCoatingMaterialsforOpticalFibres
101

modes leak into the cladding producing the so-called
bending losses. Like explained in Padilla Michel, et
al (2012), when the refractive index of the coatings
is lower than that of the cladding, the leaky modes
go back to the core, due to refractive index
differences between layers; therefore, the fibre
seems to be insensitive to bending losses
independently of the E of the coating. However,
when the coating refractive index is higher than that
of the cladding, the leaky modes are trapped in the
coating producing a fibre which is very sensitive to
bending losses. In this condition, the E of the coating
plays an important role in the so-called bending
losses.
ACKNOWLEDGEMENTS
The authors would like to thank the AiF Projekt
GmbH (project number KF2014158NT3), the
Interne ZV-Cooperation Rome project, for the funds
granted, and Dr. Mohamad Zoheidi for providing the
fibre samples.
REFERENCES
Badar, A. H., Maclean, T. S. M., Ghafouri-Siraz, H.,
Gazey, B. K., 1991. Bent slab ray theory for power
distribution in core and cladding of bent multimode
optical fibres. IEE Proceedongs-J.
Badar, A. H., Maclean, T. S. M., 1991. Transition and
pure bending losses in multimode and single-mode
bent optical fibers. IEE Proceedings-J.
Boechat, A. A. P, Su, D., Hal, D. R., Jones, J. D. C., 1991.
Bending loss in large core multimode optical fiber
beam delivery systems. Appl. Opt.
Durana, G., Zubia, J., Arrue, J., Aldabaldetreku, G.,
Mateo, J., 2003. Dependence of bending losses on
cladding thickness in plastic optical fibers. Appl. Opt.
Faustini, L., Martini, G., 1997. Bend loss in single-mode
fibers. IEEE Journal of Lightwave Technology.
Gambling, W. A., Matsumura, H., Ragdale, C. M.,
Sammut, R. A., 1978. Measurement of radiation loss
in curved single-mode fibres. Microwaves optics and
acoustics.
Kovacevic, M. S., Nikezic, D., 2006. Influence of bending
on power distribution in step-index plastic optical
fibers and the calculation of bending loss. Appl. Opt.
Mitra, A., Kouzmina, I., Lopez, M., 2010. Thermal
stability of the CPC Fiber Coating System. Corning
Incorporated, WP4250.
Murakami, Y., Tsuchiya, H., 1978. Bending losses of
coated single-mode optical fibres. IEEE Journal of
Quantum Electronics.
Olson, H. G., 2002. Mechanical and Optical Behaviour of
A Novel Optical Fibre Crack Sensor and An
Interferometric Strain Sensor. PhD Thesis submitted
at the Massachusetts Institute of Technology.
Padilla Michel, Y., Zoheidi, M., Haynes, R., Olaya, J-C.,
2012. Applied stress on coated multimode optical
fibres: a different point of view to bending losses”.
Proc. SPIE 8450, Modern Technologies in Space- and
Ground-based Telescopes and Instrumentation II,
84503F.
Renner, H., 1992. Bending losses of coated single-mode
fibers: A simple approach. IEEE Journal of Lightwave
Technology.
Valiente, I., Vasallo, C., 1989. New formalism for bending
losses in coated single-mode optical fibres. Electronics
Letters.
Wang, Q., Farrell, G., Freir, T., 2005. Theoretical and
experimental investigations of macro-bend losses for
standard single mode fibers. Optics Express.
Wang, Q., Rajan, G., Wang, P., Farrell, G., 2007.
Polarization dependence of bend loss for a standard
single-mode fiber. Optics Express.
PHOTOPTICS2015-InternationalConferenceonPhotonics,OpticsandLaserTechnology
102
