
Curvature-based Human Body Parts Segmentation in Physiotherapy
Francis Deboeverie
1
, Roeland De Geest
2
, Tinne Tuytelaars
2
, Peter Veelaert
1
and Wilfried Philips
1
1
Department of Telecommunications and Information Processing, Image Processing and Interpretation, UGent/iMinds,
St-Pietersnieuwstraat 41, 9000 Ghent, Belgium
2
ESAT-PSI, Processing Speech and Images, KU Leuven/iMinds, Kasteelpark Arenberg 10, 3001 Leuven, Belgium
Keywords:
Image Segmentation, Human Body Parts Segmentation, Human Body Skeleton Reconstruction.
Abstract:
Analysing human sports activity in computer vision requires reliable segmentation of the human body into
meaningful parts, such as arms, torso and legs. Therefore, we present a novel strategy for human body seg-
mentation. Firstly, greyscale images of human bodies are divided into smooth intensity patches with an adap-
tive region growing algorithm based on low-degree polynomial fitting. Then, the key idea in this paper is that
human body parts are approximated by nearly cylindrical surfaces, of which the axes of minimum curvature
accurately reconstruct the human body skeleton. Next, human body segmentation is qualitatively evaluated
with a line segment distance between reconstructed human body skeletons and ground truth skeletons. When
compared with human body parts segmentations based on mean shift, normalized cuts and watersheds, the
proposed method achieves more accurate segmentations and better reconstructions of human body skeletons.
1 INTRODUCTION
Human body segmentation divides images of human
bodies into segments that coincide as well as possi-
ble with meaningful parts of the human body, like
torso, arms or legs. Segmenting human body im-
ages is a first step to computer vision-based analysis
of human movements patterns (Poppe, 2007; Aggar-
wal and Ryoo, 2011; Guo and Lai, 2014). Further-
more, it facilitates many useful applications such as
surveillance, human action understanding, pose clas-
sification, etc. (Juang et al., 2009; Liang et al., 2009;
Hou and Pang, 2011; Xiao et al., 2014). Reliable seg-
mentation leads to good qualitative movement analy-
sis, for instance in physiotherapy. Movement analy-
sis helps athletes, for instance gymnasts, to improve
their performance and to reduce the risk of injury
(Bartlett, 2007). Analysis of human movements is of-
ten performed by finding human body configurations
in human body skeleton reconstructions (Mori et al.,
2004). However, in order to accurately reconstruct
these human body skeletons, human body parts seg-
mentation is still challenging.
In this work, greyscale images of human bodies
are segmented into smooth surface segments (inten-
sity patches) and then approximated with maps of
polynomial surfaces. The main novelty in this paper
is that we show that human body parts are approx-
imated by nearly cylindrical surfaces, of which the
axes of minimum curvature accurately reconstruct the
human body skeleton. For the reconstructed human
body skeleton, the branches generally coincide with
the real human body bones, because the cylindrical
surfaces have the same shape as the limbs.
To find surface segments that are folded in a
certain way, we use a curvature-based segmenta-
tion algorithm (Deboeverie et al., 2013) that divides
greyscale images with adaptive region growing based
on low-degree polynomial fitting. Adaptive refers to
the use of a local neighbourhood to add pixels, while
adapting the shape (or degree) of the function is based
on global behaviour. In this sense there is some local
flexibility, while the global behaviour is determined
by a more straightforward characterization, such as
being concave or convex. The curvature point of
view approach is based on the property that, because
of Lambert’s cosine law (Lambert, 1760), when the
light comes mainly from one direction, the intensity
surface of an image has the same shape as the ob-
ject surface itself. For instance, human skin is such
a diffusely reflecting surface. Then, a human body,
which resembles a convex sphere with small concav-
ities, will be seen as a collection of intensity patches
of concave functions, and smaller patches of convex
functions (Wagemans et al., 2010).
We extensively evaluate human body segmenta-
630
Deboeverie F., De Geest R., Tuytelaars T., Veelaert P. and Philips W..
Curvature-based Human Body Parts Segmentation in Physiotherapy.
DOI: 10.5220/0005338906300637
In Proceedings of the 10th International Conference on Computer Vision Theory and Applications (VISAPP-2015), pages 630-637
ISBN: 978-989-758-089-5
Copyright
c
2015 SCITEPRESS (Science and Technology Publications, Lda.)

tion on images of an athlete performing different exer-
cises. As a measure for segmentation quality, we ex-
amine a line segment distance (Gao and Leung, 2002)
between human body skeleton reconstructions and
ground truth skeletons. Considering this quality mea-
sure, we find that the proposed segmentation outper-
forms human body segmentation techniques based on
mean shift (Comaniciu and Meer, 2002; Porikli and
Tuzel, 2003), segmentations based on normalizedcuts
(Shi and Malik, 2000; Li et al., 2011) and segmenta-
tions based on marker-controlled watersheds (Vincent
and Soille, 1991; Park et al., 1999).
Many methods related to the segmentation of a hu-
man body into its different parts have been proposed
by researchers. The most recent papers consider hu-
man body segmentation in videos (Juang et al., 2009;
Hsieh et al., 2010; Liu et al., 2011; Shao et al.,
2012) as well as in static images (Srinivasan and Shi,
2007; Barnard and Heikkila, 2008; Li et al., 2011; Li
et al., 2014). For videos, the methods are performed
on human bodies which are segmented by using a
background model and motion information, which
make them infeasible for static images. The methods
for static images are further classified into matching-
based (Mori and Malik, 2006), part-based (Mori et al.,
2004; Hu et al., 2006) and model-based (Lee and Co-
hen, 2006; Hu et al., 2009) methods. Matching-based
methods compare human body features (such as shape
contexts (Mori and Malik, 2006)) in a test image with
those in a large set of labelled images. Part-based ap-
proaches detect the candidates of each body part and
construct the best assembly according to some prede-
fined human body configuration constraints. Model-
based methods firstly generate a large number of hy-
potheses of human body configurations and then re-
cover the human body configuration by minimizing
the errors between the hypotheses and the image. Dif-
ferent from the methods in literature, the approach in
this work does not require a training test scheme or a
model hypothesis on the human body. Furthermore,
none of these techniques consider a segment curva-
ture approach for segmentation. As we will show in
the results, considering the curvature in the segmen-
tation process enhances the reconstruction of human
body skeletons.
The remainder of this paper is organized as fol-
lows. Section 2 describes the human body segmen-
tation algorithm, which is an adaptive region grow-
ing algorithm based on constructive polynomial sur-
face fitting. Section 3 describes how to classify hu-
man body segments based on the polynomial curva-
ture. Section 4 presents the results of human body
segmentation and classification. Finally, we conclude
our paper in Section 5.
2 HUMAN BODY PARTS
SEGMENTATION
Greyscale human body images are segmented with
curvature-based segmentation. Curvature-based seg-
mentation finds surface segments that are folded in
a certain way. Therefore, we study an adaptive fit-
ting technique for representing sets of image pixels
with geometric primitives. A geometric primitive is a
polynomial function describing the variation of grey
values in a region. The problem we study is that of
finding a region of maximal size in which grey values
can be well approximated by a polynomial function.
We also consider the related problem of finding the
best degree of the polynomial function.
To achieve above-mentioned purposes, we use an
adaptive region growing algorithm (Deboeverie et al.,
2013) based on constructive polynomial fitting (Vee-
laert, 1997; Veelaert and Teelen, 2006). Region grow-
ing is the process of examining neighbouringpixels of
initial seed pixels and determining whether the neigh-
boring pixels should be added to the region. Polyno-
mial fitting fits geometric primitives to pixels. This
primitive extraction algorithm determines subsets of
pixels that lie on a geometric primitive or close to it.
How well a subset corresponds to a primitive is quan-
tified by an L
∞
fitting cost (approximation error).
The algorithm finds regions of maximal size in
which a low-degree polynomial approximation us-
ing a specified L
∞
fitting cost criterion exists. Let
f(x
i
,y
i
) represent the image intensities. Let G be a
vector space of fitting functions, for instance, the vec-
tor space of bivariate polynomialfunctions of total de-
gree d:
g(x,y) =
d
∑
k=0
k
∑
l=0
α
l,k−l
x
l
y
k−l
, (1)
where each polynomial is characterized by n = (d +
1)(d + 2)/2 coefficients α
l,k−l
.
The accuracy of fitting g(x,y) over the segment S
is measured with the L
∞
fitting cost. This fitting cost
is defined as
r(S;g) = max
(x,y)∈S
|g(x,y) − f(x,y)|. (2)
The best fit is the polynomial function g(x,y) in G
for which r(S;g) is minimal. This minimal cost is
denoted as r(S), i.e,
r(S) = min
g∈G
r(S;g). (3)
L
∞
fitting costs are computed very efficiently by
constructive fitting (Veelaert, 1997; Veelaert and Tee-
len, 2006). The emphasis of constructive fitting is on
the calculation and estimation of the fitting cost from
Curvature-basedHumanBodyPartsSegmentationinPhysiotherapy
631

Start iteration
step of region
growing
Select new
pixel
Compute
fitting cost
Add pixel?
Adapt
degree?
Add pixel to
the segment
Adapt
polynomial
degree
End iteration
step of region
growing
yy
n
n
Local thresholding Global thresholding
Figure 1: Flow chart of one iteration step in our adaptive region growing. Two key phases are distinguished: the first
determines if a new pixel is to be added to a segment, while the second phase controls if the polynomial degree is adapted.
elemental subsets. Elemental subsets are the smallest
subsets that have a nontrivial fitting cost. Estimating
the fitting cost with elemental subsets boils down to
a sampling of the region. Sampling in this context
refers to measuring the fitting cost in only a few pix-
els of the region and then estimating the fitting cost of
the entire region based on these measurements. The
selection of elemental subsets in a region can be per-
formed locally as well as globally. A local elemental
subset is an elemental subset which has been selected
from the pixels in a small part of the region. Likewise,
a global elemental subset is an elemental subset which
has been selected from the pixels in the entire region.
From local and global elemental subsets we compute
so-called local and global fitting costs, respectively.
Local and global fitting costs are combined with a
strategy for image segmentation in a region growing
process with adaptive thresholding (Deboeverie et al.,
2013). Adaptive refers to the use of a local neigh-
bourhood to add pixels, while adapting the shape (or
degree) of the function is based on global behaviour.
In this sense there is some local flexibility, while the
global behaviour is determined by a more straightfor-
ward characterization, such as being concave or con-
vex. One iteration step of adaptive region growing
is visualised in the flowchart in Figure 1. Two key
phases are distinguished: the first determines if a new
pixel is to be added to a segment, while the second
phase controls if the polynomial degree is adapted.
Thresholding of the local behaviour X
k
of the fitting
costs controls if a new pixel p
k
is added to the seg-
ment S
k−1
= {p
0
, p
1
,..., p
k−1
}. This is when X
k
is
lower than the threshold T
X
. When X
k
exceeds T
X
,
i.e. when adding p
k
would increase the fitting cost
significantly more than on average, p
k
is not added
to S
k−1
. Thresholding of the global behaviour Y
k
of
the fitting costs controls if the polynomial degree is
adapted. The polynomial degree is increased by one,
when the global variation of grey values is becoming
too large. This is when Y
k
exceeds the threshold T
Y
.
Then, Y
k
is recomputed for this new degree. In fact,
the degree increases until either Y
k
is again within the
limit of the threshold T
Y
, or a maximum degree is ex-
ceeded. A maximal polynomial degree of two is suffi-
cient to expand the segment along smooth flat, planar,
convex, concave and saddle intensity functions.
From the segmentation it is known that each sur-
face segment can be approximated by a low-degree
polynomial surface as in Eq. 1. Then, the intensity
function of a segment is represented by its polyno-
mial coefficients. The coefficients are computed after
all segments have been found. A method for comput-
ing the best L
∞
fit is described in (Veelaert, 2012).
3 HUMAN BODY PARTS
CLASSIFICATION
This section describes how to classify human body
segments based on the curvatures of the approximat-
ing polynomial surfaces, in order to reconstruct the
human body skeleton.
Convex, concave or saddle like behaviour of a
second-degreepolynomial surface g(x,y) as in Eq. (1)
is defined by the signs of the eigenvalues of the Hes-
sian matrix:
H(g) =
∂
2
g
∂
2
x
∂
2
g
∂x∂y
∂
2
g
∂x∂y
∂
2
g
∂
2
y
. (4)
The entries of the matrix H(g) are the second order
derivatives of the surface with respect to x and y co-
ordinates. For a quadratic surface, the second deriva-
tives are constant and hence H(g) is independent of
the location of the pixel in the segment. From Eq. (1),
we find
H(g) =
2α
2,0
α
1,1
α
1,1
2α
0,2
. (5)
The maximum and minimum curvatures are deter-
mined by the eigenvalues of this matrix, which are
found by solving the following characteristic equa-
tion:
Hk = λk. (6)
The homogeneous system (H − λI)k = 0 has a non-
zero solution if the determinant of its coefficient ma-
trix is zero:
2α
2,0
− λ α
1,1
α
1,1
2α
0,2
− λ
= 0. (7)
The matrix H is symmetric, hence the solution yields
two real values λ
1
and λ
2
. Both λ
1
and λ
2
are posi-
tive for a convex surface and negative for a concave
VISAPP2015-InternationalConferenceonComputerVisionTheoryandApplications
632

surface. Eigenvalues have opposite signs for a saddle
surface. One of the eigenvalues is zero for a cylindri-
cal surface.
The product of the two eigenvalues gives the
Gaussian curvature G = λ
1
λ
2
. The Gaussian curva-
ture is an intrinsic measure of curvature, i.e., its value
depends only on how distances are measured on the
surface, not on the way it is isometrically embedded
in space. The Gaussian curvature is zero when one of
the eigenvalues is zero, which corresponds to a cylin-
drical surface, as when both are zero, which indicates
a plane.
The eigenvectors from the characteristic Eq. (7)
point to the direction of maximum and minimum cur-
vatures. The azimuth of maximum curvature θ is
given by
θ = arctan
k
11
k
12
, (8)
where k
11
and k
12
are components of the eigenvector
corresponding to the largest eigenvalue. The direction
of minimum curvature is orthogonal to the direction
of maximum curvature. In the results, we show that
the axes of minimum curvature reconstruct the human
body skeleton.
4 RESULTS
Experimental video data includes an athlete perform-
ing 10 different exercises. Figure 2 (a) shows a
greyscale human body image of the athlete with im-
age size 130x180. As usual in physiotherapy, the ath-
lete only wears short pants. The availability of a dif-
fuse reflecting skin surface makes these images very
suitable to test the segmentation method on. Ground
truth skeleton data of the human body is obtained
from markers which are labelled on the joints of the
athlete by physiotherapists. An example of a ground
truth skeleton is shown in Figure 2 (b). This ground
truth data is used to evaluate the method for human
body segmentation. Figure 2 (c) shows a first seg-
mentation result of a human body image. The im-
age is segmented into 40 surface segments. The blue,
green and red colours in the segmented image cor-
respond to zero, first and second degree polynomial
surfaces, respectively. We ascertain that many sur-
face segments correspond to meaningful parts of the
human body, such as the arms, the legs and the torso.
Figure 2 (d) shows the best fit polynomial surfaces
approximating the surface segments. The result is a
reconstructed image of the original image. The hu-
man body parts are nicely reconstructed from the low-
degree polynomial surfaces. An example of convex,
concave or saddle like behaviour is shown in Figure 2
Table 1: This table always shows the mean and standard de-
viation of the mean fitting cost and the number of surfaces,
respectively. Only very few surface segments are needed to
represent a human body image.
Performance statistics
image size 180x130
mean fitting cost 3.97 ± 0.42
#surfaces 17.83 ± 3.14
(e). The magenta, cyan and yellow colours corre-
spond to convex, concave and saddle like behaviour,
respectively. We find concave polynomial surfaces
for the arms, the legs and the torso. We experimen-
tally found that human body parts which are shad-
owed by other human body parts are often approxi-
mated by convex polynomial surfaces. Figure 2 ( f)
shows the axes of minimum curvature of the polyno-
mial surfaces. These axes go through the center points
of the segments. For the human body segments, these
axes coincide with the real human body bones. To-
gether, they form a reconstructed human body skele-
ton.
To find the optimal parameter set of adaptive re-
gion growing, we measure the image approximation
accuracy with a surface area weighted mean of the L
∞
fitting costs of the polynomial surfaces . A high ap-
proximation accuracy (low mean fitting cost) leads to
a high number of smaller segments, providing a good
approximation quality. On the other hand, a low ap-
proximation accuracy (high mean fitting cost) leads to
a low number of larger segments, providing approx-
imation quality less well. Depending on the desired
purpose (approximation or segmentation), one has to
find a good balance between the size of the segments
and the quality of the approximated images. For the
results in this work, we set the segmentation param-
eters T
X
= 0.8 and T
Y
= 4.8, preserving a good size
of the segments to perform analysis. These parame-
ters have been manually tuned on a small number of
images. When considering a set of 200 human body
images, Table 1 always shows the mean and standard
deviation of the mean fitting cost and the number of
surfaces, respectively. We find that adaptive region
growing divides a human body image in only very few
surface segments.
The graph in Figure 3 plots the numbers of sur-
face segments when segmenting human body images
in function of different mean fitting costs (4). We find
that for mean fitting costs above 5, which corresponds
to low reconstruction accuracies, the mean numbers
of surface segments remains more or less constant.
This means that there is a small stable set of large
segments. In contrast, for mean fitting costs below 5,
which corresponds to high reconstruction accuracies,
Curvature-basedHumanBodyPartsSegmentationinPhysiotherapy
633

(a) (b) (c) (d) (e) ( f)
Figure 2: (a): A greyscale human body image with image size 130x180. (b): The ground truth human body skeleton. (c):
The human body image is segmented into 40 surface segments. The blue, green and red colours in the segmented image
correspond to zero, first and second degree polynomial surfaces, respectively. (d): The surface reconstructed human body
image. (e): The convex, concave or saddle like behaviour of the polynomial surfaces, indicated by the colours magenta, cyan
and yellow, respectively. ( f): The axes of minimum curvature of the nearly cylindrical surfaces approximating the human
body parts.
0 5 10 15 20
0
20
40
60
80
100
mean fitting cost
#surfaces
mean fitting cost versus #surfaces
Figure 3: The numbers of surface segments of human body
images in function of mean fitting costs.
Figure 4: This figure shows the axes of minimum curvature
of the nearly cylindrical surfaces approximating the human
body parts. When matched to the ground truth skeleton, the
LSD is 3.90.
the mean number of surface segments growsexponen-
tially in function of the mean fitting cost. This means
that there are many small segments.
Figure 4 shows the axes of minimum curvature of
the second-degree polynomial surfaces approximat-
ing the human body parts in Figure 2 (e). For these
surfaces, Table 2 always shows the minimum and
maximum curvatures, the Gaussian curvatures (Sec-
tion 3) and the azimuths of minimum curvatures, re-
spectively. From these values, we conclude that the
polynomial surfaces approximating human body parts
are nearly cylindrical, since the Gaussian curvature is
zero when one of the eigenvalues is zero. The corre-
sponding axes of minimum curvature reconstruct the
human body skeleton. They coincide with the ground
truth human body skeleton in Figure 2 (b).
Table 2: This table always shows the minimum and maxi-
mum curvatures, the Gaussian curvatures and the azimuths
of minimum curvatures of the second-degree polynomial
surfaces approximating the human body parts in Fig. 2 (e).
λ
1
λ
2
G θ
lower leg -0.0063 -0.3668 0.0044 81
upper leg -0.0020 -0.1750 0.0004 -2
lower arm -0.0058 -2.0147 0.1907 -75
upper arm -0.0150 -0.1815 0.0076 -53
torso -0.0054 -0.1184 0.0007 -87
In order to qualitatively evaluate human body seg-
mentation, we match the reconstructed human body
skeleton to the ground truth skeleton data with a Line
Segment Distance (LSD) as proposed in (Gao and Le-
ung, 2002). The LSD is useful in skeleton match-
ing, because it encourages one-to-one mapping of
similar lines. Given two sets of line segments M =
{m
1
,m
2
,...,m
p
} and T = {t
1
,t
2
,...,t
q
}, the distance
between two line segments m
i
and t
j
is defined as
d(m
i
,t
j
) =
q
d
2
θ
(m
i
,t
j
) + d
2
k
(m
i
,t
j
) + d
2
⊥
(m
i
,t
j
) (9)
where d
θ
(m
i
,t
j
)is the orientation distance, d
k
(m
i
,t
j
)
is the parallel distance and d
⊥
(m
i
,t
j
) is the perpen-
dicular distance between m
i
and t
j
(Gao and Leung,
2002). The line segments m
i
and t
j
form a corre-
sponding pair if d(m
i
,t
j
) is a minimum over all com-
binations of t
j
. From the pairs of matching line seg-
ments, a length weighted matching cost C(M, T) is
computed:
C(M,T) =
1
∑
m
i
∈M
l
m
i
∑
m
i
∈M
l
m
i
min
t
j
∈T
d(m
i
,t
j
), (10)
where l
m
i
is the length of line segment m
i
. This
matching cost is used as a quality measure for human
body segmentation, where a lower LSD corresponds
to a better segmentation quality. For instance, match-
ing the axes in Figure 2 (f) to the ground truth skele-
ton in Figure 2 (b) results in a LSD of 3.90.
VISAPP2015-InternationalConferenceonComputerVisionTheoryandApplications
634
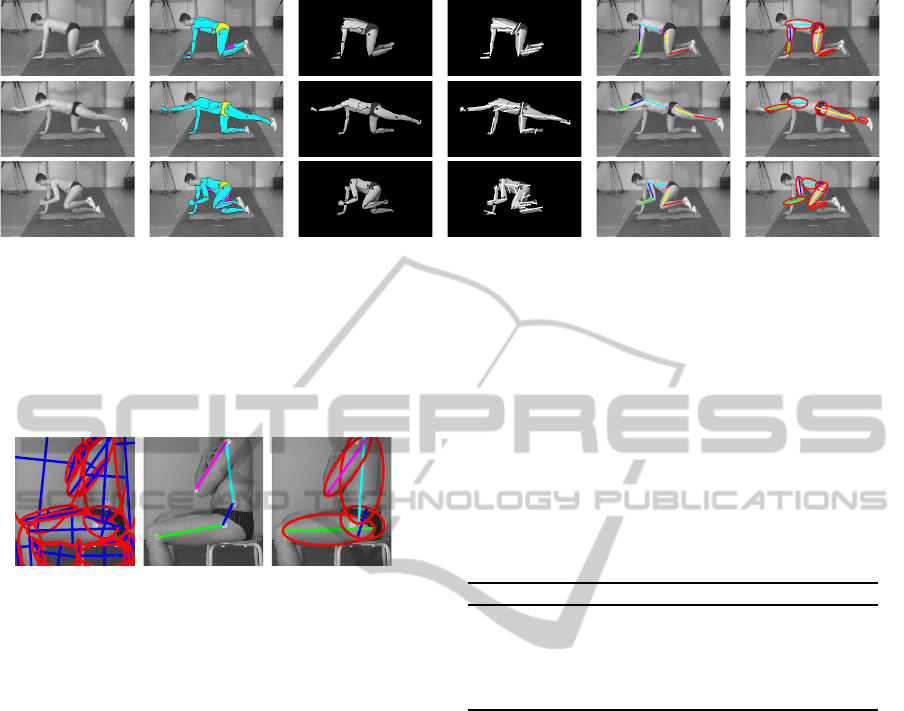
(a) (b) (c) (d) (e) ( f )
Figure 6: (a): Input images. (b): The segmented images. Many surface segments correspond to meaningful parts of the
human body, such as the arms, the legs and the torso. The magenta, cyan and yellow colours correspond to convex, concave
and saddle like polynomial surfaces. We find concave polynomial surfaces for the arms, the legs and the torso, while shadowed
human body parts are often approximated by convex polynomial surfaces. (c): The surface reconstructed human body images.
(d): Reconstructed human body skeletons from the axes of minimum curvature of the polynomial surfaces approximating the
human body. (e): The ground truth human body skeletons. ( f): The axes of the ellipses representing the segments that match
with the ground truth skeletons. The corresponding line segment pairs are indicated by the same colour.
(a) (b) (c)
Figure 5: (a): The human body image segments represented
by ellipses and their axes. (b): The ground truth human
body skeleton. (c): The axes of the ellipses that match with
the ground truth skeleton. The corresponding line segment
pairs are indicated by the same colour. The LSD is 6.34.
The reconstruction from the axes of minimum
curvature of cylinders only applies to the proposed
method. In order to compare, we also reconstruct
the human body skeleton from the axes of an ellipse
model for the surface segments. The reconstruction
from the axes of ellipses applies to methods that do
not provide curvature information of the surface seg-
ments. We obtain ellipses from least-squares fits. An
ellipse model for human body parts was earlier pro-
posed in (Park and Aggarwal, 2004; Wu and Agha-
jan, 2007). An example human body surface seg-
ments represented by ellipses and their axes is shown
in Figure 5 (a). To measure the quality of a human
body segmentation, we match the axes of the ellipses
with the ground truth skeleton using the LSD. Fig-
ure 5 (c) shows the axes of the ellipses that match
with the ground truth skeleton in Figure 5 (b). The
corresponding line segment pairs are indicated by the
same colour. Here, the LSD is 6.34. The correct axes
are matched, they follow almost the same directions
as the ground truth skeleton.
Additional results are shown in Figure 6. The
columns (a) to ( f) show the input images, the seg-
Table 3: This table always shows the means and standard
deviations of the LSDs for segmentation with polynomial
surfaces, mean shift, normalized cuts and marker-controlled
watersheds, respectively. For our method, beside the human
body skeleton reconstructions from the axes of cylinders,
we also make a variant of our method which produces hu-
man body skeleton reconstructions from the axes of ellipses.
Line Segment Distance (lower is better)
Polynomial surfaces (cylinders) 4.87 ± 1.21
Polynomial surfaces (ellipses) 6.31 ± 2.17
Mean-shift 10.73 ± 2.99
Normalized cuts 11.64 ± 3.25
Marker-controlled watersheds 16.37 ± 3.28
mented images, the surface reconstructed images, the
reconstructed human body skeletons from the axes
of minimum curvature, the ground truth human body
skeletons and the axes of the ellipses representing the
segments that match with the ground truth skeletons,
respectively. The corresponding line segment pairs
are indicated in the same colour. The surface seg-
ments of the human bodies are separated from the
background by considering the segments close to the
markers.
We compare our segmentation based on polyno-
mial surfaces, with human body segmentation algo-
rithms based on mean shift (Comaniciu and Meer,
2002; Porikli and Tuzel, 2003), segmentations based
on normalized cuts (Shi and Malik, 2000; Li et al.,
2011) and segmentations based on marker-controlled
watersheds (Vincent and Soille, 1991; Park et al.,
1999). Output examples of human body segmenta-
tion with mean shift, normalized cuts and marker-
controlled watersheds are shown in column (a) in Fig-
ure 7. Column (b) in Figure 7 shows the segments
represented by ellipses and their axes. Column (c)
in Figure 7 shows the axes of the ellipses that match
Curvature-basedHumanBodyPartsSegmentationinPhysiotherapy
635
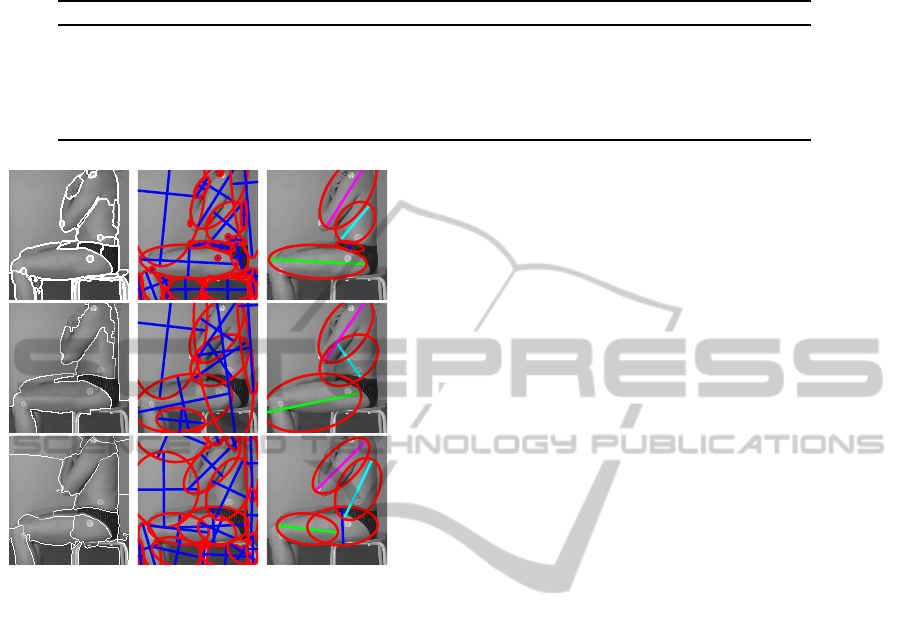
Table 4: This table always shows the means of the LSDs for segmentation of individual human body parts with polynomial
surfaces, mean shift, normalized cuts and marker-controlled watersheds, respectively.
LSD (lower is better) lower leg upper leg lower arm upper arm torso
Polynomial surfaces (cylinders) 1.94 1.81 2.26 1.13 4.12
Polynomial surfaces (ellipses) 2.56 2.48 2.88 1.81 7.55
Mean-shift 4.17 3.64 4.05 2.83 19.83
Normalized cuts 4.69 3.25 4.54 2.21 27.33
Marker-controlled watersheds 5.03 4.86 5.39 2.96 24.84
(a) (b) (c)
Figure 7: (a): The segmentation of a human body image
with mean shift, normalized cuts and marker-controlled wa-
tersheds, respectively. (b): The segments represented by
ellipses and their axes. (c): The axes of the ellipses that
match with the ground truth skeleton. The LSDs are 10.56,
12.14 and 17.61, respectively.
with the ground truth skeleton using the LSD. The
LSDs for human body segmentation with mean shift,
normalized cuts and watersheds are 10.56, 12.14 and
17.61, respectively.
Table 3 always shows the mean and standard de-
viation of the LSDs of human body segmentations
based on polynomial surfaces, mean shift, normal-
ized cuts and marker-controlled watersheds, respec-
tively. For our method, beside the human body skele-
ton reconstructions from the axes of cylinders, we
also make a variant of our method which produces
human body skeleton reconstructions from the axes
of ellipses. We find that the LSDs of other segmenta-
tion methods are higher than the LSD of our segmen-
tation. Furthermore, a human body skeleton recon-
struction with the axes of cylinders is more accurate
than a reconstruction with the axes of ellipses. When
we consider the means of the LSDs for segmentation
of individual human body parts in Table 4, we find
that our method outperforms the other techniques in
all cases, especially for the skeleton reconstruction of
the torso.
5 CONCLUSION
In this work, we perform human sports activity anal-
ysis with computer vision by reliable segmentation of
the human body into meaningful parts, such as arms,
torso and legs. Human body segmentation is per-
formed on greyscale human body images by adaptive
region growing based on constructive polynomial fit-
ting. Human body images are represented by flat, pla-
nar, convex, concave and saddle polynomial surfaces
with a variable fitting error. The low-degree polyno-
mial surfaces correspond to meaningful human body
features. We find that human body parts are often
represented as nearly cylindrical surfaces, of which
the axes of minimum curvature reconstruct the hu-
man body skeleton accurately. The proposed method,
which provides human body skeleton reconstructions
from curvature information of the surface segments,
outperforms existing segmentation techniques that do
not provide this information. By sharing the analysis
of exercises with the physiotherapist and the athlete,
the athlete can improve the way he is performing ex-
cercises in order to obtain optimal sports or recovery
results.
ACKNOWLEDGEMENTS
The work was financially supported by iMinds and
IWT through the project ‘LittleSister’ and by FWO
through the project G.0.398.11.N.10 “Multi-camera
human behavior monitoring and unusual event detec-
tion”.
REFERENCES
Aggarwal, J. K. and Ryoo, M. (2011). Human activity anal-
ysis: A review. ACM Computing Surveys, 43(3).
VISAPP2015-InternationalConferenceonComputerVisionTheoryandApplications
636

Barnard, M. and Heikkila, J. (2008). Body part segmen-
tation of noisy human silhouette images. In Proc. of
IEEE Int. Conf. on Mult. and Expo, pages 1189–1192.
Bartlett, R. (2007). Analysing Human Movements Patterns.
Routledge.
Comaniciu, D. and Meer, P. (2002). Mean shift: A ro-
bust approach toward feature space analysis. IEEE
Trans. on Pattern Analysis and Machine Intelligence,
24(5):603–619.
Deboeverie, F., Veelaert, P., and Philips, W. (2013). Im-
age segmentation with adaptive region growing based
on a polynomial surface model. Journal of Electronic
Imaging, 22(4).
Gao, Y. and Leung, M. K. (2002). Face recognition using
line edge map. IEEE Trans. on Pattern Analysis and
Machine Intelligence, 24(6):764–779.
Guo, G. and Lai, A. (2014). A survey on still image
based human action recognition. Pattern Recognition,
47(10):3343 – 3361.
Hou, Y.-L. and Pang, G. K. H. (2011). People counting
and human detection in a challenging situation. IEEE
Trans. on Systems, Man, and Cybernetics - Part A:
Systems and Humans, 41(1):24–33.
Hsieh, J.-W., Chuang, C.-H., Chen, S.-Y., Chen, C.-C., and
Fan, K.-C. (2010). Segmentation of human body parts
using deformable triangulation. IEEE Trans. on Sys-
tems, Man, and Cybernetics - Part A: Systems and Hu-
mans, 40(3):596–610.
Hu, Z., Lin, X., and Yan, H. (2006). Torso detection in static
images. In Proc. of Int. Conf. on Signal Processing.
Hu, Z., Wang, G., Lin, X., and Yan, H. (2009). Recovery
of upper body poses in static images based on joints
detection. Pattern Recognition Letters, 30:503–512.
Juang, C.-F., Chang, C.-M., Wu, J.-R., and Lee, D. (2009).
Computer vision-based human body segmentation and
posture estimation. IEEE Trans. on Systems, Man,
and Cybernetics - Part A: Systems and Humans,
39(1):119–133.
Lambert, J. (1760). Photometria Sive de Mensura de Grat-
ibus Luminis. Colorum et Umbrae. Augsberg, Ger-
many: Eberhard Klett.
Lee, M. W. and Cohen, I. (2006). A model-based approach
for estimating human 3d poses in static images. IEEE
Trans. on Pattern Analysis and Machine Intelligence,
28(6):905–916.
Li, S., Lu, H.-C., Ruan, X., and Chen, Y.-W. (2011). Hu-
man body segmentation based on deformable models
and two-scale superpixel. Pattern Analysis and Appli-
cations, pages 1–15.
Li, S., Shao, X., et al. (2014). Human body segmentation
via data-driven graph cut. IEEE Trans. on Cybernet-
ics. DOI:10.1109/TCYB.2014.2301193.
Liang, Y.-M., Shih, S.-W., Shih, C.-C., Liao, H.-Y. M., and
Lin, C.-C. (2009). Learning atomic human actions
using variable-length markov models. IEEE Trans. on
Systems, Man, and Cybernetics - Part B: Cybernetics,
39(1):268–280.
Liu, Q., Li, H., and Ngan, K. N. (2011). Automatic body
segmentation with graph cut and self-adaptive initial-
ization level set (sails). J. Vis. Commun. Image R.,
22:367–377.
Mori, G. and Malik, J. (2006). Recovering 3d human body
configurations using shape contexts. IEEE Trans. Pat-
tern Analysis Machine Intelligence, 28(7):1052–1062.
Mori, G., Ren, X., Efros, A. A., and Malik, J. (2004). Re-
covering human body configuration: Combining seg-
mentation and recognition. In Proc. of Computer Vi-
sion and Pattern Recognition, pages 326–333.
Park, J.-S., Oh, H.-S., Chang, D.-H., and Lee, E.-T. (1999).
Human posture recognition using curve segments for
image retrieval. In Proc. of SPIE.
Park, S. and Aggarwal, J. K. (2004). Semantic-level un-
derstanding of human actions and interactions using
event hierarchy. In Proc. of Computer Vision and Pat-
tern Recognition Workshop, page 12.
Poppe, R. (2007). Vision-based human motion analysis: An
overview. Computer vision and image understanding,
108(1):4–18.
Porikli, F. and Tuzel, O. (2003). Human bodytracking
byadaptive background models and mean-shift anal-
ysis. In IEEE Int. Workshop on Performance Evalua-
tion of Tracking and Surveillance.
Shao, L., Ji, L., Liu, Y., and Zhang, J. (2012). Human action
segmentation and recognition via motion and shape
analysis. Pattern Recognition Letters, 33:438–445.
Shi, J. and Malik, J. (2000). Normalized cuts and image
segmentation. IEEE Trans. on Pattern Analysis and
Machine Intelligence, 22(8):888–905.
Srinivasan, P. and Shi, J. (2007). Bottom-up recognition
and parsing of the human body. In Proc. of Computer
Vision and Pattern Recognition, pages 1–8.
Veelaert, P. (1997). Constructive fitting and extraction of
geometric primitives. CVGIP: Graphical Models and
Image Processing, 59(4):233–251.
Veelaert, P. (2012). Separability and tight enclosure of point
sets, digital geometry algorithms. Theoretical Foun-
dations and Appl. to Computational Imaging, 2.
Veelaert, P. and Teelen, K. (2006). Fast polynomial seg-
mentation of digitized curves. In Proc. of Discrete
Geometry for Computer Imagery, pages 482–493.
Vincent, L. and Soille, P. (1991). Watersheds in digital
spaces: An efficient algorithm based on immersion
simulations. IEEE Trans. on Pattern Analysis and Ma-
chine Intelligence, 13(6):583–598.
Wagemans, J., Doorn, A. J. V., and Koenderink, J. (2010).
The shading cue in context. i-Perception, 1(3):159–
178.
Wu, C. and Aghajan, H. (2007). Model-based image seg-
mentation for multi-view human gesture analysis. In
Proc. of Advanced Concepts for Intelligent Vision Sys-
tems, pages 310–321.
Xiao, Y., Lu, H., and Sun, C. (2014). Pose estimation based
on pose cluster and candidates recombination. IEEE
Trans. on Circuits and Systems for Video Technology.
DOI:10.1109/TCSVT.2014.2347511.
Curvature-basedHumanBodyPartsSegmentationinPhysiotherapy
637
