
A Generic Probabilistic Graphical Model for Region-based
Scene Interpretation
Michael Ying Yang
Institute for Information Processing, Leibniz University Hannover, Hannover, Germany
Keywords:
Scene Interpretation, Energy Function, Conditional Random Field, Bayesian Network.
Abstract:
The task of semantic scene interpretation is to label the regions of an image and their relations into meaningful
classes. Such task is a key ingredient to many computer vision applications, including object recognition,
3D reconstruction and robotic perception. The images of man-made scenes exhibit strong contextual depen-
dencies in the form of the spatial and hierarchical structures. Modeling these structures is central for such
interpretation task. Graphical models provide a consistent framework for the statistical modeling. Bayesian
networks and random fields are two popular types of the graphical models, which are frequently used for
capturing such contextual information. Our key contribution is the development of a generic statistical graph-
ical model for scene interpretation, which seamlessly integrates different types of the image features, and the
spatial structural information and the hierarchical structural information defined over the multi-scale image
segmentation. It unifies the ideas of existing approaches, e. g. conditional random field and Bayesian network,
which has a clear statistical interpretation as the MAP estimate of a multi-class labeling problem. We demon-
strate experimentally the application of the proposed graphical model on the task of multi-class classification
of building facade image regions.
1 INTRODUCTION
The task of semantic scene interpretation is to label
the regions of an image and their relations into seman-
tically meaningful classes. Such task is a key ingre-
dient to many computer vision applications, including
object recognition, 3D reconstruction and robotic per-
ception. The problem of scene interpretation in terms
of classifying various image components in the im-
ages is a challenging task partially due to the ambi-
guities in the appearance of the image data (Tsotsos,
1988). These ambiguities may arise either due to the
physical conditions such as the illumination and the
pose of the scene components with respect to the cam-
era, or due to the intrinsic nature of the data itself.
Images of man-made scenes, e. g. building facade
images, exhibit strong contextual dependencies in the
form of spatial and hierarchical interactions among
the components. Neighboring pixels tend to have sim-
ilar class labels, and different regions appear in re-
stricted spatial configurations. Modeling these spatial
and hierarchical structures is crucial to achieve good
classification accuracy, and help alleviate the ambigu-
ities.
Graphical models, either directed models or undi-
rected models, provide consistent frameworks for the
statistical modeling. Two types of graphical mod-
els are frequently used for capturing such contex-
tual information, i. e. Bayesian networks (BNs)
(Sarkar & Boyer, 1993) and random fields (RFs) (Be-
sag, 1974), corresponding to directed and undirected
graphs. RFs mainly capture the mutually dependent
relationships such as the spatial correlation. Attempts
were made to exploit the spatial structure for seman-
tic image interpretation by using RFs. Early since
nineties, Markov random fields (MRFs) have been
used for image interpretation (Modestino & Zhang,
1992); the limiting factor that MRFs only allow for
local features has been overcome by conditional ran-
dom fields (CRFs) (Kumar & Hebert, 2003a; Laf-
ferty et al., 2001), where arbitrary features can be
used for classification, at the expense of a purely dis-
criminative approach. On the other side, BNs usually
model the causal relationships among random vari-
ables. Early in nineties, (Sarkar & Boyer, 1993) have
proposed the perceptual inference network with the
formalism based on Bayesian networks for geomet-
ric knowledge-base representation. Both have been
used to solve computer vision problems, yet they have
their own limitations in representing the relationships
486
Yang M..
A Generic Probabilistic Graphical Model for Region-based Scene Interpretation.
DOI: 10.5220/0005341004860491
In Proceedings of the 10th International Conference on Computer Vision Theory and Applications (VISAPP-2015), pages 486-491
ISBN: 978-989-758-090-1
Copyright
c
2015 SCITEPRESS (Science and Technology Publications, Lda.)

between random variables. BNs are not suitable to
represent symmetric relationships that mutually relate
random variables. RFs are natural methods to model
symmetric relationships, but they are not suitable to
model causal or part-of relationships.
Spatial and hierarchical relationships are two
valuable cues for image interpretation of man-made
scenes. In this paper we will develop a consistent
graphical model representation for image interpreta-
tion that includes both information about the spatial
structure and the hierarchical structure. We assume
some preprocessing leads to regions, either as a parti-
tioning of the image area or as a set of overlapping or
non-overlapping segments. The key idea for integrat-
ing the spatial and the hierarchical structural informa-
tion into the interpretation process is to combine them
with the low-level region class probabilities in a clas-
sification process by constructing the graphical model
on the multi-scale image regions.
The following sections are organized as follows.
The related works are discussed in Sec. 2. In Sec. 3,
the statistical model for the interpretation problem is
formulated. Then, the relations to previous models is
discussed in Sec. 4. In Sec. 5, experimental results are
presented. Finally, this work is concluded in Sec. 6.
2 RELATED WORK
There are many recent works on contextual models
that exploit the spatial structures in the image. Mean-
while, the use of multiple different over-segmented
images as a preprocessing step is not new to computer
vision. In the context of multi-class image classifica-
tion, the work of (Plath et al., 2009) comprises two as-
pects for coupling local and global evidences both by
constructing a tree-structured CRF on image regions
on multiple scales and using global image classifica-
tion information. Thereby, (Plath et al., 2009) neglect
direct local neighborhood dependencies. The work
of (Schnitzspan et al., 2008) extends classical one-
layer CRF to a multi-layer CRF by restricting the pair-
wise potentials to a regular 4-neighborhood model
and introducing higher-order potentials between dif-
ferent layers.
Although not as popular as CRFs, BNs have
also been used to solve computer vision problems
(Mortensen & Jia, 2006; Sarkar & Boyer, 1993). BNs
provide a systematic way to model the causal rela-
tionships among the entities. By explicitly exploiting
the conditional independence relationships (known as
prior knowledge) encoded in the structure, BNs could
simplify the modelling of joint probability distribu-
tions. Based on the BN structure, the joint probability
is decomposed into the product of a set of local con-
ditional probabilities, which is much easier to spec-
ify because of their semantic meanings (Zhang & Ji,
2010).
Graphical models have reached a state where both
hierarchical and spatial neighborhood structures can
be efficiently handled. RFs and BNs are suitable for
representing different types of statistical relationships
among the random variables. Yet only a few previous
works focus on integrating RFs with BNs. In (Ku-
mar & Hebert, 2003b), the authors present a genera-
tive model based approach to man-made structure de-
tection in 2D natural images. They use a causal multi-
scale random field as a prior model on the class labels.
Labels over an image are generated using Markov
chains defined over coarse to fine scales. However,
the spatial neighborhood relationships are only con-
sidered at the bottom scale. So, essentially, this model
is a tree-structured belief network plus a flat Markov
random field. Recently, a unified graphical model
that can represent both the causal and noncausal re-
lationships among the random variables is proposed
in (Zhang & Ji, 2010). They first employ a CRF to
model the spatial relationships among the image re-
gions and their measurements. Then, they introduce
a multilayer BN to model the causal dependencies.
The CRF model and the BN model are then combined
through the theories of the factor graphs to form a
unified probabilistic graphical model. Their graphi-
cal model is too complex in general. Although their
model improves state of the art results on the Weiz-
mann horse dataset and the MSRC dataset, they need
a lot of domain expert knowledge to design the local
constraints. Also, they use a combination of super-
vised parameter learning and manual parameter set-
ting for the model parameterization. Simultaneously
learn the BN and CRF parameters automatically from
the training data is not a trivial task. Compared to
the graphical models in (Kumar & Hebert, 2003b),
which are too simple, the graphical models in (Zhang
& Ji, 2010) are too complex in general. Our graphical
model lies in between, cf. Fig. 1. We try to construct
our graphical model that is not too simple in order
to model the rich relationships among the neighbor-
hood of pixels and image regions in the scene, yet
not too complex in order to make parameter learning
and probabilistic inference efficiently. Furthermore,
our model underlies a clear semantic meaning. If the
undirected edges are ignored, meaning no spatial rela-
tionships are considered, the graph is a tree represent-
ing the hierarchy of the partonomy among the scales.
Within each scale, the spatial regions are connected
by the pairwise edges.
AGenericProbabilisticGraphicalModelforRegion-basedSceneInterpretation
487
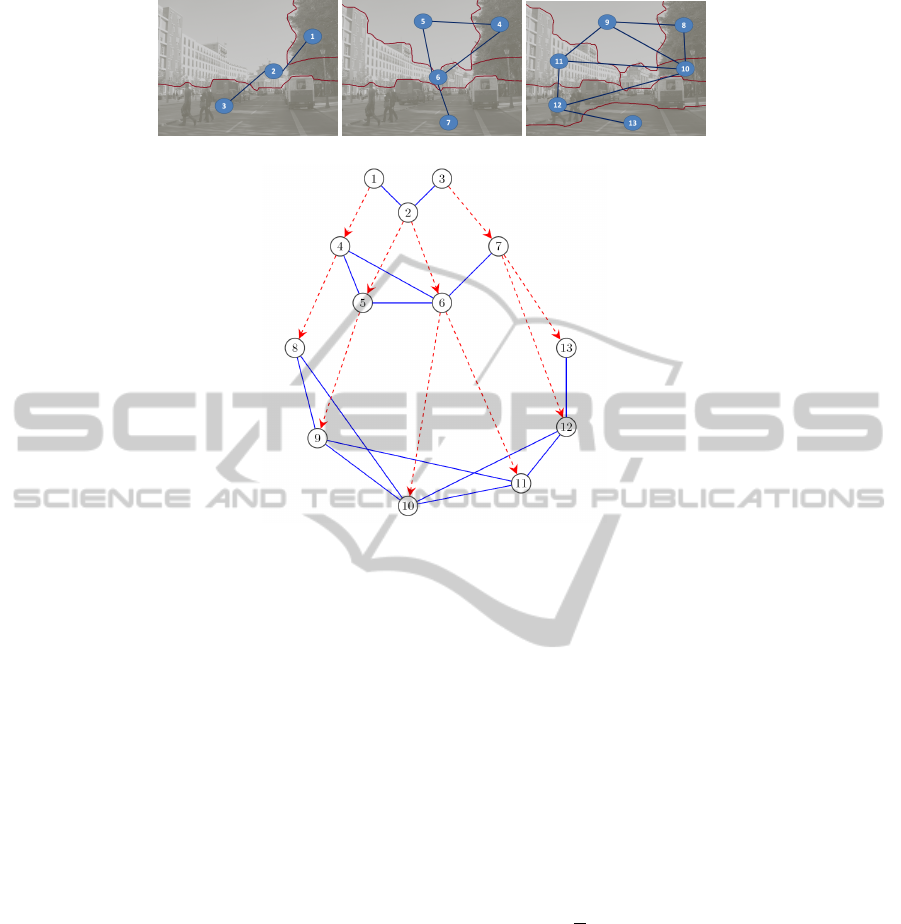
(a) Multi-scale segmentation
(b) The graphical model
Figure 1: Illustration of the graphical model architecture. The blue edges between the nodes represent the neighborhoods
at one scale (undirected edges), and the red dashed edges represent the hierarchical relation between regions (undirected or
directed edges).
3 MODEL
3.1 The Graphical Model Construction
By constructing the graphical model, we can flexibly
choose either directed edges or undirected edges to
model the relationships between the random variables
based on the semantic meaning of these relationships.
We use an example image to explain this model
construction process. Given a test image, Fig. 1 shows
the corresponding multi-scale segmentation of the im-
age, and the corresponding graphical model for im-
age interpretation. Three layers are connected via a
region hierarchy (Drauschke & F
¨
orstner, 2011). The
development of the regions over several scales is used
to model the region hierarchy. Furthermore, the re-
lation is defined over the maximal overlap of the re-
gions. Nodes connection and numbers correspond to
the multi-scale segmentation. The pairwise interac-
tions between the spatial neighboring regions can be
modeled by the undirected edges. The pairwise po-
tential functions can be defined to capture the similar-
ity between the neighboring regions. The hierarchi-
cal relation between regions of the scene partonomy
representing parent-child relations or part-of relations
can be modeled by either the undirected edges or the
directed edges.
3.2 Multi-class Labeling Representation
We present the scene interpretation problem as a
multi-class labeling problem. Given the observed data
d, the distribution P over a set of the variables x can
be expressed as a product of the factors
P(x | d) =
1
Z
∏
i∈V
f
i
(x
i
| d)
∏
{i, j}∈E
f
i j
(x
i
, x
j
| d)
∏
h
i,k
i
∈S
f
ik
(x
i
, x
k
| d) (1)
where the factors f
i
, f
i j
, f
ik
are the functions of the
corresponding sets of the nodes, and Z is the normal-
ization factor. The set V is the set of the nodes in
the complete graph, and the set E is the set of pairs
collecting the neighboring nodes within each scale.
S is the set of pairs collecting the parent-child re-
lations between regions with the neighboring scales,
where
h
i, k
i
denotes nodes i and k are connected by
either a undirected edge or a directed edge. Note that
this model only exploits up to second-order cliques,
VISAPP2015-InternationalConferenceonComputerVisionTheoryandApplications
488

which makes learning and inference much faster than
the model involving high-order cliques.
By simple algebra calculation, the probability dis-
tribution given in Eq. (1) can be written in the form of
a Gibbs distribution
P(x | d) =
1
Z
exp(−E(x | d)) (2)
with the energy function E(x | d) as
E(x | d) =
∑
i∈V
E
1
(x
i
| d) + α
∑
{i, j}∈E
E
2
(x
i
, x
j
| d)
+ β
∑
h
i,k
i
∈S
E
3
(x
i
, x
k
| d) (3)
where α and β are the weighting coefficients in the
model. E
1
is the unary potential, E
2
is the pairwise
potential, and E
3
is either the hierarchical pairwise
potential or the conditional probability energy. This
graphical model is illustrated in Fig. 1. The most
probable or maximum a posteriori (MAP) labeling x
∗
is defined as
x
∗
= arg max
x∈L
n
P(x | d) (4)
and can be found by minimizing the energy function
E(x | d).
4 RELATION TO PREVIOUS
MODELS
In this section, we draw comparisons with the pre-
vious models for image interpretation (Drauschke &
F
¨
orstner, 2011; Fulkerson et al., 2009; Plath et al.,
2009; Yang et al., 2010) and show that at certain
choices of the parameters of our framework, these
methods fall out as the special cases. We will now
show that our model is not only a generalization of
the standard flat CRF over the image regions, but also
of the hierarchical CRF and the conditional Bayesian
network.
4.1 Equivalence to Flat CRFs Over
Regions
Let us consider the case with only one layer segmen-
tation of the image (the bottom layer of the graphical
model in Fig. 1). In this case, the weight β is set to
be zero, the set V
1
is the set of nodes in the graph
of the bottom layer, and the set E
1
is the set of pairs
collecting the neighboring nodes in the bottom layer.
This allows us to rewrite (3) as
E(x | d) =
∑
i∈V
1
E
1
(x
i
| d) + α
∑
{i, j}∈E
1
E
2
(x
i
, x
j
| d)
(5)
which is exactly the same as the energy function as-
sociated with the flat CRF defined over the image re-
gions with E
1
as the unary potential and E
2
as the
pairwise potential. In this case, our model becomes
equivalent to the flat CRF models defined over the
image regions (Fulkerson et al., 2009; Gould et al.,
2008).
4.2 Equivalence to Hierarchical CRFs
Let us now consider the case with the multi-scale seg-
mentation of the image. If we choose E
3
as a pairwise
potential in (3), the energy function reads
E(x | d) =
∑
i∈V
E
1
(x
i
| d) + α
∑
{i, j}∈E
E
2
(x
i
, x
j
| d)
+ β
∑
{i,k}∈S
E
3
(x
i
, x
k
| d) (6)
which is exactly the same as the energy function as-
sociated with the hierarchical CRF defined over the
multi-scale of the image regions with E
1
as the unary
potential, E
2
as the pairwise potential within each
scale, and E
3
as the hierarchical pairwise potential
with the neighboring scales. In this case, our model
becomes equivalent to the hierarchical CRF models
defined over multi-scale of image regions (He et al.,
2004; Yang et al., 2010).
If we set α to be zero, and choose E
3
as a pairwise
potential in (3), the energy function reads
E(x | d) =
∑
i∈V
E
1
(x
i
| d) + β
∑
{i,k}∈S
E
3
(x
i
, x
k
| d) (7)
which is the same as the energy function associated
with the tree-structured CRF by neglecting the di-
rect local neighborhood dependencies on the image
regions on multiple scales. In this case, our model be-
comes equivalent to the tree-structured CRF models
defined over multi-scale of the image regions (Plath
et al., 2009; Reynolds & Murphy, 2007).
4.3 Equivalence to Conditional
Bayesian Networks
If we set α to be zero, and choose E
3
as the condi-
tional probability energy in (3), the energy function
reads
E(x | d) =
∑
i∈V
E
1
(x
i
| d) + β
∑
h
i,k
i
∈S
E
3
(x
i
, x
k
| d) (8)
which is the same as the energy function associated
with the tree-structured conditional Bayesian network
defined over the multi-scale of the image regions.
In the tree-structured conditional Bayesian network,
the classification of a region is based on the unary
AGenericProbabilisticGraphicalModelforRegion-basedSceneInterpretation
489
features derived from the region and the binary fea-
tures derived from the relations of the region hierar-
chy graph. In this case, our model becomes equiv-
alent to the tree-structured conditional Bayesian net-
work defined over multi-scale of the image regions
(Drauschke & F
¨
orstner, 2011).
5 EXPERIMENTS
We conduct the experiments to evaluate the perfor-
mance of the proposed model on eTRIMS dataset
(Kor
ˇ
c & F
¨
orstner, 2009). The dataset consists of 60
building facade images, labeled with 8 classes: build-
ing, car, door, pavement, road, sky, vegetation, win-
dow. We randomly divide the images into a training
set with 40 images and a testing set with 20 images.
In all experiments, we take the ground truth label of a
region to be the majority vote of the ground truth pixel
labels. At the test stage we compute our accuracy at
the pixel level.
The hierarchical mixed graphical model is defined
over the multi-scale of the image regions when we
choose E
3
as the conditional probability energy in
Eq. (3). We present the experimental results for the
hierarchical mixed graphical model with multi-scale
mean shift segmentation (Comaniciu & Meer, 2002)
and watershed segmentation (Vincent & Soille, 1991),
and the comparison with the baseline region classifier,
the flat CRF, and the hierarchical CRF classification
results.
Results with Multi-scale Mean Shift and the Hi-
erarchical Mixed Graphical Model. The overall
classification accuracy is 68.9%. The weighting pa-
rameters are α = 0.8, β = 1. For comparison, the RDF
region classifier gives an overall accuracy of 58.8%,
the flat CRF gives an overall accuracy of 65.8%, and
the hierarchical CRF gives an overall accuracy of
69.0%.
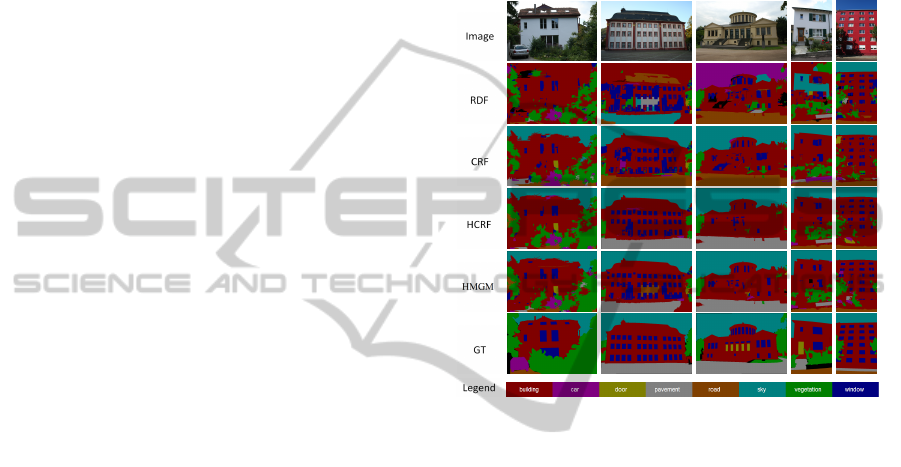
Qualitative results of the hierarchical mixed
graphical model with the multi-scale mean shift on
the eTRIMS dataset (Kor
ˇ
c & F
¨
orstner, 2009) are pre-
sented in Fig. 2. The qualitative inspection of the
results in these images shows that the hierarchical
mixed graphical model yields significant improve-
ment. The hierarchical mixed graphical model yields
more accurate and cleaner results than the flat CRF
and the RDF region classifier, and comparable to
the hierarchical CRF model. The greatest accuracies
are for classes which have low visual variability and
many training examples (such as window, vegetation,
building, and sky) whilst the lowest accuracies are for
classes with high visual variability or few training ex-
amples (for example door, car, and pavement). We
expect more training data and the use of features with
better invariance properties will improve the classifi-
cation accuracy. Objects such as car, door, pavement,
and window are sometimes incorrectly classified as
building, due to the dominant presence of the build-
ing in the image. Detecting windows, cars, and doors
should resolve some of such ambiguities.
Figure 2: Qualitative classification results of the hierar-
chical mixed graphical model with the multi-scale mean
shift segmentation on the testing images from the eTRIMS
dataset (Kor
ˇ
c & F
¨
orstner, 2009).
Results with Multi-scale Watershed and the Hi-
erarchical Mixed Graphical Model. The overall
classification accuracy is 68.0%. The weighting pa-
rameters are α = 1.08, β = 1. For comparison, the
RDF region classifier gives an overall accuracy of
55.4%, the flat CRF gives an overall accuracy of
61.8%, and the hierarchical CRF gives an overall ac-
curacy of 65.3%. Qualitative results of the hierarchi-
cal mixed graphical model on the eTRIMS dataset are
presented in Fig. 3.
6 CONCLUSION
In this paper, we have addressed the problem of in-
corporating two different types of the contextual in-
formation, namely the spatial structure and the hi-
erarchical structure for image interpretation of man-
made scenes. We propose a statistically motivated,
generic probabilistic graphical model framework for
scene interpretation, which seamlessly integrates dif-
ferent types of the image features, and the spatial
VISAPP2015-InternationalConferenceonComputerVisionTheoryandApplications
490
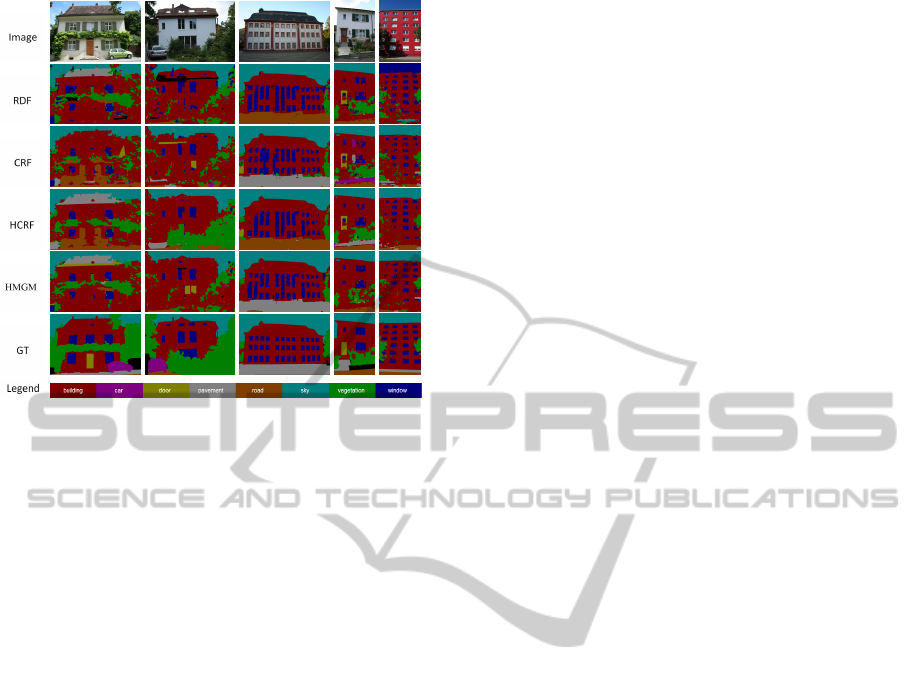
Figure 3: Qualitative classification results of the hierar-
chical mixed graphical model with the multi-scale water-
shed segmentation on the testing images from the eTRIMS
dataset (Kor
ˇ
c & F
¨
orstner, 2009).
structural information and the hierarchical structural
information defined over the multi-scale image seg-
mentation. We demonstrate the application of the pro-
posed model on the building facade image classifica-
tion task.
REFERENCES
Besag, J. 1974. Spatial interaction and the statistical analy-
sis of lattice systems (with discussion). Journal of the
royal statistical society, B-36(2), 192–236.
Comaniciu, Dorin, & Meer, Peter. 2002. Mean shift: A
robust approach toward feature space analysis. Ieee
transactions on pattern analysis and machine intelli-
gence, 24(5), 603–619.
Drauschke, M., & F
¨
orstner, W. 2011. A bayesian approach
for scene interpretation with integrated hierarchical
structure. Pages 1–10 of: Annual symposium of the
german association for pattern recognition (dagm).
Fulkerson, B., Vedaldi, A., & Soatto, S. 2009. Class
segmentation and object localization with superpixel
neighborhoods. Pages 670–677 of: International con-
ference on computer vision.
Gould, S., Rodgers, J., Cohen, D., Elidan, G., & Koller, D.
2008. Multi-class segmentation with relative location
prior. International journal of computer vision, 80(3),
300–316.
He, X., Zemel, R., & Carreira-perpin, M. 2004. Multiscale
conditional random fields for image labeling. Pages
695–702 of: Ieee conference on computer vision and
pattern recognition.
Kor
ˇ
c, Filip, & F
¨
orstner, Wolfgang. 2009. eTRIMS Image
Database for interpreting images of man-made scenes.
In: Tr-igg-p-2009-01, department of photogrammetry,
university of bonn.
Kumar, Sanjiv, & Hebert, Martial. 2003a. Discriminative
random fields: A discriminative framework for con-
textual interaction in classification. Pages 1150–1157
of: Ieee international conference on computer vision,
vol. 2.
Kumar, Sanjiv, & Hebert, Martial. 2003b. Man-made struc-
ture detection in natural images using a causal multi-
scale random field. Pages 119–126 of: Ieee confer-
ence on computer vision and pattern recognition.
Lafferty, J., McCallum, A., & Pereira, F. 2001. Conditional
random fields: Probabilistic models for segmenting
and labeling sequence data. Pages 282–289 of: In-
ternational conference on machine learning.
Modestino, J. W., & Zhang, J. 1992. A markov random field
model-based approach to image interpretation. Ieee
transactions on pattern analysis and machine intelli-
gence, 14(6), 606–615.
Mortensen, Eric N., & Jia, Jin. 2006. Real-time semi-
automatic segmentation using a bayesian network.
Pages 1007–1014 of: Ieee conference on computer vi-
sion and pattern recognition.
Plath, Nils, Toussaint, Marc, & Nakajima, Shinichi. 2009.
Multi-class image segmentation using conditional ran-
dom fields and global classification. Pages 817–824
of: Bottou, L
´
eon, & Littman, Michael (eds), Interna-
tional conference on machine learning.
Reynolds, J., & Murphy, K. 2007. Figure-ground segmen-
tation using a hierarchical conditional random field.
Pages 175–182 of: Canadian conference on computer
and robot vision.
Sarkar, S., & Boyer, K. L. 1993. Integration, inference, and
management of spatial information using bayesian
networks: Perceptual organization. Pami, 15, 256–
274.
Schnitzspan, P., Fritz, M., & Schiele, B. 2008. Hierarchical
support vector random fields: Joint training to com-
bine local and global features. Pages 527–540 of:
Forsyth, D., Torr, P., & Zisserman, A. (eds), European
conference on computer vision.
Tsotsos, J.K. 1988. A ’complexity level’ analysis of imme-
diate vision. International journal of computer vision,
2(1), 303–320.
Vincent, Luc, & Soille, Pierre. 1991. Watersheds in digi-
tal spaces: An efficient algorithm based on immersion
simulations. Ieee transactions on pattern analysis and
machine intelligence, 13(6), 583–598.
Yang, Michael Ying, F
¨
orstner, Wolfgang, & Drauschke,
Martin. 2010. Hierarchical conditional random field
for multi-class image classification. Pages 464–469
of: International conference on computer vision the-
ory and applications.
Zhang, Lei, & Ji, Qiang. 2010. Image segmentation with a
unified graphical model. Pami, 32(8), 1406–1425.
AGenericProbabilisticGraphicalModelforRegion-basedSceneInterpretation
491
