
Automatic Identification of Mycobacterium tuberculosis in Ziehl-Neelsen
Stained Sputum Smear Microscopy Images using a Two-stage Classifier
Lucas de Assis Soares, Klaus Fabian Coco, Evandro Ottoni Teatini Salles and Saulo Bortolon
Federal University of Espirito Santo, 514 Fernando Ferrari Av., Vitoria, Brazil
Keywords:
Automatic Microscopy, Tuberculosis, Ziehl-Neelsen, Bacilloscopy.
Abstract:
This paper presents a method for the automatic identification of Mycobacterium tuberculosis in Ziehl-Neelsen
stained sputum smear microscopy images, the most common bacilloscopy method in developing countries
due to its low costs. The proposed method is divided in two stages: a projection of the original coloured
image followed by the segmentation and the elimination of large and small segmented structures, and the
classification of structures using neural networks and support vector machines. The segmentation of structures
presents a loss of bacilli of 1.31 %, while the elimination of areas increases the loss to 14.39 %. The evaluation
of the classification of structures is made using cross validation and a maximum sensitivity of 94.25 % is
obtained. The presented method has a low computational cost, allying performance and efficiency.
1 INTRODUCTION
Tuberculosis (TB) is a major global health problem.
According to the Global Tuberculosis Report 2014
(WHO, 2014), in 2013 an estimated 9 million people
developed TB and 1.5 million died from the disease.
The disease is second only to HIV/AIDS as the great-
est killer worldwide due to a single infectious agent.
The number of TB deaths is unacceptably large since
the disease is preventable and treatable. Due to the
large occurrence, the disease remains a major global
health problem (WHO, 2014).
The most common method for diagnosis of tuber-
culosis in developing countries is sputum smear mi-
croscropy, in which a sample of sputum is collected,
stained and examined under a microscope by a trained
laboratory technician (WHO, 2014).
Two techniques are used for tuberculosis diagno-
sis using sputum smear microscopy: fluorescence mi-
croscopy and conventional microscopy.
Fluorescence microscopy has a greater sensitivity
rate than conventional microscopy but also has greater
costs associated with it, so that it is not often avail-
able in developing countries where conventional mi-
croscopy using the Ziehl-Neelsen method is the most
common technique used for the diagnosis of tuber-
culosis in those countries (Costa Filho et al., 2012),
(Desikan, 2013).
For the tuberculosis diagnosis, the laboratory
technician must meticulously examine each slide
looking for bacilli and then record the number of bac-
teria observed in the slide. This process is labor in-
tensive and time consuming (Smart, 2007). For this
reason, it is interesting to have an automatic system
capable of analyzing a picture taken by a microscope
and identify tuberculosis bacteria on it.
In the field of conventional microscopy, Sadaphal
et al., 2008, proposed the segmentation based on
Bayesian analysis and the classification of structures
using a decision tree considering major axis length
and eccentricity. Costa et al., 2008, proposed the seg-
mentation in the image given by the operation R − G,
using an adaptive threshold to global segmentation.
In Sotaquir et al., 2009, it is proposed a segmentation
based on the colour spaces YcbCr and Lab. Makkap-
ati et al., 2009, presented a method for bacilli recog-
nition segmenting the image using Otsu’s technique
and searching for a beaded structure inside the seg-
mented objects in order to classify them. Nayak et
al., 2010, proposed the segmentation based on min-
imum distance between clusters of bacilli pixels and
non-bacilli pixels in the colour space HSV. Zhai et al.,
2010, proposed the segmentation based on the colour
spaces HSI and Lab followed by a decision tree to
classify the segmented objects using area, roughness
and circularity.
In more recent works, Siena et al., 2012, pro-
posed k-means clustering segmentation followed by
the classification of the structures using a multilayer
perceptron neural network considering eccentricity
Soares L., Coco K., Salles E. and Bortolon S..
Automatic Identification of Mycobacterium tuberculosis in Ziehl-Neelsen Stained Sputum Smear Microscopy Images using a Two-stage Classifier.
DOI: 10.5220/0005345201860191
In Proceedings of the 10th International Conference on Computer Vision Theory and Applications (VISAPP-2015), pages 186-191
ISBN: 978-989-758-091-8
Copyright
c
2015 SCITEPRESS (Science and Technology Publications, Lda.)

and compacity. Costa Filho et al., 2012, segmented
the images using information from the colour spaces
RGB, HSI, YcbCr and Lab in a multilayer perceptron
neural network. For the classification of the struc-
tures, eccentricity and color ratio were used in a de-
cision tree. Kusworo et al., 2013, presented a method
using Otsu segmentation technique on the hue compo-
nent of the HSV colour space and using eccentricity,
compacity and metric in a multilayer perceptron neu-
ral network. Chayadevi and Raju, 2014, proposed the
segmentation of images using watershed in the colour
spaces YcbCr, HSI and Lab.
This paper proposes a method for automatic
bacilli recognition in Ziehl-Neelsen stained sputum
images based on an improved technique for segmen-
tation of the images and the use of diverse character-
istics for the classification of the structures.
The rest of this paper is organized as follows: In
Section 2 the materials and methods used are pre-
sented, in Section 3 the results are presented and dis-
cussed, and in Section 4 the conclusion is presented.
2 MATERIAL AND METHODS
The image set used in this work was the one used
in Costa Filho et al., 2012,. The data set con-
sists of 120 images a size of 2816 x 2112 pixels
of sputum smear microscopy slides from 12 patients
prepared using Kinyoun acid-fast stain and coun-
terstained with methylene blue solution. The im-
ages were taken using a numerical aperture of 1.25
and a magnification of 100x combined with an op-
tical zoom of 4x. The images can be accessed in
http://www.tbimages.ufam.edu.br (CETELI, 2014).
The proposed method consists of two stages. First,
the coloured image is projected into a gray scale im-
age. The projection is based on Fisher linear discrimi-
nant. After the projection, the image is segmented and
the threshold is calculated according to the mean in-
tensity of the gray scale image. The second stage con-
sists of an area analysis of the segmented structures
and the classification of the remaining structures us-
ing a feedforward neural network and a support vector
machine. The parameters used for classification were
eccentricity, circularity, invariant moments, Fourier
descriptors, and the mean and the standard deviation
of each colour channel of the pixels in the structure.
Figure 1 presents the block diagram of the proposed
method.
Figure 1: Block diagram showing the proposed method.
Fisher linear discriminant seeks to find the projec-
tion vector that maximizes the criterion given by
J(w) =
w
t
S
B
w
w
t
S
W
w
, (1)
where S
B
is the between-class scatter matrix and
is a measure of the distance between the means of
the two classes,S
W
is the within-class scatter matrix
and can be understood as the scatter of the samples
around their respective class means, and w is the 3-
dimensional projection vector. (Duda et al., 2001).
Maximizing J(w) is then equivalent to maximizing S
B
while minimizing S
W
.
In this case the background pixel vectors consid-
ered were the ones for which the hue component is
smaller than 0.2 or greater than 0.7, since this is the
hue range where the bacilli pixels belong. This selec-
tion was made so that the background pixel vectors
were from a single probability distribution.
With the projection vector found, every pixel vec-
tor is projected and a gray intensity image is gener-
ated. After the projection, a global thresholding is
applied for image segmentation. The threshold is de-
fined based on the mean intensity of the projected
image according to a first degree polynomial defined
through linear regression.
In the segmented image there are some structures
that are too small or too big to be a bacilli. Some
of those structures may be a clustering of bacilli, but
when there is a cluster of them, there are normally
many bacilli present in the image, so individual bacilli
are also present. Structure containing less than 200
pixels or more than 2,600 pixels were discarded. The
removal of structures with area smaller than 200 pix-
els was made according to (Costa et al., 2008). For
the upper limit, it was noted that more than 95 % of
the structures had an area smaller than 2,600 pixels.
The next step is to classify those structures. The
parameters used for classification were eccentricity,
circularity, invariant moments (Gonzalez and Woods,
2007), Fourier descriptors and the mean and the stan-
dard deviation of each color channel of the pixels in
the structure. The Fourier descriptors used were the
ones proposed in Costa and Cesar Jr, 2000, so that all
features used were invariant to translation, rotation,
and scaling.
These features were applied to a multilayer per-
ceptron neural network (Haykin et al., 2009) and a
support vector machine (Bishop et al., 2006) to clas-
sify the structures in two groups: bacilli and non-
bacilli. The neural network was trained using the
Levenberg-Marquardt algorithm. The classifiers were
evaluated using 10-fold cross validation (Witten and
Frank, 2005).
AutomaticIdentificationofMycobacteriumtuberculosisinZiehl-NeelsenStainedSputumSmearMicroscopyImagesusing
aTwo-stageClassifier
187
3 RESULTS AND DISCUSSION
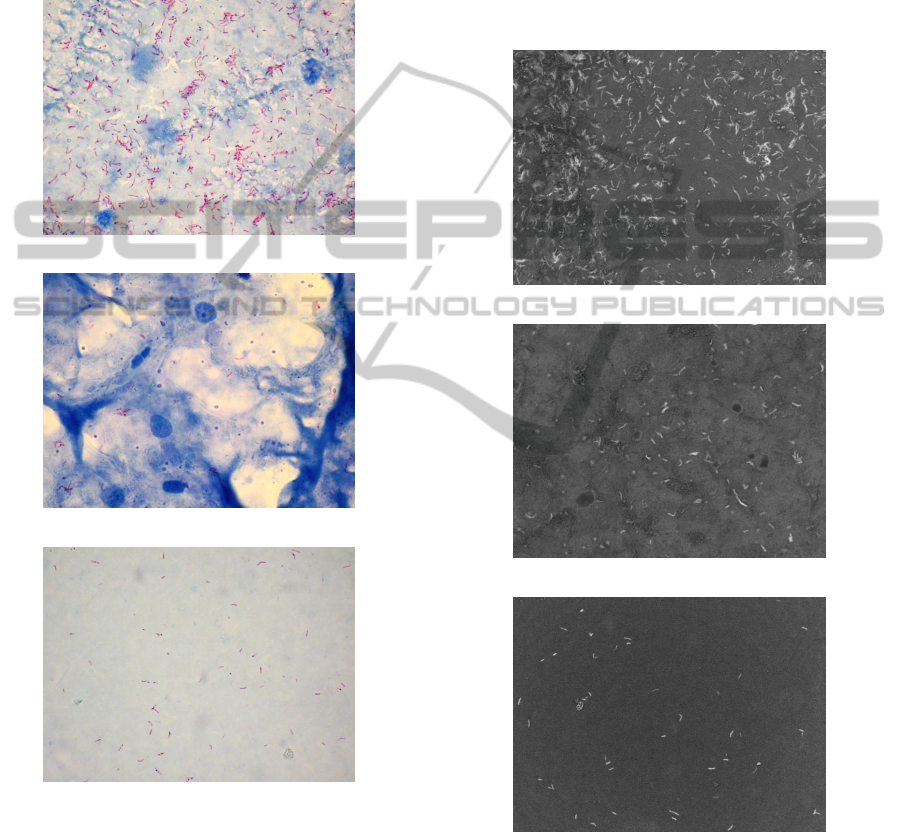
In the first stage of the proposed method, the image
data set was divided into two groups consisting of
sixty images each: a training set and a test set. Figure
2 shows some of the images used in the test set. The
images vary in the number of bacilli and the number
of other structures present in the images.
(a)
(b)
(c)
Figure 2: Examples from the image set.
The projection vector found through Fisher linear
discriminant is
w = [0.5640, −0.8249, −0.0384], (2)
which is equivalent to say that for every pixel in
the original image, we have the linear transformation
given by
I = 0.5640R − 0.8249G − 0.0384B, (3)
where I is the new value of the pixel and R, G, and B
are the red, green, and blue components of the pixel,
respectively.
The projection of the original images shown in
Figure 2 are presented in correspondence in Figure
3. It can be seen that bacilli appear as bright struc-
tures in comparison with the other structures in the
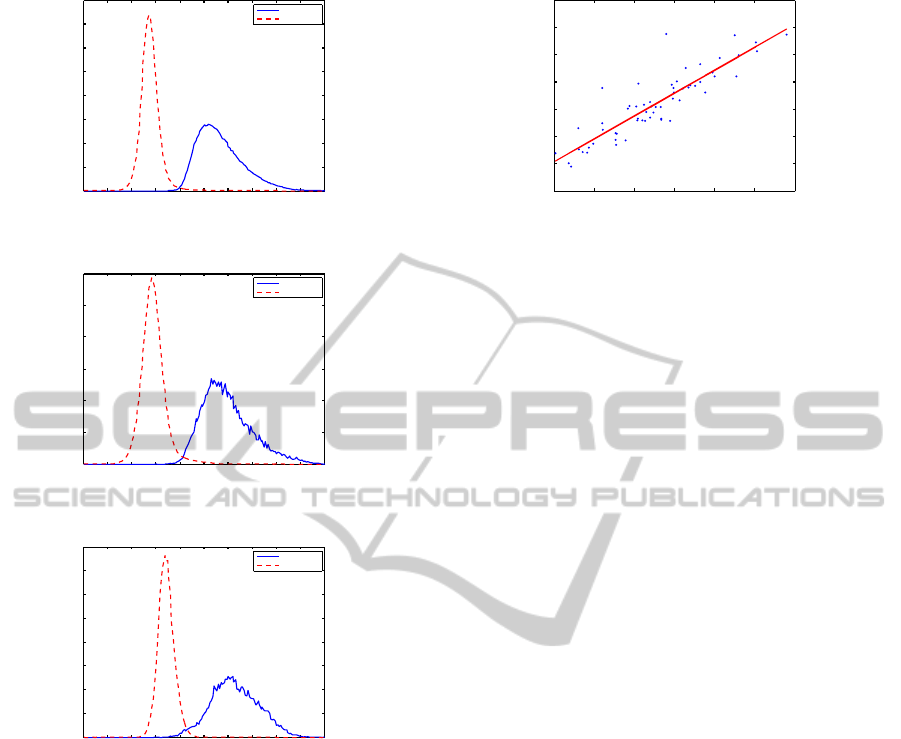
image. Figure 4 presents the histogram of the two
classes of each image, showing the increased separa-
bility between the classes.
(a)
(b)
(c)
Figure 3: Projection of the images shown in Figure 2.
A linear projection has a low computational cost
and, as can be seen in Figures 3 and 4, provides a good
separability between bacilli and background, which
benefits the process of segmentation.
In order to define the threshold for the global
thresholding segmentation, the mean intensity of the
gray scale image was used. The threshold that sepa-
VISAPP2015-InternationalConferenceonComputerVisionTheoryandApplications
188
0 0.1 0.2 0.3 0.4 0.5 0.6 0.7 0.8 0.9 1
0
0.01
0.02
0.03
0.04
0.05
0.06
0.07
0.08
Bacilli
Background
(a)
0 0.1 0.2 0.3 0.4 0.5 0.6 0.7 0.8 0.9 1
0
0.01
0.02
0.03
0.04
0.05
0.06
Bacilli
Background
(b)
0 0.1 0.2 0.3 0.4 0.5 0.6 0.7 0.8 0.9 1
0
0.01
0.02
0.03
0.04
0.05
0.06
0.07
0.08
Bacilli
Background
(c)
Figure 4: Histogram of the imagens shown in Figure 3. The
blue continuous line indicates bacilli, while the red dashed
line indicates non-bacilli (background) pixels.
rates a bacilli pixel from a non-bacilli pixels was de-
fined as the point where the histograms of the two
classes touch each other. It is observed that the re-
lation between the threshold and the mean intensity is
approximately linear as shown in Figure 5. Therefore
a linear regression was performed using the data from
the training set and the first order polynomial obtained
is given by
threshold = 0.8363µ + 0.1444, (4)
where the mean intensity is represented by µ.
Again, the calculus of the mean intensity of a gray
intensity image and its application in a first order
polynomial have a low computational cost.
With the projection vector and the first order poly-
nomial it is possible to segment the image. Figure 6
0.2 0.25 0.3 0.35 0.4 0.45 0.5
0.25
0.3
0.35
0.4
0.45
0.5
0.55
0.6
Mean Intensity
Optimal Threshold
Figure 5: Linear relation between the mean intensity of the
projected image and the optimal threshold. The continuous
line shows the polynomial obtained through linear regres-
sion.
shows the segmented images of the images shown in
Figure 2. For the test set, 98.69% of the bacilli present
in the images were segmented, in comparison with a
loss of 1.31%. Since another classification stage fol-
lows the segmentation stage, the only measure to eval-
uate the segmentation was the number of bacilli seg-
mented in comparison with the percentage of bacilli
lost.
The structures are then filtered according to their
area. Structures with an area smaller than 200 pixels
or greater than 2,600 pixels are not considered in the
rest of the classification process. After this morpho-
logical analysis, 85.61% of the bacilli present in the
test set were segmented in comparison with a loss of
14.39% of bacilli not segmented.
The increase of bacilli lost is mainly due to the
elimination of structures with a large area, because
the bacilli appear as large bacilli clusters in the im-
ages. However, in the image set, the large clusters of
bacilli appears in the images containing a great num-
ber of bacilli, where individual bacilli also appear. For
this reason, the identification of bacilli in the images
is still guaranteed by the system. The small struc-
tures appear when bacilli are partially identified in the
image, mainly due to the focus adjustment made be-
fore the images were taken. Despite the increase on
the loss of bacilli, the elimination of structures with
small and large areas is still important to reduce the
variability of the structures for the next stage.
For the classification of the structures, a k-fold
cross validation method was employed in order to
evaluate the data using different training and test sets.
A multilayer perceptron neural network with one hid-
den layer with twenty neurons and a support vec-
tor machine with a polynomial kernel function of or-
der 5 were used. In the neural network, the hidden
layer uses a sigmoid transfer function as its activation
function while the output layer uses a linear function.
The sensitivity, specificity, accuracy and precision ob-
tained using the neural network are summarized in Ta-
AutomaticIdentificationofMycobacteriumtuberculosisinZiehl-NeelsenStainedSputumSmearMicroscopyImagesusing
aTwo-stageClassifier
189
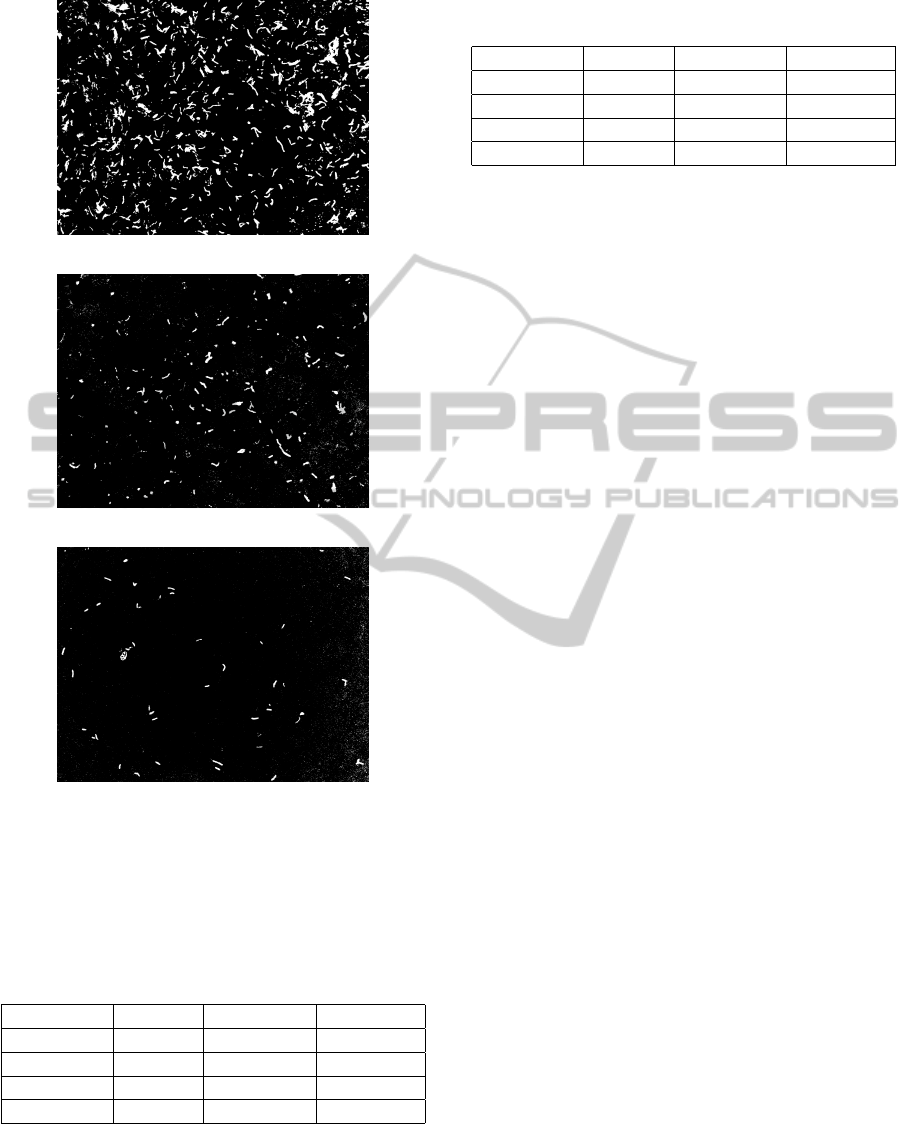
(a)
(b)
(c)
Figure 6: Segmentation of the images shown in Figure 3.
ble 1, showing the maximum, minimum and mean re-
sults obtained. The same results for the support vector
machine are summarized in Table 2.
Table 1: Results from cross validation of the classification
of segmented structures using neural networks.
Mean Maximum Minimum
Sensitivity 86.84 % 94.25 % 79.94 %
Specificity 87.93 % 94.71 % 82.37 %
Accuracy 94.02 % 95.73 % 92.31 %
Precision 88.22 % 92.50 % 81.25 %
The results for sensitivity were greater using neu-
ral networks, even though the results using the two
different classifiers were quite similar. The similar-
ity between the results indicate that the used features
provide a good representation of the structures of each
Table 2: Results from cross validation of the classification
of segmented structures using support vector machines.
Mean Maximum Minimum
Sensitivity 86.24 % 93.35 % 79.23 %
Specificity 88.24 % 95.33 % 82.36 %
Accuracy 94.16 % 95.70 % 92.42 %
Precision 86.79 % 91.84 % 79.65 %
class allowing for an efficient distinction between the
classes.
It is not possible to compare the segmentation re-
sults of this paper with the work done in (Costa Filho
et al., 2012) since the ground truth used for segmenta-
tion is different. In the former, the evaluation is done
considering the number of bacilli segmented ignor-
ing the segmented pixels that do not belong to bacilli,
while in the last the pixels are evaluated individually.
However, the proposed method involves a linear pro-
jection followed by a first order polynomial evalua-
tion and a global thresholding, which is faster than the
neural network used in (Costa Filho et al., 2012), and
it is not subject to overtraining problems that neural
networks may suffer from.
Even though the segmentation part can not be
compared with (Costa Filho et al., 2012), it is pos-
sible to compare the classification of the segmented
structures. In (Costa Filho et al., 2012) the classifica-
tion of structures is evaluated considering sensitivity,
precision and false detection, where false detection is
defined as the ratio of the quantity of noise classified
as bacilli and number of objects classified as bacilli,
being equivalent to (1− precision). Table 3 compares
the results between obtained in (Costa Filho et al.,
2012) and the ones achieved in this paper, where the
best results of both papers were considered. It should
be noted however that cross validation was not used
in the former.
The images used in other works were not accessi-
ble so it was not possible to implement the method-
ology presented in this paper using those images and
compare the results.
4 CONCLUSION
Even though the automatic identification of bacilli in
sputum smear Ziehl-Neelsen stained images is a dif-
ficult task, the proposed method shows that it can
be achieved efficiently and with a low computational
cost.
The main contributions from this paper were the
proposal of a linear projection method based on
Fisher discriminant analysis and the segmentation
based on a first order polynomial that allows the im-
VISAPP2015-InternationalConferenceonComputerVisionTheoryandApplications
190

Table 3: Results comparison between this paper and the one published in (Costa Filho et al., 2012).
Publication Sensitivity (%) Precision (%) False detection (%)
Present paper 94.25 92.50 7.50
Costa Filho et al., 2012 91.53 91.49 8.51
ages segmentation to be fast, and the application of
cross validation to analyze the effectiveness of the
classification of the structures.
ACKNOWLEDGEMENTS
The authors would like to acknowledge the finan-
cial support received from the National Council for
Scientific and Technological Development CNPq,
Brazil. The authors also gratefully acknowledge
CAPES (Brazil) by the financial support to attend at
VISAPP 2015.
REFERENCES
Bishop, C. M. et al. (2006). Pattern recognition and ma-
chine learning, volume 1. springer New York.
CETELI (2014). An image database of conven-
tional sputum smear microscopy for tuber-
culosis. Center for Research and Develop-
ment in Electronic and Information Technology.
http://http://www.tbimages.ufam.edu.br/.
Chayadevi, M. and Raju, G. (2014). Automated colour seg-
mentation of tuberculosis bacteria thru region grow-
ing: A novel approach. In Applications of Digital
Information and Web Technologies (ICADIWT), 2014
Fifth International Conference on the, pages 154–159.
IEEE.
Costa, L. F. and Cesar Jr, R. M. (2000). Shape analysis and
classification: theory and practice. CRC press.
Costa, M. G., Costa Filho, C. F., Sena, J. F., Salem, J., and
de Lima, M. O. (2008). Automatic identification of
mycobacterium tuberculosis with conventional light
microscopy. In Engineering in Medicine and Biology
Society, 2008. EMBS 2008. 30th Annual International
Conference of the IEEE, pages 382–385. IEEE.
Costa Filho, C. F. F., Levy, P. C., Xavier, C. M., Costa,
M. G., Fujimoto, L. B., and Salem, J. (2012). My-
cobacterium tuberculosis recognition with conven-
tional microscopy. In Engineering in Medicine and
Biology Society (EMBC), 2012 Annual International
Conference of the IEEE, pages 6263–6268. IEEE.
Desikan, P. (2013). Sputum smear microscopy in tubercu-
losis: Is it still relevant? volume 137, pages 442–444.
Duda, R. O., Hart, P. E., and Stork, D. G. (2001). Pattern
classification. Wiley, 2nd edition.
Gonzalez, R. C. and Woods, R. E. (2007). Digital Image
Processing. Prentice Hall, 3rd edition.
Haykin, S. S., Haykin, S. S., Haykin, S. S., and Haykin,
S. S. (2009). Neural networks and learning machines,
volume 3. Pearson Education Upper Saddle River.
Kusworo, A., Rahmat, G., Aris, S., Adi, P., Ari, B., and
Nelly, M. (2013). Autothresholding segmentation
for tuberculosis bacteria identification in the ziehl-
neelsen sputum sample. In Proceedings The 7th In-
ternational Conference on Information & Communi-
cation Technology and Systems (ICTS), pages 15–16.
Makkapati, V., Agrawal, R., and Acharya, R. (2009). Seg-
mentation and classification of tuberculosis bacilli
from zn-stained sputum smear images. In Automation
Science and Engineering, 2009. CASE 2009. IEEE In-
ternational Conference on, pages 217–220. IEEE.
Nayak, R., Shenoy, V. P., and Galigekere, R. R. (2010).
A new algorithm for automatic assessment of the de-
gree of tb-infection using images of zn-stained spu-
tum smear. In Systems in Medicine and Biology (IC-
SMB), 2010 International Conference on, pages 294–
299. IEEE.
Sadaphal, P., Rao, J., Comstock, G., and Beg, M. (2008).
Image processing techniques for identifying my-
cobacterium tuberculosis in ziehl-neelsen stains [short
communication]. The International Journal of Tuber-
culosis and Lung Disease, 12(5):579–582.
Siena, I., Adi, K., Gernowo, R., and Miransari, N. (2012).
Development of algorithm tuberculosis bacteria iden-
tification using color segmentation and neural net-
works. International Journal of Video and Image Pro-
cessing and Network Security, 12(4):9–13.
Smart, T. (2007). Background on smear microscopy in tb
diagnosis. http://www.aidsmap.com/Background-on-
smear-microscopy-in-TB-diagnosis/page/1426650/.
Sotaquir
´
a, M., Rueda, L., and Narvaez, R. (2009). Detec-
tion and quantification of bacilli and clusters present
in sputum smear samples: a novel algorithm for pul-
monary tuberculosis diagnosis. In Digital Image
Processing, 2009 International Conference on, pages
117–121. IEEE.
WHO (2014). Tuberculosis (tb). World Health Organiza-
tion. http://www.who.int/tb/.
Witten, I. H. and Frank, E. (2005). Data Mining: Practi-
cal machine learning tools and techniques. Morgan
Kaufmann.
Zhai, Y., Liu, Y., Zhou, D., and Liu, S. (2010). Automatic
identification of mycobacterium tuberculosis from zn-
stained sputum smear: Algorithm and system design.
In Robotics and Biomimetics (ROBIO), 2010 IEEE In-
ternational Conference on, pages 41–46. IEEE.
AutomaticIdentificationofMycobacteriumtuberculosisinZiehl-NeelsenStainedSputumSmearMicroscopyImagesusing
aTwo-stageClassifier
191
