
A Framework for Analysing Dynamic Communities in Large-scale Social
Networks
Vítor Cerqueira, Márcia Oliveira and João Gama
LIAAD/INESC TEC, Rua Dr. Roberto Frias, 4200-464 Porto, Portugal
Keywords:
Community Dynamics, Community Selection, Network Sampling, Large-scale Networks, Social Networks,
CDR Data.
Abstract:
Telecommunications companies must process large-scale social networks that reveal the communication pat-
terns among their customers. These networks are dynamic in nature as new customers appear, old customers
leave, and the interaction among customers changes over time. One way to uncover the evolution patterns of
such entities is by monitoring the evolution of the communities they belong to. Large-scale networks typically
comprise thousands, or hundreds of thousands, of communities and not all of them are worth monitoring, or
interesting from the business perspective. Several methods have been proposed for tracking the evolution of
groups of entities in dynamic networks but these methods lack strategies to effectively extract knowledge and
insight from the analysis. In this paper we tackle this problem by proposing an integrated business-oriented
framework to track and interpret the evolution of communities in very large networks. The framework en-
compasses several steps such as network sampling, community detection, community selection, monitoring
of dynamic communities and rule-based interpretation of community evolutionary profiles. The usefulness of
the proposed framework is illustrated using a real-world large-scale social network from a major telecommu-
nications company.
1 INTRODUCTION
A manifold of phenomena in the real-world can be
naturally represented through dynamic graphs, which
are able to capture the state of the underlying net-
work at different moments in time. It has been shown
that several real-world networks display community
structure (Newman and Girvan, 2004). Communities
can be defined as a set of entities that are more con-
nected with each other than with other entities in the
network. The problem of community detection has
been widely studied in the literature (Fortunato, 2010)
but typically the proposed methods provide a static
representation of the community structure in the net-
work at a given time point. However, most networks
have a dynamic nature, since they undergo frequent
changes, featured by a series of temporal events, such
as growth, decay or dispersion.
From a business perspective, analysing how com-
munities of customers evolve and behave over time
is relevant because it allows, for instance, to un-
derstand changes in customers’ consumption patterns
and get insight into which communities are growing
and which ones are fading. This sort of information is
useful to redefine marketing strategies, identify influ-
ential customers or customise promotional campaigns
according to characteristics shared by customers be-
longing to a given community. Marketeers can also
take actions to proactively prevent customer churn
and devise recommendation systems of products and
services that improve the quality of the consumption
experience. Hitherto, studies involving social net-
works of customers have focused on the churn predic-
tion problem (Verbeke et al., 2014) and on the detec-
tion of influential nodes for viral marketing (Domin-
gos and Richardson, 2001; Wang et al., 2010). Here,
we address a more general problem, related to the de-
tection, selection, dynamic analysis and interpretation
of relevant communities of customers, by proposing a
novel and integrated business-oriented framework for
dynamic community mining in large social networks.
The insights provided by the application of our frame-
work can be harnessed and used as input to solve the
aforementioned marketing problems.
The problem of tracking communities over time
is not new and several methodologies have been pro-
posed to this end (Berger-Wolf and Saia, 2006; Asur
et al., 2009; Brodka et al., 2013; Oliveira et al., 2014).
235
Cerqueira V., Oliveira M. and Gama J..
A Framework for Analysing Dynamic Communities in Large-scale Social Networks.
DOI: 10.5220/0005345602350242
In Proceedings of the 17th International Conference on Enterprise Information Systems (ICEIS-2015), pages 235-242
ISBN: 978-989-758-096-3
Copyright
c
2015 SCITEPRESS (Science and Technology Publications, Lda.)

Generally, these methodologies rely on analysing the
community structure of the dynamic network at con-
secutive time points over the time span. However,
these methods may not be well suited for large-scale
networks, with thousands or hundreds of thousands of
communities. As we enter the era of Big Data, our ca-
pacity to accumulate and store data has increased con-
siderably. The size of data poses challenges to con-
ventional methods and hampers the ability to process
and extract actionable knowledge from data. Besides,
these methodologies lack strategies to effectively ex-
tract knowledge and insight from the analysis, since
they focus on the description of the life-cycle of com-
munities and neglect the community profiling step.
These constraints call for upgrades and improvements
of the traditional methods. In this context, we pro-
pose an integrated business-oriented framework to se-
lect, monitor and characterise evolving communities
in large-scale social networks. Although our frame-
work is built on existing methods, it is novel in the
way it integrates them, thus offering a complete step-
by-step procedure to extract valuable business insight
from the analysis of massive social networks. To the
best of our knowledge, we are also the first to pro-
pose a business interpretation of the communities evo-
lution. The framework was empirically applied to a
large-scale social network from a major telecommu-
nications company. The remaining paper is structured
as follows. In Section 2, the foundations of the frame-
work are explained. The proposed framework is de-
scribed in Section 3 and the case study in which the
framework was applied is presented in Section 4. We
conclude and discuss the results in Section 5.
2 BACKGROUND
Finding the community structure of a network is a
prevalent strand of research because it allows a high-
level exploration of the network and a better under-
standing of its overall structure. Besides, the com-
munity structure can represent a summary of a large
network, uncovering hidden properties of its elements
without loss of personal information. However, al-
though there are several different approaches to com-
munity detection, the nature of the problem makes it
a complex one. Not only because of the inherent sub-
jectivity and lack of a consensual definition of com-
munity, but also due to the need for efficiency posed
by the increased data availability (Fortunato, 2010).
Furthermore, people usually belong to different com-
munities (e.g., family, friends, work), which leads to
an overlapping structure of communities (Palla et al.,
2005). As opposed to typical clustering analysis
approaches, community detection algorithms do not
usually incorporate information about the attributes of
nodes, focusing essentially on the link structure of the
network. There are different approaches to commu-
nity detection, such as hierarchical clustering, clique-
based methods, divisive algorithms (Girvan and New-
man, 2002), partitional clustering or modularity opti-
misation (Newman and Girvan, 2004). The commu-
nity detection algorithm adopted in our framework is
based on the latter. Formally, modularity measures
the deviation from the possibility of links of commu-
nities having been generated by the natural commu-
nity structure and the possibility of those links having
been randomly generated. Modularity has been used
for comparing the quality of partitions generated by
different methods, but it is also an objective function
for several community detection algorithms that is in-
tended to maximize. Blondel et al. (2008) introduced
the Louvain method for the detection of communities
in large-scale networks. The Louvain method is an
heuristic method based on a greedy hierarchical opti-
misation of the modularity function. In the hierarchi-
cal structure, the network displays several levels of
partitions, where small communities are merged into
larger ones. The algorithm is non-deterministic and
order-sensitive, so it does not guarantee a maximum
global modularity. Nonetheless, it is able to discover
high-quality network partitions, as measured by the
modularity function, beating any other algorithm in
terms of computational time (Blondel et al., 2008).
Besides, it is highly intuitive and easy to implement.
These characteristics motivated the choice of the Lou-
vain Method for performing community detection in
this work. The algorithm comprises two phases that
are iterated until no more modularity gains can be
achieved. Initially, the algorithm unfolds the com-
munities, performing a local modularity optimisation.
Then, the network is rebuilt, with the nodes being the
communities detected in the first phase. The size of
the hierarchy is given by the number of combinations
of these two phases.
Networks have a dynamic nature. As a con-
sequence, the corresponding community structure
evolves over time. Everyday there are events that
change a person’s life in some way, and eventually it
may affect that person’s relationship with other peo-
ple in the same community he belongs to. Hence,
traditional methods for community detection must be
updated or, alternatively, complemented with method-
ologies for monitoring the dynamics of communities.
The typical strategy to analyse the evolution of com-
munities over a given time span is to take snapshots
of the network at consecutive time points and, then,
to detect communities at each one of these snapshots
ICEIS2015-17thInternationalConferenceonEnterpriseInformationSystems
236

Figure 1: Representation of the transitions and the life-
cycle of communities in a time span comprised of four time
points. For instance, the life-cycle of C
3
is: it firstly appears
in t
2
and survives from t
2
to t
3
into C
3
, keeping 47% of its
previous elements. From t
3
to t
4
, C
3
merges with C
1
, giving
rise to community C
1
in time point t
4
.
(Brodka et al., 2013; Oliveira et al., 2014). By com-
paring the proportion of shared elements by instances
of communities found at consecutive time points, it is
possible to detect and categorise the transitions under-
gone by the communities.
In our framework, we apply the MECnet frame-
work (Oliveira et al., 2014) to monitor the evolution
of communities. The methodology of MECnet ex-
plores the concept of community mapping by using
conditional probabilities. Each pair of possible con-
nections between communities detected at consecu-
tive time points is evaluated based on the proportion
of mutual elements shared by both communities. This
mapping procedure enables the detection of transi-
tions, which are further used to describe the life-cycle
of each dynamic community. The life-cycle sum-
marises the evolution of the dynamic community over
the time span (see Figure 1).
In the MECnet framework, the taxonomy used for
the evaluation of transitions at consecutive time points
consists of five external events: birth, split, merge,
survival and death. These events were formally de-
fined by Oliveira and Gama (2010).
3 FRAMEWORK
In this section, we explain each step of the proposed
framework for analysing the dynamics of communi-
ties in large-scale networks. This framework covers
the following five main steps. 1) An unbiased sam-
pling method for both direct and undirected large-
scale networks is applied; 2) The Louvain method is
run for each snapshot of the sampled network in order
to identify communities; 3) Due to the large number
of communities typically discovered during the com-
munity detection stage, the communities are further
filtered according to two business criteria explained
ahead; 4) The selected communities are monitored
over the time span using the MECnet framework; 5)
A community profiling is performed, in order to eval-
uate and understand the evolution of communities.
These steps will be detailed in the next subsections.
The analysis of large-scale networks requires
large working memory and powerful processors to ex-
tract useful knowledge from these data. However, not
all companies have access to these resources, or the
time needed to perform the analysis prevents them to
get insight from the data in a timely manner. One
possible way to circumvent this problem is to focus
the analysis on a representative sample of the full net-
work. The goal of sampling techniques is then to
obtain a representative fragment of the network that
keeps its structural properties.
The Metropolis-Hastings Random Walk (Gjoka et al.,
2010) is an unbiased sampling method that provides
good results that works as follows. First, it considers
a node v from the network and sets a stopping crite-
rion. While this criterion is not met, the algorithm
(i) searches and randomly selects a node w, from the
neighbours of v, and generates an α from the uniform
distribution U(0, 1); (ii) compares α with
k
v
k
w
, where
k
v
and k
w
represent the number of neighbours of v
and w, respectively; (iii) if α ≤
k
v
k
w
then v is accepted
and included in the sample, turning w into the refer-
ence node; otherwise, another w is picked from the
neighbours of v. This "if clause" is what keeps the al-
gorithm from biasing to nodes with a high number of
neighbours.
After extracting a sample of the network, the com-
munities are detected at each considered time point,
using the Louvain Method (Blondel et al., 2008). The
algorithm takes as input a weighted edge list. The al-
gorithm associates to each network element the index
of the community that it belongs to and it also dis-
plays the modularity of the generated partition. Fig-
ure 2 shows the representation of a network and its
underlying communities.
Figure 2: Representation of a network and its underlying
communities: C
1
, C
2
and C
3
(adapted from Oliveira and
Gama (2012)).
In large-scale networks, community detection al-
gorithms typically generate partitions with thousands,
or hundreds of thousands, of communities. Since it
AFrameworkforAnalysingDynamicCommunitiesinLarge-scaleSocialNetworks
237

is not feasible to analyse the whole set of communi-
ties and given that the majority of communities is not
interesting from the business point of view, it is im-
portant to incorporate a community selection step in
the process. In the proposed methodology, we per-
form community selection based on two criteria: (i)
the size of communities, and (ii) a RFM (Recency,
Frequency, Monetary) model.
In real-world large-scale social networks, such as
telecom graphs, the size distribution of the detected
communities usually follows a power-law (Nanavati
et al., 2008). A power-law is a relation between two
variables that occurs when one is the power of the
other, drawn from a probability distribution p (x) =
βx
−α
, where α is the constant scaling parameter of the
distribution. In the particular case of communities,
this phenomenon is associated with the sharp positive
asymmetric distribution of the number of elements in
each community. There are usually a large number
of communities containing only a few elements and
only a small number of communities with consider-
able size.
In order to test the hypothesis "the distribution of
the size of communities follows a power-law", we run
several tests using the poweRlaw package, available in
the R software (Team, 2008). Afterwards, to estimate
where to cut the distribution, we first sort the detected
communities by decreasing size. Then, we analyse
the decay in the number of elements covered in the
network, for each percentage of considered commu-
nities. The cut is made where a natural break of the
distribution occurs, according to the so-called elbow
method. Although this is an empirical procedure, it
is efficient in selecting the communities representing
the largest portion of the network.
The RFM (Recency, Frequency, Monetary) model
(Birant, 2011) is a marketing strategy used to quan-
titatively determine the best customers of a company
according to the following three components: (i) re-
cency, which in the context of our framework refers
to the average time elapsed since the last time an el-
ement of a community used the service (e.g., average
time elapsed between calls); (ii) frequency, which is
given by the average number of times the elements of
each community used the service during a given time
span (e.g., average number of calls made in one week)
and, (iii) monetary, which is given by the total amount
spent in the service by the elements of the community
(e.g., phone bill).
To implement the model, the values of each one of
these components are computed for each community
and, then, converted into a score from 1 to 5. For in-
stance, the 20% communities with higher frequency
are given a score 5 in the frequency component, the
next 20% communities are given a score of 4, and so
on. An overall score is then assigned to each commu-
nity, by summing up the scores obtained in each com-
ponent (i.e., recency, frequency and monetary). In
a weighted version of the model (Miglautsch, 2000),
each component is multiplied by a weight, which re-
flects its relative importance.
In the particular case of communities in large-
scale networks, the RFM analysis supports the de-
cision about which communities may be discarded
from the study, and which communities are worth
analysing from the business point of view. In other
words, this model provides a simple way to extract the
most active and profitable communities of customers,
which are the ones more likely to spread positive in-
fluence in the network.
The communities selected based on the previous
criteria are monitored over time, by applying the
MECnet framework. This temporal tracking relies on
a prior mapping step, as previously explained in Sec-
tion 2. The identification of temporal instances of the
same community, based on the matching criterion, al-
lows the further identification of transitions and the
characterisation of a community’s life-cycle.
After analysing how communities evolve over
time, it is important to characterise this evolution
by creating a profile for each dynamic community.
The task of community profiling is important to un-
derstand how one community differs from another,
as well as to understand the underlying logic of the
partitions identified by the community detection al-
gorithm. This profiling step is important to compa-
nies because it enables a better understanding of the
dynamic community analysis, thus allowing them to
more easily act upon these customer communities.
Communities are described in operational and rela-
tional terms. While the operational description is
related to business variables, the relational descrip-
tion is based on classical measures from social net-
work analysis (see Oliveira and Gama (2012) for an
overview). In order to find the general profile of
communities, several attributes from the elements that
compose them are studied, such as frequency and du-
ration of calls, as well as node centrality measures.
The profiling task is then performed using decision
trees, which can be linearized into interpretable deci-
sion rules.
Communities are classified into one of three
classes: growth, stagnation or decay, according to
their evolution over the time span. The type of evolu-
tion exhibited by each community relies on the anal-
ysis of their life-cycle (see Sections 2 and 3) and is
based on changes in the size of communities (i.e.,
number of elements) over the time span: Growth, if
ICEIS2015-17thInternationalConferenceonEnterpriseInformationSystems
238

the community survives with sequential increase in
its size; stagnation, if the community survives with
slight oscillations in its size; and decay, if the com-
munity survives but shrinks in size or splits in two or
more communities.
To discriminate between different evolution pat-
terns we use decision trees. In the context of com-
munity profiling, this type of model can be used to
achieve two main goals: (i) upon arrival of a new ele-
ment to the network, predict in which community this
element fits, using solely its attributes, and (ii) obtain
a better understanding of the general properties and
interactions among the communities. Each path of the
tree, from the root to a leaf, represents a decision rule.
Due to their high interpretability, we will use decision
rules to generate the profile of each community. This
is particularly important because it allows for business
users with no technical skills to easily understand the
model.
4 CASE STUDY
The proposed framework was empirically applied to a
large-scale social network from a major telecommu-
nications company. The dataset contains hundreds of
millions of phone call records, which correspond to a
six month time span. These call records are mapped
into an undirected weighted network, where nodes
represent customers (namely, mobile users), links rep-
resent phone calls and the weight of the links indi-
cates the frequency of communication among pairs of
customers. The network is sparse and is only built
implicitly by means of a weighted edge list. The ap-
plication of the sampling method to the whole net-
work generated a manageable network, with a consid-
erable lower size (see Table 1). The sampled network
was broken down by month, originating six subsets
that are analysed separately. The size of the sampled
networks in each month is given in Table 1. After-
wards, we run the Louvain method, whose results are
shown in Table 2. Typically, a good partition of the
network in communities should present modularity
values above 0.3 (Clauset et al., 2004). The average
modularity obtained for each subset of the analysed
network was approximately 0.9, which indicates the
existence of a meaningful community structure for all
analysed time points.
As can be ascertained from Table 2, the number
of detected communities is large. However, not all of
these communities are interesting or worth analysing.
In an attempt to identify the most relevant commu-
nities to the telecommunications company, i.e., the
largest, most profitable and most active communities,
Table 1: Size of the edge list representing the network, in
terms of the number of edges and the total phone calls made,
from July to December.
Month Edges ×10
6
Phone calls ×10
6
July 2.2 21.2
August 2.0 18.2
September 2.0 18.8
October 2.0 19.3
November 2.0 18.0
December 2.9 23.2
Table 2: Number of communities and modularity returned
by the Louvain Method, for each month.
Month Communities Modularity
July 7.495 0,90
August 5.033 0,91
September 5.988 0,91
October 5.668 0,90
November 5.678 0,90
December 5.610 0,89
we resort to the criteria introduced in Section 3 to per-
form the selection. Regarding the first criterion (size
of communities), there is empirical evidence that the
size of communities follows a power-law distribution
with a scaling parameter 1.96, as indicated by 2412
out of 2500 statistical tests. According to the size dis-
tribution of the detected communities, only the 3%
biggest communities are considered, covering more
than 98% of customers in the network.
The set of communities is further restricted by apply-
ing a weighted RFM model. This model allows the
identification of the most profitable and active com-
munities, discarding the ones that are less interest-
ing for the company. The weights assigned to each
one of the RFM components were set by the business
intelligence analyst of the telecommunications com-
pany based on his domain knowledge. Monetary is
the component with the highest weight (w
monetary
=
0.6), followed by recency (w
recency
= 0.25) and fre-
quency (w
f requency
= 0.15). The number of commu-
nities which were selected based on these two criteria
are: July: 208; August: 210; September: 192; Octo-
ber: 170; November: 170; December: 174.
The dynamics of communities selected in the pre-
vious step were analysed using the MECnet frame-
work (Oliveira et al., 2014). In Figure 3, the life-cycle
of four stable communities is depicted. From the fig-
ure, we observe that the communities are stable over
the time span, even though the weight of the edges,
i.e., the proportion of mutual elements shared by each
pair of communities, is below 0.5. This may be re-
lated to the inherent volatility of customers’ commu-
nication patterns. With the increasing use of comput-
AFrameworkforAnalysingDynamicCommunitiesinLarge-scaleSocialNetworks
239
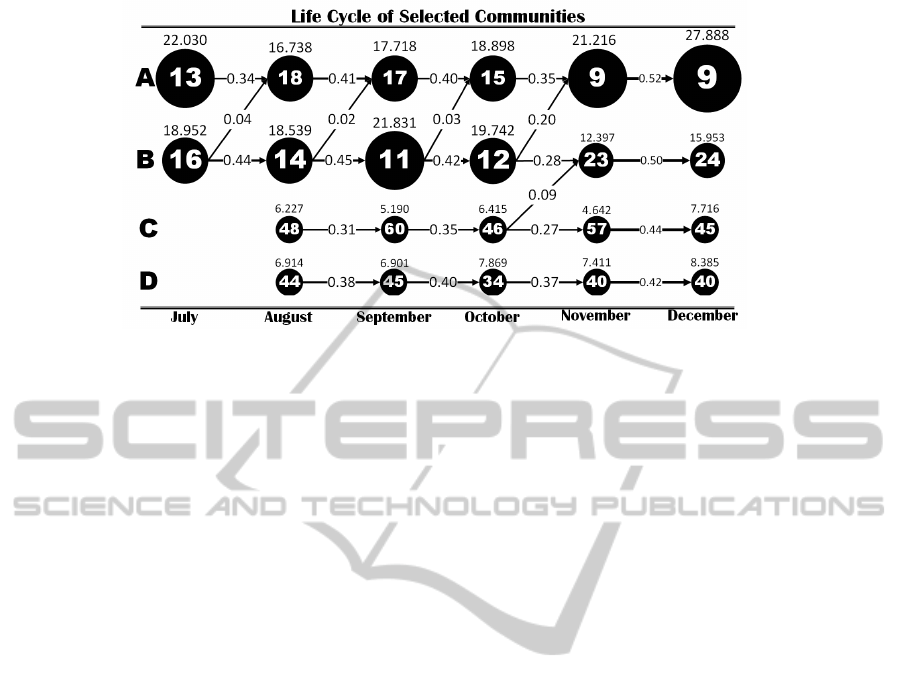
Figure 3: Life-cycle of four communities, from July to December. Each dynamic community is identified by a letter (from
A through D). The number inside each community, represented by a circle, symbolises its relative order, according to size, in
the corresponding month. The weights of the edges represent the proportion of elements that migrate between communities
found at consecutive months. The number above each community represents its size, or number of elements.
ers and other digital devices, people tend to resort to
other means of communication, such as online social
networks, to communicate with each other. Despite
this, there is a core set of customers whose communi-
cation patterns persist over time. These are the ones
responsible for keeping the community active during
the considered time span. From the evolution graph of
Figure 3, we can also observe an interesting interac-
tion between community A and community B. From
July until November, customers from community B
migrate to community A. In October, this migration
is stronger because it involves the core customers of
community B (i.e., those with highest node centrality)
and their direct neighbours. Even though this is an
important result, it is also inconclusive, not only due
to the subjective nature of the data, but also because
of the non-deterministic properties of the community
detection algorithm. However, we can conclude that
the two communities are close to each other in the
network structure, which might explain the strong in-
teraction between their customers.
After selecting the set of interesting communities,
a profile of each community is created based on both
the classification introduced in Section 3 and the rules
generated by a decision tree classifier. In what re-
gards the type of evolution, the analysis of both the
life-cycle and size of communities returned the fol-
lowing classification: community A is growing, com-
munity B is decaying and communities C and D are
stagnated. Also, there is a significant difference be-
tween growing and non-growing communities regard-
ing frequency, recency and transitivity (see Figure 4).
Frequency and recency were already defined in Sec-
tion 3. Transitivity is a social network analysis mea-
sure, which gives the probability of two individuals
that are connected to a third individual, to be also con-
nected to each other. From Figure 4, we deduce that
growing communities are associated with a higher av-
erage frequency of calls, a higher transitivity and a
lower latency of calls made by their elements. In
other words, growing communities are the most ac-
tive ones and display a more consistent topology. Be-
sides performing this classification, we also applied
a decision tree classifier, where each observation is a
customer and the class is the community the customer
belongs to. For this task, we focused on the core
customers of each community, because these do not
change their community membership over the consid-
ered time span. In theory, these persistent customers
are the ones that better reflect the general properties of
the communities. In order to apply the decision tree,
first we perform feature selection using a Manhattan
distance based algorithm. The chosen variables were:
(i) average frequency of calls, (ii) average duration
of calls (in seconds), (iii) degree centrality, (iv) be-
tweenness centrality, (v) closeness centrality and (vi)
local transitivity. Then, it is built a fit classification
model, using the c5.0 algorithm (Quinlan, 1993). For
evaluating the classifier we used the holdout method,
with 70% of the dataset used for training and 30% for
test. Below are the generated rules for the communi-
ties depicted in Figure 3, which obtained the highest
lift measure.
1. If Frequency > 51 and
Duration ≤ 134 and
Degree ≤ 0.001 and
Betweenness > 0.004 and
0.030 < Closeness ≤ 0.032
then Community A [Lift 4.1]
2. If 45 < Frequency ≤ 130 and
ICEIS2015-17thInternationalConferenceonEnterpriseInformationSystems
240

82 < Duration ≤ 109 and
0.0002 < Degree ≤ 0.0004 and
Betweenness ≤ 0.0002 and
Closeness ≤ 0.026
then Community B [Lift 4.9]
3. If Degree > 0.002 and
Betweenness > 0.01 and
Closeness ≤ 0.028
then Community C [Lift 23.9]
4. If Frequency ≤ 102 and
0.0012 < Degree ≤ 0.0024 and
Closeness > 0.026
then Community D [Lift 7.9]
Because the communities are sparse, as is the net-
work itself, the centrality values of the customers per-
taining to each community are low. However, there
is a clear difference in terms of centrality values be-
tween the community that is declining (community B)
and the ones that are stagnated or growing. Accord-
ing to rule number 2, community B is comprised of
customers with low node centrality. These two facts
(Community B declining and showing low central-
ity values) may be correlated. The community is not
overall consistent and ’influence’ is not well spread
across all people is the community. Communities C
and D have reasonable degree centralities, in compar-
ison with the other two communities, probably due to
their relative reduced size. Even though community
A has better closeness centrality, this measure is sim-
ilar for all communities. Closeness gives a hint about
the topology of the network, i.e., how fast individuals
reach all others inside their community. In short, we
were able to find rules for the studied communities
which, not only outline their profile, but also quantify
their distinguishing properties.
5 CONCLUSIONS
From a business point of view, analysing common
properties of groups of customers helps to support
the decision making of marketeers. Several frame-
works have been proposed to study the dynamics of
communities in networks. However, these method-
ologies may not be well suited to deal with large-
scale networks, which are typically characterised by a
large number of communities. In this paper, we tackle
this problem by proposing an integrated and business-
oriented framework for selecting a subset of interest-
ing communities, tracking their evolution over time,
and characterise their properties in a comprehensible
way. A case study using a large-scale network from
a telecommunications company showed the applica-
bility and usefulness of the proposed framework. The
modularity obtained by the community detection al-
gorithm returned values around 0.90, in all six time-
points. This shows that there is a meaningful com-
munity structure in the studied network. Based on
multiple criteria, we then selected the most interest-
ing communities in the network, from the business
perspective. By applying the MECnet framework, we
monitored the evolution of those communities. With
a monthly interval between each mapping procedure,
we verified stability in the comunities over the time
span. Although we consider that there is an overall
good consistency, the weight of the edges is gener-
ally low, which may be related to the communication
patterns of the general population. Exploring the pro-
file of communities, we concluded that growing com-
munities are associated with higher activity measures,
such as frequency and recency of calls, and an overall
transitivity of their individuals. Also, using a decision
trees algorithm, we were able to create a general pro-
file of the communities, based on the attributes of the
individuals that comprise them. The community de-
tection algorithm is non-deterministic, which makes
it difficult to obtain a good understanding of the evo-
lution of communities over time. Nonetheless, the
analysis was performed over high-level communities,
i.e., the communities located at the top of the hier-
archy produced by the Louvain method, which com-
prise the smaller ones. For future work, one way to
better understand the consistency of the large commu-
nities over time, would be to ’zoom’ into the hierar-
chy of communities, and to focus the analysis on the
smaller core of the large communities. These might
be the ones that essentially drive the dynamics of the
large communities.
ACKNOWLEDGEMENTS
This work was supported by Sibila research
project (NORTE-07-0124-FEDER-000059), financed
by North Portugal Regional Operational Programme
(ON.2 O Novo Norte), under the National Strategic
Reference Framework (NSRF), through the Develop-
ment Fund (ERDF), and by national funds, through
the Portuguese funding agency, Fundação para a
Ciência e a Tecnologia (FCT), by European Com-
mission through the project MAESTRA (Grant num-
ber ICT-2013-612944).Márcia Oliveira gratefully ac-
knowledges funding from FCT, through Ph.D. grant
SFRH/BD/81339/2011.
AFrameworkforAnalysingDynamicCommunitiesinLarge-scaleSocialNetworks
241
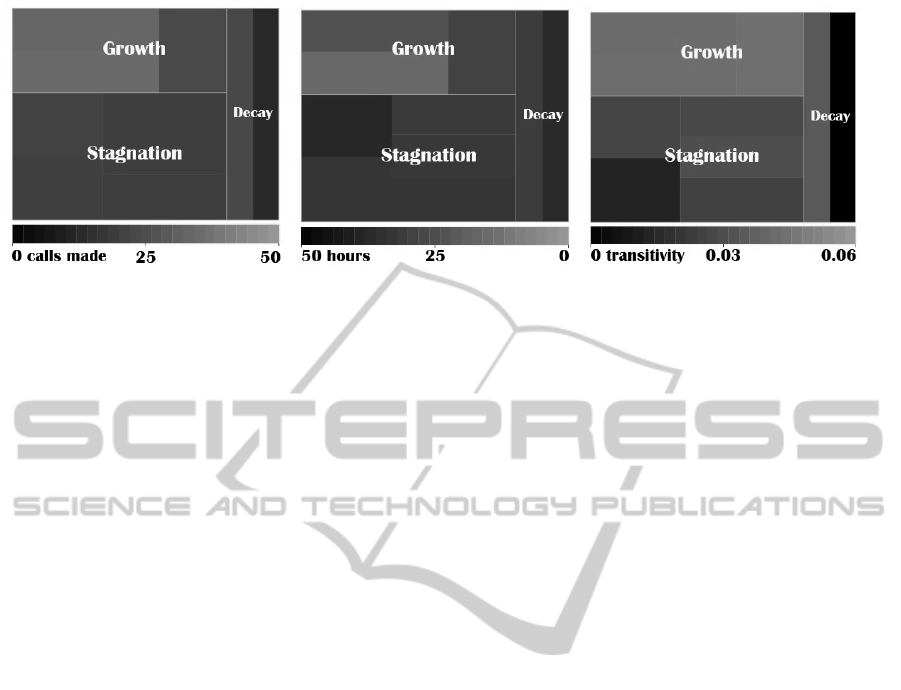
(a) Frequency (b) Recency (c) Transitivity
Figure 4: Relative analysis of the frequency, recency and transitivity values of the selected communities. Each rectangle
represents a community. The size of the largest rectangles represent the contribution of each class to the revenue of the
company (i.e., the monetary component). Brighter regions indicate higher frequency, lower recency and higher transitivity
values.
REFERENCES
Asur, S., Parthasarathy, S., and Ucar, D. (2009). An event-
based framework for characterizing the evolutionary
behavior of interaction graphs. ACM Transactions on
Knowledge Discovery from Data, 3(4):16:1–16:36.
Berger-Wolf, T. Y. and Saia, J. (2006). A framework for
analysis of dynamic social networks. In Proceedings
of the 12th ACM SIGKDD International Conference
on Knowledge Discovery and Data Mining, KDD ’06,
pages 523–528, New York, NY, USA. ACM.
Birant, D. (2011). Knowledge-oriented applications in data
mining. In (Ed.), P. K. F., editor, Data Mining Using
RFM Analysis, pages 91–108. INTECH Open Access
Publisher.
Blondel, V., Guillaume, J., Lambiotte, R., and Mech, E.
(2008). Fast unfolding of communities in large net-
works. J. Stat. Mech, 10:1–12.
Brodka, P., Saganowski, S., and Kazienko, P. (2013).
Ged: the method for group evolution discovery in so-
cial networks. Social Network Analysis and Mining,
3(1):1–14.
Clauset, A., Newman, M. E. J., and Moore, C. (2004). Find-
ing community structure in very large networks. Phys-
ical Review E, 70(6):066111.
Domingos, P. and Richardson, M. (2001). Mining the
network value of customers. In Proceedings of the
seventh ACM SIGKDD international conference on
Knowledge discovery and data mining, pages 57–66.
ACM.
Fortunato, S. (2010). Community detection in graphs.
Physics Reports, 486(3-5):75 – 174.
Girvan, M. and Newman, M. E. J. (2002). Com-
munity structure in social and biological networks.
Proceedings of the National Academy of Sciences,
99(12):7821–7826.
Gjoka, M., Kurant, M., Butts, C. T., and Markopoulou, A.
(2010). Walking in Facebook: A Case Study of Unbi-
ased Sampling of OSNs. In Proceedings of IEEE IN-
FOCOM ’10, INFOCOM’10, pages 2498–2506, San
Diego, California, USA. IEEE Press.
Miglautsch, J. R. (2000). Thoughts on RFM scoring. The
Journal of Database Marketing, 8(1):67–72.
Nanavati, A. A., Singh, R., Chakraborty, D., Dasgupta, K.,
Mukherjea, S., Das, G., Gurumurthy, S., and Joshi,
A. (2008). Analyzing the structure and evolution of
massive telecom graphs. Knowledge and Data Engi-
neering, IEEE Transactions on, 20(5):703–718.
Newman, M. E. J. and Girvan, M. (2004). Finding and eval-
uating community structure in networks. Phys. Rev. E,
69(2):026113.
Oliveira, M. and Gama, J. (2012). An overview of social
network analysis. Wiley Interdisciplinary Reviews:
Data Mining and Knowledge Discovery, 2(2):99–115.
Oliveira, M. D. B. and Gama, J. a. (2010). Mec - monitoring
clusters’ transitions. In Agotnes, T., editor, STAIRS,
volume 222 of Frontiers in Artificial Intelligence and
Applications, pages 212–224. IOS Press.
Oliveira, M. D. B., Guerreiro, A., and Gama, J. (2014). Dy-
namic communities in evolving customer networks:
an analysis using landmark and sliding windows. So-
cial Netw. Analys. Mining, 4(1):1–19.
Palla, G., Derényi, I., Farkas, I., and Vicsek, T. (2005).
Uncovering the overlapping community structure of
complex networks in nature and society. Nature,
435(7043):814–818.
Quinlan, J. R. (1993). C4.5: Programs for Machine Learn-
ing. Morgan Kaufmann Publishers Inc., San Fran-
cisco, CA, USA.
Team, R. D. C. (2008). R: A Language and Environment
for Statistical Computing. R Foundation for Statistical
Computing, Vienna, Austria. ISBN: 3-900051-07-0.
Verbeke, W., Martens, D., and Baesens, B. (2014). Social
network analysis for customer churn prediction. Ap-
plied Soft Computing, 14:431–446.
Wang, Y., Cong, G., Song, G., and Xie, K. (2010).
Community-based greedy algorithm for mining top-
k influential nodes in mobile social networks. In
Proceedings of the 16th ACM SIGKDD international
conference on Knowledge discovery and data mining,
pages 1039–1048. ACM.
ICEIS2015-17thInternationalConferenceonEnterpriseInformationSystems
242
