
Dynamic Modeling of Twitter Users
Ahmed Galal and Abeer ElKorany
Department of Computing Science, Faculty of Computers and Information, Cairo University, Cairo, Egypt
Keywords: Dynamic User Modeling, Social Networks, Similarity Measurement, Topical Interest, User Behavior.
Abstract: Social Networks are popular platforms for users to express themselves, facilitate interactions, and share
knowledge. Today, users in social networks have personalized profiles that contain their dynamic attributes
representing their interest and behavior over time such as published content, and location check-ins. Several
proposed models emerged that analyze those profiles with their dynamic content in order to measure the
degree of similarity between users. This similarity value can be further used in friend suggesting and link
prediction. The main drawback of the majority of these models is that they rely on a static snapshot of
attributes which do not reflect the change in user interest and behavior over time. In this paper a novel
framework for modeling the dynamic of user’s behavior and measuring the similarity between users’
profiles in twitter is proposed. In this proposed framework, dynamic attributes such as topical interests and
the associated locations in tweets are used to represent user’s interest and behavior respectively.
Experiments on a real dataset from twitter showed that the proposed framework that utilizes those attributes
outperformed multiple standard models that utilize a static snapshot of data.
1 INTRODUCTION
Online Social Networks are now a popular way for
people to interact, communicate, express
themselves, and share contents. Some of the most
well-known social networks are: Myspace (over 50
million users), Facebook (1.23 billion users), Twitter
(200 million users) and LinkedIn(277 million users).
Some social networks are specialized in sharing
multimedia contents such as Flickr and YouTube
while other are used for publishing and sharing
blogs like Blogger.
Today, users in social networks often have
personalized profiles that contain a set of attributes
that uniquely express each user like biography, age,
gender, geographic location, hobbies, education
history, and work information. While, other
attributes that represent dynamic features with
tagged time slots such as posts, comments and
check-in. Such information can be analyzed in order
to be used in different research areas such as:
community detection, user recommendation(Abel et
al., 2011; Blanco-Fernández et al., 2011),
information propagations (Kleanthous & Dimitrova,
Analyzing Community Knowledge Sharing
Behavior, 2010), expert identification (Kleanthous
and Dimitrova, 2008), link prediction (Quercia,
Askham and Crowcroft, 2012), topic discovery
(Quercia, Askham and Crowcroft, 2012; Takahashi,
Tomioka and Yamanishi, 2014), and measuring
similarity between users (Kleanthous and Dimitrova,
2008; Li et al., 2008; Lee and Chung, 2011).
Generally, there are two main approaches to
analyze extracted information from social networks.
The first one is based on extracting content
published by users, while the second analyzes the
links between users. Traditional methods analyze the
content of user’s posts in order to discover hidden
attributes about users such as topics of interest (Abel
et al., 2011; Blanco-Fernández et al., 2011). While,
analysis of link information such as the number of
common friends and frequency of interactions is
used to identify user behavior and degree of
influence (Kleanthous and Dimitrova, 2010;
Takahashi, Tomioka and Yamanishi, 2014).
Recently, integration between those approaches has
emerged that rely on the information extracted from
both social graph nodes and links for better
understanding of users inside the network (Mislove
et al., 2010). Furthermore, analysis of users’
published content and social patterns allow the
identifying the degree of similarity between users
which is crucial for many applications such as friend
suggestion, link prediction, community detection,
585
Galal A. and El-Korany A..
Dynamic Modeling of Twitter Users.
DOI: 10.5220/0005346105850593
In Proceedings of the 17th International Conference on Enterprise Information Systems (ICEIS-2015), pages 585-593
ISBN: 978-989-758-097-0
Copyright
c
2015 SCITEPRESS (Science and Technology Publications, Lda.)

etc. During the early stages of social networks
analysis, they relied on studying the static attributes
(which refer to those with no time tags) such as:
gender, professional interests, affiliation, and
education information to measure similarity between
users. However, social networks had evolved over
time and new dynamic attributes are utilized. For
example, an important attribute was introduced in
social networks which is location check-in which
allows users to tag their location with each post.
This geographic attribute has been further evolved to
include not only the physical location but also the
semantic of location (Lee and Chung, 2011).
Accordingly, both user published content and
location check-in can be used to represents user’s
activities over time. One of the major challenges in
measuring the similarity between users in social
networks is finding the combination of suitable
attributes that best describe user interest, behavior.
Another challenge is how to consider effect of time
on the change in user’s interests and behavior. In
this paper, we propose a novel framework for
modeling the dynamic of users in online social
networks which is further used in measuring the
similarity between users’ profiles.
The rest of the paper is organized as follows. In
Section 2, we discuss the related work in dynamic
modeling of users and measuring users’ similarity.
In Section 3, we explain the main components of the
proposed framework. In order to measure the
accuracy and efficiency of the proposed model, a set
of experiments have been applied on twitter and
results and accuracy evaluation is discussed in
Section 4. Finally, we draw our conclusion and
discussed intended future work in Section 5.
2 RELATED WORK
2.1 Dynamic Modeling of Users
Dynamic user models allow a more up to date
representation of users where changes in their
interests and interactions with the system are noticed
and influence the user models. Examples of
attributes and data that can be used in the dynamic
models are frequency of posting and commenting,
friend lists and location history. Dynamic user
modeling would be used for several tasks. In their
work (Blanco-Fernández et al., 2011), ontology-
based dynamic model of user has been proposed in
order to be used in items recommendation. Based on
the assumption that user interest in items changes
over time is depending on the nature of the item to
be purchased, the authors considered the following
attributes in user modeling: time of purchases and
user’s previous ratings. Those attributes were
assigned to special time function that linked with
item classes in the ontology hierarchy in order to be
used in items’ recommendation. Another dynamic
model relied on analyzing user http requests to
social networks to identify the frequency and types
of user activities in social networks. They also
identify the type and probability of user activities
based on session time (Benevenuto et al., 2009).
Dynamic models do not only utilize content user
attributes but also use knowledge extracted from
user’s interactions. In their work (Takahashi,
Tomioka and Yamanishi, 2014), emerging topics in
twitter was detected by calculation of anomaly
scores of tweets based on user’s previous mentioned
people. This knowledge was fed to change point
detection technique to detect a change in the
statistical dependence structure with time series and
pinpoint where the topic emergence happened.
2.2 User's Similarity Measurement
Measuring similarities between users is a very
important research topic in social network analysis
as it is heavily used in several tasks such as friend
suggestion, item recommendation, community
detection, etc. Most of user models that are used in
measuring similarity rely on either static attributes of
users or a whole static snapshot of some dynamic
attributes without considering the change in user
interest or behavior over time. Ontology-based
model was proposed in (Lee and Chung, 2011)to
semantically measure the similarity between users
based on snapshots of their foursquare locations.
The main drawback of this work is that they didn’t
consider the time factor that affects users’ behavior
over time. Another dynamic model was proposed in
(Li et al., 2008) to measure the similarity between
users based on their physical location history using
GPS data without considering the semantics of
locations which play a significant role when
considering users that live in different countries or
cities. A dynamic model was proposed to measure
similarity between users based on topics extracted
from their sparse and unstructured foursquare tips
(McKenzie, Adams and Janowicz, 2013). Different
dynamic profiles were proposed in (Abel et al.,
2011) that relied on different sematic features like
entities and topics extracted from textual analysis of
user’s tweets and news links associated with these
tweets in order to study the temporal change in these
profiles over time. Unlike the above mentioned
ICEIS2015-17thInternationalConferenceonEnterpriseInformationSystems
586
work, ourproposed model considers two main
attributes that describe the change of user
characteristics within time. The proposed model
considers the user interest which is extracted from
user's posts (in our case tweets) and change in
geographical location. Also our proposed similarity
method considers the degree of change in user
interest and behavior over time and don’t rely on a
static snapshot of attributes only. We considered this
change over time based on the fact that people that
do similar activities during the same time are more
similar to each other than people that do similar
activities during different time periods.
3 PROPOSED FRAMEWORK
The abundance of data published through online
social media provides an exceptional foundation
which is used to investigate user similarity
(McKenzie, Adams and Janowicz, 2013). Thus,
proposed framework relies on the ideas that similar
users may publish similar content (Quercia, Askham
and Crowcroft, 2012; Kleanthous and Dimitrova,
2008) and also tend to visit the same locations(Lee
and Chung, 2011). Accordingly, we assume that
users who visit similar places and publish similar
content during similar time periods are supposed to
be more similar than users who visit similar
locations during different time periods or publish
different content. In order to adapt to the dynamic of
each user, it is required to extracted specific
information which represents this dynamic nature.
Therefore, two main aspects that distinguish
dynamic of users in the social network are extracted
and analyzed. The first one is user’s interests which
are represented by his topical interests while the
second one is user’s locations. Users always tend to
change those two aspects with respect to time. This
distinction in the time of an activity cannot be
realized when using static snapshot. Thus, we should
consider these changes while creating the dynamic
model and measuring the similarity. The proposed
framework can be divided into two main
components; the first component is responsible of
identifying and modeling of user’s profile, while the
second component is the similarity measurement
engine.
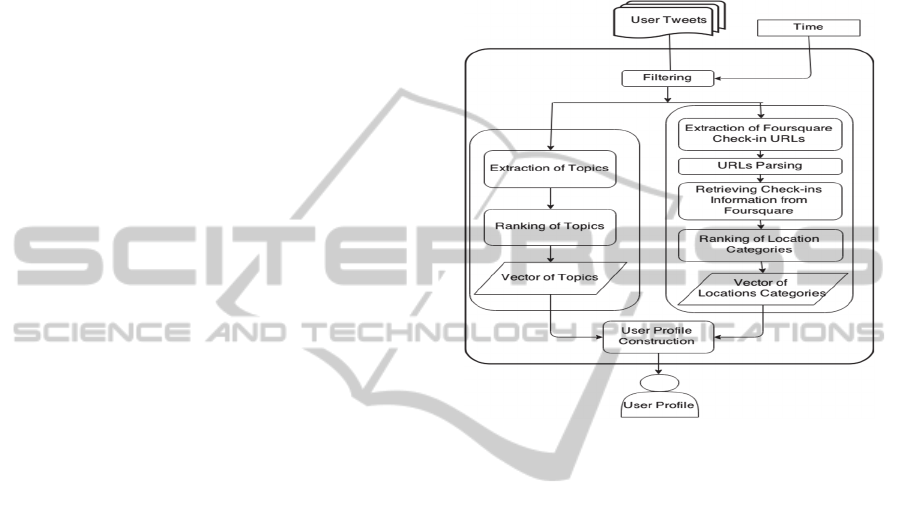
3.1 Modeling of User Profile
The first component in the proposed framework is
responsible for creating the dynamic user profile as
shown in Figure1. This dynamic profile constitutes
the dynamic behavior of users in terms her/his of
topical interest as well as her/his geographical
locations. Those two attributes are represented as
vectors of topics and locations respectively. Those
vectors represent the user profile during a specific
time interval t. In the following sections, extracting
of user profile is explained in details.
Figure 1: Modeling of User Profile.
3.1.1 Identify User Locations
Based on the fact that similar people tend to visit
similar places, we utilize foursquare platform that
provides an interesting feature to its users. As the
foursquare defines, “a venue is a user-contributed
physical location, such as a place of business or
personal residence”. Since members of social
networks usually live in different geographic
locations, they visit different places. Thus, our
proposed framework relies on distinguishing place
types. Thus, the place category is used instead of the
actual physical location of users that is identified
using check-in information. We utilized the
foursquare category hierarchy
1
that consists of two
kinds of nodes, location nodes and category nodes.
A location node represents the corresponding
distinctive location such as Starbucks, Hotel
Rinjanis and Cairo Stadium. While, category node
represents a location category such as: a coffee, a
hotel and a stadium respectively. Accordingly, we
use the primary category of the place rather that its
geographic location to identify similar users as
_______________________________
1
https://developer.foursquare.com/categorytree
DynamicModelingofTwitterUsers
587
shown in the right hand side of Figure 1.
Next, in order to be able to identify the degree of
interest of user in specific category of places, we
used the number of check-ins. Based on the fact that
user tends to visit some locations more than others;
this number is used as an indicator of attractiveness
of any place for each user. Accordingly, each
location category i is assigned a relevance score with
respect to the target user during time interval t as
shown in equation (1).
,
(1)
Where n
i
is the total number of check-ins for
locations category i in all tweets of a target user
within specific time interval t. While, N is the total
number of all locations check-ins appeared in tweets
of target user within the same time interval t.
Finally, each user’s locations profile during time
interval t is represented as a vector of location
categories with their relevance scores.
3.1.2 Identify User Topical Interest
User interest is usually represented in form of
her/his daily published content. Therefore, in the
proposed model, topics are extracted from all tweets
published by each user during time interval t. We
used OpenCalais
2
tool for extraction of topics with
its associated relevance weight from each tweet
because due to its high precision and accuracy
(Gangemi, 2013). Next, we measured the degree of
interest of topics by calculating relevance score for
each topic with respect to the target user during time
interval t using a similar function to that was used in
locations but with considering the topic relevance
score as shown in equation (2):
,
∑
,
N
2
where n is the total number of occurrences of a topic
i in tweets of the target user that are created within
time interval t, N is the total number of topics
appeared in tweets of the target user within time
interval t and OCRelWeight is the relative weight
provided by OpenCalais of topic i for each one of its
occurrences j in a tweet during time interval t.
Finally, each user’s topical profile during time
interval t is represented as a vector of topics
associated with their relevance scores.
_______________________________
2
http://www.opencalais.com
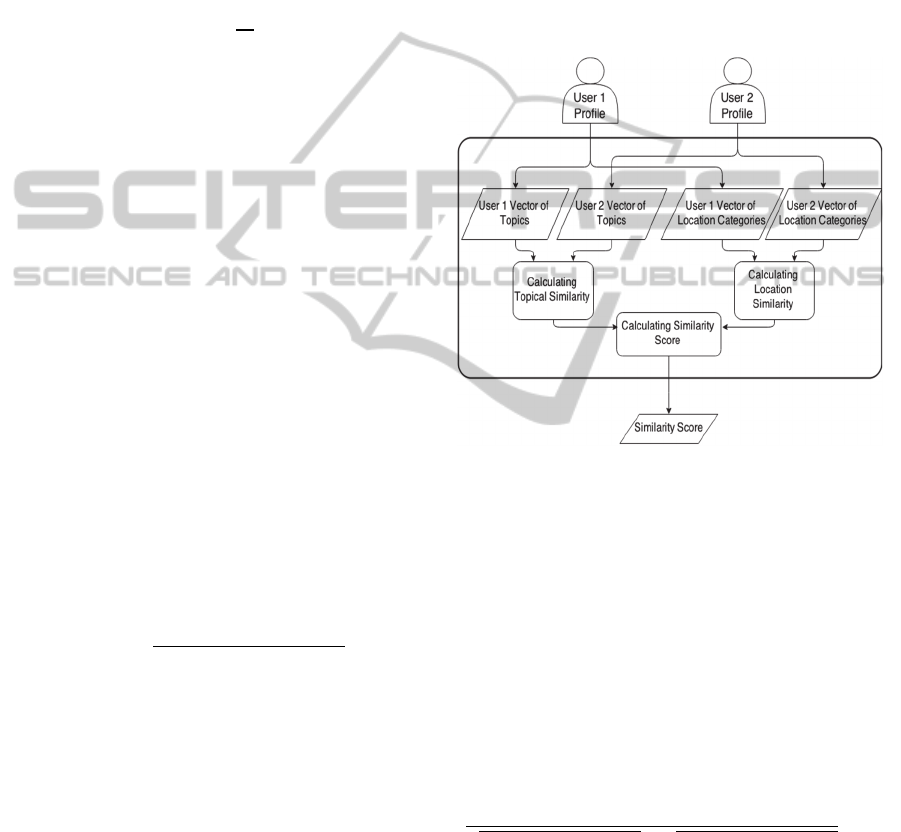
3.2 Similarity Measurement Engine
An integrated approach is used to calculate the
similarity between two different user profiles P(u1),
P(u2) within specific time interval t by using their
vectors of locations and topics along with their
associated relevance scores. Those vectors are fed
into a similarity engine to calculate the topical and
the locational similarity scores separately. Finally,
both topical and locational similarity scores can be
combined to get the overall similarity score between
the two user profiles as shown in Figure 2.
Figure 2: Similarity Measurement Engine.
3.2.1 Users’ Locations Profile Similarity
Two users’ locations profiles LP (u1), LP (u2) are
represented using two location categories vectors
VL1, VL2 respectively. Each vector contains
categories names of places visited by each user with
their relevance scores within specific time interval t.
The similarity between the two vectors can be
calculated using three standard similarity methods.
The first of these methods is the cosine similarity
that can be calculated as follows:
.
1, 2
∑
VL1
VL2
∑
VL1
∑
VL2
(3)
Where RelScr(VL1
i
) represents the relevance score
of category i in vector VL1 of the locations profile
LP(u1) and n represent the total number of
categories in vector VL1 or VL2. Thus, cosine value
is used as an indicator of user similarity value.
The second method to calculate the similarity is
ICEIS2015-17thInternationalConferenceonEnterpriseInformationSystems
588

Jensen–Shannon divergence JSD that is calculated
as follows:
.
1, 2
1|
|
2
1
2
1|
|
1
2
2||M
1
2
1 2
(4)
Where D is Kullback-Leibler divergence. It is
significant to mention that value of JSD is inversely
proportional with similarity. Thus, the less the value
of JSD, the more similar the users are.
Finally, the third method to calculate the
similarity is Jaccard method. This method considers
the location categories names only as a set of
keywords without considering their relevance scores
as follows:
.
1, 2
|1 ∩ 2|
|1 ∪ 2|
(5)
Where L1, L2 are two sets containing the location
categories names that exist in VL1 and VL2
respectively.
3.2.2 Users’ Topical Profile Similarity
Given two users’ topical profiles TP (u1), TP (u2)
that are represented by two vectors of topics VT1,
and VT2 respectively. Such that each vector
contains the extracted topics and their relevance
scores with respect to each user within specific time
interval t. The similarity can be calculated using the
same equations (3), (4) and (5) used in calculating
location similarity.
3.2.3 Integrated Users’ Similarity
Measurement
After calculating the similarity between a target user
and others using their locations and topics attributes
individually, an integrated method is used to
compute the overall similarity. As mentioned earlier
both Cosine similarity and inverted JSD are applied
to calculate similarity between two users u1 and u2.
Next, the total similarity value between two users is
lineally calculated as follows:
1, 2
∗
1,2
1
∗
1,2
(6)
∈
Where β [0, 1] is the relative importance of
locations to topics similarity respectively. Thus,
when β is set to 1 means that the final similarity
value will be based only on locations of the users.
While β = 0 means only the topics similarity will be
only be considered.
3.2.4 Measuring Users Similarity over
Defined Time Period
For measuring the similarity between two users u1
and u2 over time period T, we divide this time
period over smaller intervals t
1
, t
2
… t
n
. Then
calculate the similarity between users over small
time in order to capture the change in interest and
behavior during the smaller time and finally we
calculate the average for the overall period T. The
degree of change captured during the smaller
intervals dependent on the degree of gradually on
which we divide T. For example, in order to measure
similarity between users over a year, it was divided
into months, quarters and half year intervals. Then,
for each small time interval, we applied the previous
similarity measurement process. Finally, overall
similarity value of the year was calculated as an
average between the similarity scores over the
smaller intervals t
i
as follows:
∑
Simu1, u2,
7
Where Sim(u1,u2,t
i
) represent the similarity between
u1 and u2 over smaller interval t
i
and n is the total
number of the smaller intervals.
4 EXPERIMENT
4.1 Data Extraction
We extracted twitter users dataset through two steps.
The first step concerns identification of the correct
sample of users and the second one aims to extract
their tweets.
4.1.1 Identifying Initial Sample of Users
By using the search function in twitter API we start
searching for English tweets that contain foursquare
embedded URL. By analyzing those tweets we
succeeded in identifying 10 initial random public
users who are used as seeds in our experiments.
Then, we further crawled their friends which end up
with a collection of data of about 1452 public users.
Out of those 1452 users, we selected 187 users who
were active during a specific time period which
started from 1/1/2013 till 1/3/2014 regardless of
their rate of tweet as our sample.
DynamicModelingofTwitterUsers
589

4.1.2 Extraction of Tweets
Next, we started to extract the most recent tweets for
each user. As twitter API limits the numbers of
extracted tweets, only 3000 tweets per users were
extracted. In order to speed up the process of
extraction we used the accounts of 10 of our
colleagues that run in parallel to extract the tweets
and in the end we succeeded in extracting about half
million (524,000) tweets. For each tweet we
extracted its id and text. Finally, we stored all our
data in a relational DBMS.
4.2 User Dynamic Attributes
Extraction
4.2.1 Extraction of Location Information
As explained earlier, since users in twitter are
scattered all over the world, we did not rely on the
physical geo location information provided by
twitter. As this location information mostly contains
general locations like cities, towns and in most parts
it does not record the point of interest the user visits
during their life time. Instead, we used foursquare
location information by extracting all shortened
foursquare ULRs embedded inside the tweets and
expanding those ULRs to its original length by using
bit.ly
3
. We further analyzed the resulted URLs to
retrieve the detailed location information from
foursquare API like location name and location
primary category name such as e.g. hotel, coffee,
and restaurant.
4.2.2 Extraction of Topics
For extracting topic we used OpenCalais service
which associates with each extracted topic a
relevance weight with respect to the tweet.
4.3 Accuracy Evaluation
In order to evaluate the accuracy of the proposed
framework, we study the effect of each dynamic
attribute individually on similarity values. Then, we
study the effect of integrating both attributes using
relative coefficient β. Three well known standard
similarity measurement methods were used such as
Jaccard, Cosine and Jensen- Shannon Divergence in
order to be able to compare between their accuracy.
We calculated the pairwise similarity between the
_______________________________
3
https://bitly.com
187 users using the data from time period 1/1/2013
till 1/1/2014 as our training period and we used the
adjacent period 1/1/2014 till 1/2/2014 as the test
period for each method. For our similarity method
this training period was divided into monthly,
quarterly and half yearly periods respectively in
order to measure the effect of gradually dividing the
training period into smaller portions.
4.3.1 Topics Similarity Accuracy
In order to calculate the precision of the proposed
model, for each target user we get the intersection
between top 10 similar users recommended during
the training period and the top 10 similar user found
during the test period. A vector of topics and their
associated relevance score for the entire training
period was used as an input to the standard Cosine
and JSD methods. For Jaccard, bag of topics was
used to measure similarity between users. The
precision for each similarity method was calculated
using the following equation:
|
. 10
∩
. 10users
|
|
. 10
|
(8)
Where (Tst. top-10 users) represent the top 10 users
found by each method in the test period and (Trn.
top-10 users) represent the top 10 users
recommended by each similarity method during the
training period.
Figure 3: Comparison between precision of our proposed
dynamic topic-based model (DTBM) using three different
portion of time with static models.
Figure 3 shows the value of precision obtained when
considering snapshot of topics published over the
whole year as well as when considering the dynamic
nature of users’ published topics. It is significant to
mention that, dynamic topic-based model (DTBM)
0
0,05
0,1
0,15
0,2
0,25
Standard
Static
Models
DTBM
(Monthly)
DTBM
(Quarterly)
DTBM(Half
Yearly)
Precision
JC Cosine JSD DTBMWithCosine DTBMWithJSD
ICEIS2015-17thInternationalConferenceonEnterpriseInformationSystems
590

outperformed static model for all time progressive
portions. Furthermore, the highest precision value
was obtained when dividing the whole year into
quarters then calculating the similarity for each
quarter and getting the average. Moreover,
according to Figure 3, cosine similarity resulted in
higher precision than JSD when considering topics
only.
An example of calculating the topical similarity
between two users over one year period by using the
static snapshot of the entire year and by using
DTBM with diving the year into quarters is shown in
the following tables.
Table 1 represents the vectors of topics and their
corresponding relevance scores for two different
users. The first column for each user represents the
topics while the second column represents the
relevance score for the corresponding topic. The last
row represents the overall similarity between the two
users calculated using cosine similarity method.
Table 1: The two users’ topical profiles for the entire year
period (static snapshot).
Table 2 represents the same users’ profiles shown in
Table 1, but were divided into four quarters of the
same year. Each part of this table represents the
corresponding users in a specific quarter of year.
Such that the left column represent the abbreviations
of topics’ names (TI, HI, EC, SI and HR stand for
topics “Technology_Internet”, “Human Interest”,
“Entertainment_Culture”, “Social Issues” and
“Hospitality_Recreation” respectively). While the
right column holds the relevance score. The overall
similarity score is calculated as the average of the
Table 2: Dividing each of the two users’ topical profiles
into four independent dynamic profiles.
cosine similarities between each pair of profiles in
each quarter.
According to Table 2, the proposed dynamic
topic-based model (DTBM) provides more accurate
and higher similarity value between users (69%) as
it considers their posts/quarter not of the whole year.
Real world example shows that those users posted
similar topics during three quarters and they were
dissimilar in one quarter of the year. On the other
hand, the static model resulted in a lower similarity
score (0.24%) between the same two users as shown
in Table 1. This result confirms with our assumption
and match with reality as users tend to change their
interest over time and it also prove that static
snapshot did not realize the change in behavior and
interests.
4.3.2 Locations Similarity Accuracy
We applied the same experiment but with
considering the location categories instead of topics.
According to Figure 4, the precision of proposed
dynamic location-based model (DLBM) surpassed
static models which match with real life situations
since similar people tend to visit similar places
within the same time interval. For example,
whenever an event take place similar people visit
that place.
Figure 4: Comparison between precision of our proposed
dynamic location-based model (DLBM) using three time
division portion for the training period with static models.
This result could not be realized when applying the
static model that never considers the time of event;
rather it calculates similarity based on location
visited all over the year. Also according to Figure 4,
JSD gave higher precision than cosine technique
when considering location information. In order to
illustrate the difference between the proposed
DLBM and traditional dynamic model which
consider the years as a snapshot, an example shown
Human Interest 0.25 Human Interest 0.1
Technology_Internet 0.25 Technology_Internet 0.1
Entertainment_Culture 0.2 Entertainment_Culture 0.1
Hospitality_Recreation 0.2 Social Issues 0.6
Static Snapshot (Entire Year)
User1 User 2
Similarity Score (Entire Year Period) =
0.247564749
TI 1 HI 0.3 HI 1 HI 1
TI 0.6
Similarity Score = Similarity Score =
EC 1 EC 0.6 HR 1 SI 1
SI 0.3
Similarity Score = Similarity Score =
Similarity Score (Entire Year Period) = 0.697213595
User1 User 2 User1 User 2
0.894427191 0
Quarter 3 Quarter 4
Quarter 1 Quarter 2
User1 User 2 User1 User 2
0.894427191 1
0
0,1
0,2
0,3
0,4
Standard
Static
Models
DLBM
(Monthly)
DLBM
(Quarterly)
DLBM(Half
Yealry)
Precision
JC Cosine JSD DLBMWithCosine DLBMWithJSD
DynamicModelingofTwitterUsers
591

in the following tables to calculate the locational
similarity between two users over one year. Table 3
represents the vectors of locations categories of the
entire year and their corresponding relevance scores
for two different users. The first column for each
user represents the locations categories while the
second column represents the relevance score for the
corresponding location. The last row represents the
overall similarity of the entire year between the two
users calculated using cosine similarity method.
Table 3: The two users’ locational profiles for the entire
year period (static snapshot).
Table 4 presents the same users’ profiles shown in
Table 3, but were divided into four quarters. Each
part of this table represents the corresponding users
in a specific quarter of the same year. Such that the
left column represent the locations categories, while
the right column holds the relevance scores. The
overall similarity score in Table 4 is calculated as
the average of the cosine similarities between each
pair of profiles in each quarter.
Table 4: Dividing each of the two users’ locational
profiles into four independent dynamic profiles.
As shown Table 4, DLBM resulted in lower
similarity value between those two users (17.6%)
than the value obtained when considering the
snapshot of the year (42.6%). This result matches
with real life as they had visited a similar location
but in different time interval and therefore they are
unrelated to each other when considering the effect
of time.
4.3.3 Accuracy of Integrated Model
Next, we measured the accuracy of Integrated
Dynamic Model (IDM) by linearly combining both
dynamic attributes (user's published topics and
visited location) using different relative coefficient β
0.2, 0.5 and 0.8 respectively. As the above
experiments show, cosine similarity provided high
precision values when it was applied in topic
similarity measures, while JSN provided more
accurate result when it was applied for location
similarity. This difference in precision appears due
to scarcity of location vector. Therefore, in the
following experiment, we used cosine for calculating
similarity of topics while we used inverted JSD for
location. Finally, we measured the precision of IDM
using different progressive training periods.
Figure 5: Comparison between different β for (IDM) using
different time intervals.
As shown in Figure 5, the value of beta indeed
affects the similarity value when considering
different dynamic periods of time. Increasing the
weight of topics (beta =0.2) provides high similarity
value for the integrated model. That means topics
extracted from published content of user play a
significant role in representing dynamics of users in
the social network for either short or long time
intervals. While locations (beta =0.8) is more
effective when considering short periods
(Monthly/Quarterly) rather than long period (Half
Airport Terminal 0.15789474 Airport Terminal 0.3
Event Space 0.15789474 Event Space 0.3
Office 0.10526316 Pizza Place 0.5
Airport 0.05263158
Bookstore 0.05263158
Casino 0.05263158
Concert Hall 0.05263158
Coworking Space 0.05263158
Falafel Restaurant 0.05263158
Museum 0.05263158
Other Great Outdoors 0.05263158
Pub 0.05263158
Taco Place 0.05263158
Tech Startup 0.05263158
Similarity Score (Entire Year Period) = 0.426
Static Snapshot (Entire Year)
User1 User 2
Airport Terminal 0.33 Pizza Place 1 Airport 0.2 Pizza Place 1
Casino 0.11 Bookstore 0.2
Concert Hall 0.11 Museum 0.2
Event Space 0.11 Pub 0.2
Office 0.11 Tech Startup 0.2
Other Great Outdoor
s
0.11
Taco Place 0.11
Similarity Score = Similarity Score =
Coworking Space 0.25 Event Space 1 Airport Terminal 1
Event Space 0.25 Event Space 1
Falafel Restaurant 0.25
Office 0.25
Similarity Score = Similarity Score =
Similarity Score (Entire Year Period) = 0.176776695
None
0
Quarter 4
User1 User 2
0.707106781
Quarter 3
User1 User 2
Quarter 2
User1 User 2
0
Quarter 1
User1 User 2
0
0
0,05
0,1
0,15
0,2
0,25
IDM.(
Monthly)
IDM.(
Quarterly)
IDM.(Half
Yearly)
IDM.
(Yearly)
Precision
Beta0.2 Beta0.5 Beta0.8
ICEIS2015-17thInternationalConferenceonEnterpriseInformationSystems
592

Yearly/Yearly). This happens because the location-
vector becomes sparser when increasing the time
period while the sparseness of the topic-vector
nearly remains the same.
5 CONCLUSIONS
In this paper we introduced a novel similarity
measurement framework that relies on the dynamic
model of twitter users. This framework utilizes the
dynamic attributes of user by extracting and ranking
their topics and visited location categories during a
specific time intervals. It also applied an integrated
method that linearly combines the similarity values
between weighted topical interests and locational
vectors during a predefined time intervals.
The experimental results show that the proposed
method for calculating the similarity outperforms
several traditional models that consider only a static
snapshot of user published content and behavior.
The results also prove that when considering the
time factor for calculating the similarity always gave
better accuracy than using static snapshots of
dynamic data. This superior accuracy is achieved
whenever each dynamic attributes was individually
considered and also when applying the integrated
model. In future work, in order to enhance the
proposed framework, we intend to make it more
adaptive to the changes in interests of users over any
time. We also consider linking topics and location
categories into higher ontology hierarchy that will
better represent their interest and behavior in twitter.
REFERENCES
Abel, F., Gao, Q., Houben, G.-j. and Tao, K. (2011)
'Analyzing User Modeling on Twitter for Personalized
News Recommendations', in User Modeling, Adaption
and Personalization, pp.1-12.
Benevenuto, F., Rodrigues, T., Cha, M. and Almeida, V.
(2009) 'Characterizing User Behavior in Online Social
Networks', Proceedings of the 9th ACM SIGCOMM
conference on Internet measurement conference.
ACM, 49-62.
Blanco-Fernández, Y., López-Nores, M., Pazos-Arias, J.J.
and García-Duque, J. (2011) 'An improvement for
semantics-based recommender systems grounded on
attaching temporal information to ontologies and user
profiles', Engineering Applications of Artificial
Intelligence, vol. 24, pp. 1385-1397.
Gangemi, A. (2013) 'A Comparison of Knowledge
Extraction Tools for the Semantic Web', in The
Semantic Web: Semantics and Big Data, Springer
Berlin Heidelberg, pp.351-366.
Kleanthous, S. and Dimitrova, V. (2008) 'Modelling
Semantic Relationships and Centrality to Facilitate
Community Knowledge Sharing', in Adaptive
Hypermedia and Adaptive Web-Based Systems,
Springer Berlin Heidelberg, pp. 123-132.
Kleanthous, S. and Dimitrova, V. (2010) 'Analyzing
Community Knowledge Sharing Behavior' in Adaptive
Hypermedia and Adaptive Web-Based Systems,
Springer Berlin Heidelberg, pp. 231-242.
Lee, M.-j. and Chung, C.-w. (2011) 'A User Similarity
Calculation Based on the Location for Social Network
Services', 16th international conference on Database
systems for advanced applications, 38-52.
Li, Q., Zheng, Y., Xie, X., Chen, Y., Liu, W. and Ma, W.-
Y. (2008) 'Mining user similarity based on location
history', Proceedings of the 16th ACM SIGSPATIAL
international conference on Advances in geographic
information system ,ACM, 34.
McKenzie, G., Adams, B. and Janowicz, K. (2013) 'A
thematic approach to user similarity built on geosocial
check-ins.', in Geographic Information Science at the
Heart of Europe., Springer International Publishing,
pp. 39-53.
Mislove, A., Viswanath, B., Gummadi, K.P. and Druschel,
P. (2010) 'You Are Who You Know : Inferring User
Profiles in Online Social Networks', Third ACM
International Conference on Web Search and Data
Mining - WSDM 2010, pp. 251-260.
Quercia, D., Askham, H. and Crowcroft, J. (2012)
'TweetLDA : Supervised Topic Classification and
Link Prediction in Twitter', Proceedings of the 3rd
Annual ACM Web Science Conference, 247-250.
Takahashi, T., Tomioka, R. and Yamanishi, K. (2014)
'Discovering Emerging Topics in Social Streams via
Link-Anomaly Detection', IEEE Transactions on
Knowledge and Data Engineering, vol. 26, no. 1, pp.
120-130.
DynamicModelingofTwitterUsers
593
