
Conditional Probability and Integrated Pest Management
Using a Nonlinear Kriging Technique to Predict Infectious Levels of Verticillium
dahliae in Michigan Potato Fields
Luke Steere, Noah Rosenzweig and William Kirk
Department of Plant, Soil and Microbial Sciences, Michigan State University, East Lansing, MI, U.S.A.
{steeregr, rosenzw4, kirkw}@msu.edu
Keywords: Geostatistics, Indicator Kriging, Potato Early Die Complex, Potato Soilborne Disease.
Abstract: A recent survey of potato (Solanum tuberosum) growers in the state of Michigan identified that soilborne
pathogens were causing concerns as to whether growers would be able to continue to meet the high
demands for marketable potatoes. Of these soilborne pathogens, Verticillium dahliae is one of the most
concerning due to its direct correlation with yield decline and its persistence in the soil. Following the
survey a statewide soil study was conducted to study soilborne pathogens and their interactions with
multiple abiotic and biotic factors. The use of geostatistics and geographical information systems (GIS)
were incorporated into this study to assess the spatially distribution of colonies of V. dahliae across a field
and to use geostatistical methods to determine V. dahliae inoculum levels throughout the entire field from
20 soil samples. Furthermore, the research team incorporated the use of a nonlinear indicator Kriging
method to create conditional probability maps of soilborne pathogen inoculum levels and predict where
inoculum levels would be high enough to result in infection. The methods presented in this paper evaluated
conditional probability mapping of soilborne plant pathogens for the potential to become a practical crop
management tool for commercial potato growers.
1 INTRODUCTION
In 2012, a team comprised of potato growers and
university researchers was formed to address the
issue of declining yields and decreased tuber quality
in some areas in Michigan dedicated to potato
production. The goals of the research were 1. to
better understand the spatial variability of soilborne
pathogen inoculum levels in potato fields; 2. to
better understand the soil biology and quantify soil
microbial diversity and 3. to predict where in the
field an infection may occur based on pathogen
levels determined by conditional probability.
Verticillium dahliae is a soilborne pathogen that
is particularly significant and, in conjunction with
Pratylenchus penetrans (root-lesion nematode), can
cause potato early die (PED) (Stevenson et al.,
2001). Verticillium dahliae has a wide host range
including bell pepper, eggplant, mint, potato, and
tomato. Potato plants are infected directly via
penetration of root hairs by the fungus. Once the
fungus has penetrated the root cortex it enters the
xylem where it quickly plugs the vascular system
leading to premature senescence (Figure 1). PED is
an annual
production concern for commercial potato
growers and impacts plant health and subsequently,
crop yield. The Ascomycota fungus Verticillium
dahliae is a well-documented pathogen of potato
plants (Martin et al., 1982, Nicot and Rouse, 1987b,
Powelson and Rowe, 1993). The use conditional
probability may better determine where infection by
V. dahliae might occur based on inoculum levels at
sampled locations.
This research used geographic information
systems (GIS) and geostatistics to create predictive
maps of entire fields from known sample points. The
use of linear Kriging methods in soil science has
been well documented (Kerry et al., 2012,
Kravchenko and Bullock, 1999, Mueller et al., 2004,
Yost et al., 1982). This project evaluated a nonlinear
Kriging model to interpolate the data for V. dahliae.
Nonlinear Kriging techniques have advantages over
linear Kriging techniques due to their ability to
account for uncertainty and therefore are often used
to predict the conditional probablity for categorical
data at non-sampled locations (Eldeiry and Garcia,
2013, Goovaerts, 1994). Indicator Kriging is a
nonlinear Kriging technique that is flexible and can
195
Steere L., Rosenzweig N. and Kirk W..
Conditional Probability and Integrated Pest Management - Using a Nonlinear Kriging Technique to Predict Infectious Levels of Verticillium dahliae in
Michigan Potato Fields.
DOI: 10.5220/0005349501950200
In Proceedings of the 1st International Conference on Geographical Information Systems Theory, Applications and Management (GISTAM-2015), pages
195-200
ISBN: 978-989-758-099-4
Copyright
c
2015 SCITEPRESS (Science and Technology Publications, Lda.)
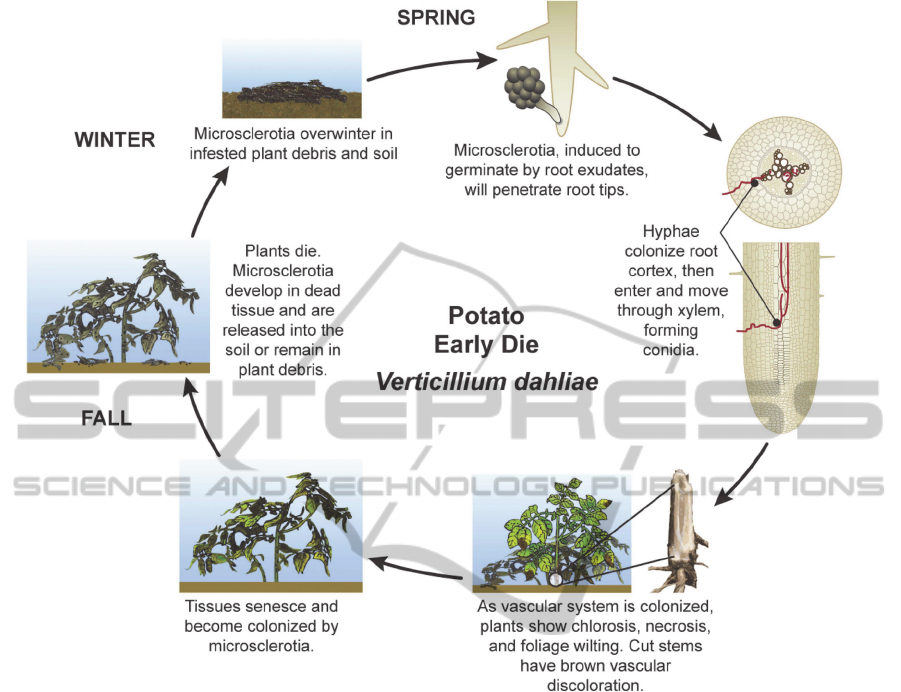
Figure 1: The disease cycle for potato early die shows how direct penetration of the root cortex leads to vascular blockage
and plant death. The dead plant tissue serves as an overwintering structure for new microsclerotia. Image is reproduced with
permission, from Steere and Kirk © 2013 Michigan State University. All rights reserved.
be modified to fit specific management or research
goals by modifying the critical threshold criteria
(Smith et al., 1993). Conditional probability maps
generated using indicator Kriging can be used to
visualize the probability of any point in space
(within the field of interest) being greater than a set
threshold. When known threshold values are
available for certain pathogens and insects, a
conditional probability map can be a valuable
agronomic crop management tool.
2 MATERIALS AND METHODS
2.1 Study Area and Collection of Data
Three field sites located in a commercial potato
production area were established for this study in
Saint Joseph County in the Southwestern corner of
Michigan. Each field was ~30 ha. Each field was on
a two-year rotation, alternating between round white
potatoes used for chipping and seed corn (Zea
mays). 20 soil cores were collected from each field,
on a grid-sampling scheme to obtain samples
proportionally throughout the entire field, with a 25
mm JMC soil corer (Clements Assoc., Newton, IA)
to a depth of ~100 mm around a central point in each
grid (10 cores and mixed). The position of each
point was recorded using a Trimble Juno 3D
Handheld GPS device (Trimble Navigation Limited,
Sunnyvale, CA). Soil samples were placed in
separate labelled plastic bags and stored at 4°C
pending further analysis. Soil data were entered
relative to their geographical coordinates and plotted
and analysed using ArcGIS 10.1 (ESRI Inc.,
Redlands, CA).
GISTAM2015-1stInternationalConferenceonGeographicalInformationSystemsTheory,ApplicationsandManagement
196

2.2 Quantification of Verticillium
dahliae Colony Forming Units
To estimate V. dahliae colony forming units (CFU),
10 g of soil from each sample point was prepared
using the wet sieving method (Nicot and Rouse,
1987a). Soil left in the 37μm sieve was plated onto
an NP-10 medium (Kabir et al., 2004) which served
as a selective nitrogen source and promoted the
development of CFU of V. dahliae while inhibiting
the growth of other soilborne fungi and bacteria.
Isolates were stored at 20°C for 14-21 days and
observed at 4x magnification under a dissecting
microscope (Leica Microsystems Inc., Buffalo
Grove, IL) and the number of microsclerotia (CFU)
were recorded. Each sample point was replicated
five times to confirm the accuracy of the initial CFU
enumeration.
2.3 Data Interpolation
2.3.1 General Interpolation
In most interpolation methods, predicted values can
be estimated by weighted averages from the
surrounding areas. The general equation for the
interpolation of non-sampled locations is computed
as follows:
∗
(1)
where
∗
is the non-sampled location that is
being predicted,
are the values at sampled
locations and
are the weights assigned to each
sampled data point (Goovaerts, 1997). The
difference between interpolation methods is
dependent on how
is calculated and what their
respective values are.
2.3.2 Indicator Kriging Interpolation
Method
The indicator Kriging model assumes an unknown,
constant mean. The technique has been well
documented (Journel, 1983; Solow, 1986) and the
general form can be computed as follows (Eldeiry
and Garcia, 2013)
(2)
where is an unknown constant and
is a binary
variable. The indicator function under a desired cut-
off value z
k
is computed as
,
1,
0,
(3)
The indicator Kriging model estimator I(x
i
,z
k
) at the
location can be calculated using
∗
;
;
(4)
and the indicator Kriging, given Σλ=1, is
(5)
Where
is the weight coefficient,
is the
semivariance of the indicator kriging codes at the
respective lag distance, and is the Lagrange
multiplier. These steps transform the data set into
values between 0 and 1 based on the probability of
that point in space being above the set threshold
value. Based on previous work done on the number
of V. dahliae CFU needed to promote PED (Nicot
and Rouse, 1987b), the threshold value for this
interpolation method was set at 5 CFU/10 g of soil.
2.3.3 Model Evaluation
The accuracy of the indicator Kriging model was
evaluated by using the root mean square error
(RMSE) cross-validation calculated as (Ramos et al.,
2008)
1
(6)
where
is the predicted value at the cross-
validation point,
is the measured value at point
and is the number of data sets measured. The
successfulness of the model in assessing the
variability was evaluated by using the root mean
squared standardized error (RMSSE) cross-
validation statistic calculated as (Ramos et al., 2008)
1
(7)
where
is the predicted value at the cross-
validation point,
is the measured value at point
, is the number of data sets measured, and
is the variance at cross-validation point
.
ConditionalProbabilityandIntegratedPestManagement-UsingaNonlinearKrigingTechniquetoPredictInfectious
LevelsofVerticilliumdahliaeinMichiganPotatoFields
197

3 RESULTS AND DISCUSSION
Cross-validation statistics analysis was performed on
data for the three fields with a low-, high- and
variable-risk based on spatial distribution of CFU
(Table 1). These cross-validation statistics are used
to determine how well the indicator Kriging
equation interpolated the V. dahliae CFU numbers
for each of the three fields. The closer the RMSE is
to zero, the closer the prediction is to the measured
values (Robinson and Metternicht, 2006). All three
fields had RMSE values relatively close to zero
meaning that the model derived from the data points
in each of the respected fields accurately predicted
the probability of any point in space within the field
being greater than the threshold of 5 CFU/10 g of
soil.
Table 1: Cross-validation parameter root mean squared
error (RMSE).
Field RMSE
a
RMSSE
b
1 0.1133264 0.953032
2 0.3442308 1.145598
3 0.4960541 1.034625
a
Root mean squared error, the root value of the mean squared
error
b
Root mean squared standardized errors The closer to 1, the more
accurate the prediction of variability for that model
The RMSSE shows the model’s successfulness
in assessing variability. The closer the RMSEE is to
1, the more successful the prediction of variability
for that model was (Robinson and Metternicht,
2006). The calculations using the indicator Kriging
equations above for each of the three fields of
interest showed high levels of accuracy in predicting
and assessing variability. Each of the three equations
preformed well in regards to how accurate the
predictions of the established threshold probability
(CFU > 5 CFUs/10 g of soil) at points that were not
sampled.
Conditional probability maps were generated for
the three individual fields (Figure 2). These maps
spatially represented the probability of PED
incidence based on a 5 CFU/10 g of soil threshold. A
conditional probability map was generated of the
low-risk field (Figure 2A). Based on the 20 original
V. dahliae CFU values and a threshold value of 5
CFU/10 g of soil, the indicator Kriging model
developed for this field predicts a low incidence of
PED. The small portion of the field colored red had
a probability from 0.95 to 1 of PED. The majority of
the field, colored in blue had a probability between 0
and 0.1 for PED. A conditional probability map was
generated of the high-risk field (Figure 2B). The
majority of this field had a probability between 0.95
and 1 for PED. This is quite a contrast from the low-
risk field. Finally a conditional probability map was
generated of the variable-risk field (Figure 2C). The
result is a map where the probability of being above
the established PED threshold varied throughout the
field.
The visualized differences among these three
maps shows how the use of conditional probability
can be used to predict the spatial distribution of plant
diseases in the soil and provide and informational
tool for commercial potato growers. In an effort to
help reduce inoculum levels of V. dahliae and other
soilborne pathogens, growers will often elect to use
soil fumigants. For many years, soil fumigants such
as methyl bromide were used, with great
effectiveness, to eliminate soilborne plant pathogens
such as V. dahliae (Wilhelm and Paulus, 1980,
Wilhelm et al., 1961, Ebben et al., 1983). More
recently, the commercial agriculture industry has
phased out the use of methyl bromide due to its
negative effect on the environment (Thomas, 1996).
New soil fumigants such as metam sodium and
chloropicrin have taken the place of methyl bromide
but as researchers begin to better understand the role
of beneficial soil microorganism related to plant
health (Hayat et al., 2010) the use of any broad-
spectrum fumigant is being re-evaluated in a new
context. While these soil fumigants may control
soilborne pathogens, they may be, in effect, reducing
the beneficial soil microorganism populations that
assist in plant growth and natural defence against
plant pathogenic bacteria and fungi.
The accessibility of conditional probability maps
could become a useful informational tool for
growers implementing integrated pest management.
Rather than making crop management decisions for
a field’s acreage as a whole, a grower would be able
to assess each field individually, or even at the sub-
field level to determine problem fields or areas of
the field that would benefit from soil fumigation. If
the grower maintained a low-risk field (Figure 2A),
they could use conditional probability as a holistic
management tool to determine no need for
fumigation in that field based on the PED risk.
Conversely, if the grower assesses the conditional
probability for PED and the results indicate a high-
risk for PED above the established
threshold (Figure
2B), the grower may elect to treat with applications
of soil fumigants. Lastly, if a grower is managing a
variable-risk field for PED (Figure 2C), this would
allow the grower to make decisions based on a sub-
field management approach and only apply fumigant
to the portions of the field that present a greater
GISTAM2015-1stInternationalConferenceonGeographicalInformationSystemsTheory,ApplicationsandManagement
198
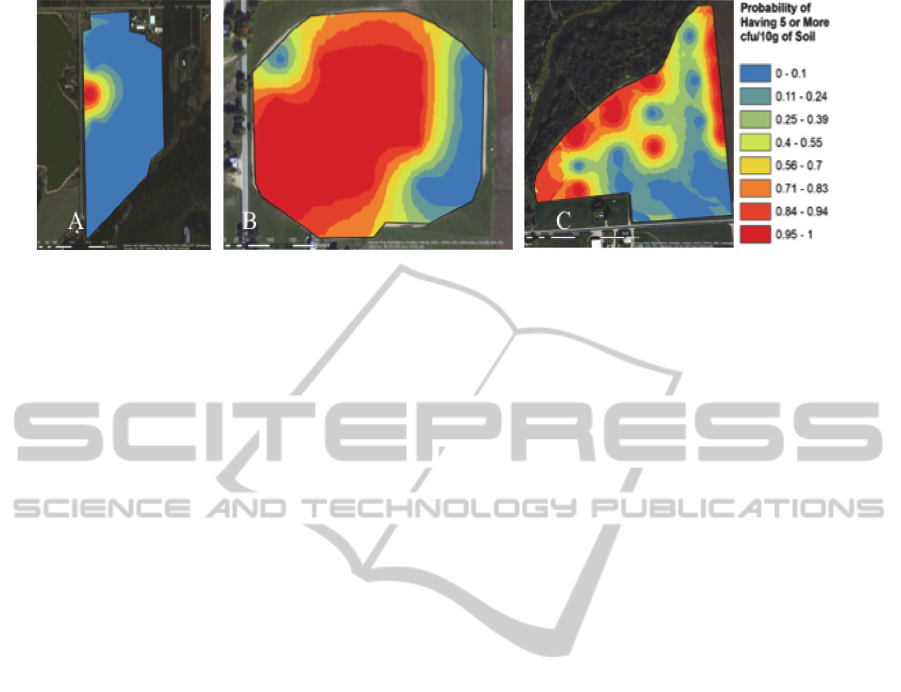
Figure 2: Conditional probability maps developed for low-risk field (A), high-risk field (B), and variable-risk field (C)
using the indicator Kriging method of interpolation with the threshold set at 5 CFUs/10 g of soil. The conditional
probability map for each field represents the risk for the development of potato early die (PED) based on the probability of
that area in space having greater than 5 CFUs/10 g of soil with the color red representing a high probability and the color
blue representing a low probability based on predicted values of Verticillium dahliae CFUs at that location in the field.
probability of PED. By moving away from
generalized, large-scale management practices and
into single field and sub-field management strategies
with the incorporation of geostatistics and GIS,
growers have the potential to greatly decrease input
cost and negative environmental effects brought on
by heavy regimens of soil fumigants and pesticides,
and other inputs.
4 CONCLUSIONS
The results of this research show how the
incorporation of conditional probability into an
integrated pest management system has the potential
to inform management decisions that can decrease
the amount of soil fumigants applied on commercial
potato fields. Though this study had a narrow focus
looking at only one soilborne pathogen in one
cropping system, the methods described above are
adaptable and flexible enough to be easily
incorporated into integrated pest management
programs across cropping systems and for other
soilborne pathogens. From an agronomic
perspective, having the ability to sample a relatively
small amount of data points and use those points to
predict values for an entire field could greatly
influence how integrated pest management is
conducted in the future. Research going forward will
be geared towards the geospatial interactions of soil
pathogens and soil microbial populations in hopes of
reducing the use broad-spectrum soil fumigants.
ACKNOWLEDGEMENTS
This research was supported by funding provided by
the Michigan Potato Industry Commission through a
USDA NIFA Specialty Crop Block Grant Program
(Grant #791N1300). Additional funding and
resources were provided by the Michigan Potato
Industry Commission and the Michigan State
University Project GREEEN (Generating Research
and Extension to Meet Economic and Environmental
Needs). The authors wish to thank Rob Schafer,
Chris Long and Anne Santa Maria and the potato
growers of Michigan.
REFERENCES
Ebben, M. H., Gandy, D. G. & Spencer, D. 1983. Toxicity
of methyl bromide to soil-borne fungi. Plant
Pathology, 32, 429-433.
Eldeiry, A. A. & Garcia, L. A. 2013. Using Nonlinear
Geostatistical Models in Estimating the Impact of
Salinity on Crop Yield Variability. Soil Science
Society of America Journal, 77, 1795-1805.
Goovaerts, P. 1994. Comparative performance of indicator
algorithms for modeling conditional probability
distribution functions. Mathematical Geology, 26,
389-411.
Goovaerts, P. 1997. Geostatistics for natural resources
evaluation, Oxford university press.
Hayat, R., Ali, S., Amara, U., Khalid, R. & Ahmed, I.
2010. Soil beneficial bacteria and their role in plant
growth promotion: a review. Annals of Microbiology,
60, 579-598.
Journel, A. G. 1983. Nonparametric estimation of spatial
distributions. Journal of The International Association
For Mathematical Geology, 15, 445-468.
Kabir, Z., Bhat, R. & Subbarao, K. 2004. Comparison of
media for recovery of Verticillium dahliae from soil.
Plant Disease, 88, 49-55.
Kerry, R., Goovaerts, P., Rawlins, B. G. & Marchant, B.
P. 2012. Disaggregation of legacy soil data using area
to point kriging for mapping soil organic carbon at the
ConditionalProbabilityandIntegratedPestManagement-UsingaNonlinearKrigingTechniquetoPredictInfectious
LevelsofVerticilliumdahliaeinMichiganPotatoFields
199

regional scale. Geoderma, 170, 347-358.
Kravchenko, A. & Bullock, D. G. 1999. A comparative
study of interpolation methods for mapping soil
properties. Agronomy Journal, 91, 393-400.
Martin, M., Riedel, R. & Rowe, R. 1982. Verticillium
dahliae and Pratylenchus penetrans: Interactions in
the Early Dying Complex of Potato in Ohio.
Phytopathology, 72, 640-644.
Mueller, T., Pusuluri, N., Mathias, K., Cornelius, P.,
Barnhisel, R. & Shearer, S. 2004. Map quality for
ordinary Kriging and inverse distance weighted
interpolation. Soil Science Society of America Journal,
68, 2042-2047.
Nicot, P. & Rouse, D. 1987a. Precision and bias of three
quantitative soil assays for Verticillium dahliae.
Phytopathology, 77, 875-881.
Nicot, P. & Rouse, D. 1987b. Relationship between soil
inoculum density of Verticillium dahliae and systemic
colonization of potato stems in commercial fields over
time. Phytopathology, 77, 1346-1355.
Powelson, M. L. & Rowe, R. C. 1993. Biology and
management of early dying of potatoes. Annual
Review of Phytopathology, 31, 111-126.
Ramos, P., Monego, M. & Carvalho, S. 2008. Spatial
distribution of a sewage outfall plume observed with
an AUV. In Oceans 2008: Proceedings of the MTS-
IEEE Conference, Quebec City, QC, Canada, 2008.
15-18. IEEE.
Robinson, T. & Metternicht, G. 2006. Testing the
performance of spatial interpolation techniques for
mapping soil properties. Computers And Electronics in
Agriculture, 50, 97-108.
Smith, J. L., Halvorson, J. J. & Papendick, R. I. 1993.
Using multiple-variable indicator kriging for
evaluating soil quality. Soil Science Society of America
Journal, 57, 743-749.
Solow, A. R. 1986. Mapping by simple indicator kriging.
Mathematical Geology, 18, 335-352.
Stevenson, W. R., Loria, R., Franc, G. D. & Weingartner,
D. P. 2001. Compendium of potato diseases, American
Phytopathological Society St. Paul, MN.
Thomas, W. 1996. Methyl bromide: effective pest
management tool and environmental threat. Journal of
Nematology, 28, 586.
Wilhelm, S. & Paulus, A. O. 1980. How soil fumigation
benefits the California strawberry industry. Plant
Disease, 64, 264-270.
Wilhelm, S., Storkan, R. & Sagen, J. 1961. Verticillium
wilt of strawberry controlled by fumigation of soil
with chloropicrin and chloropicrin-methyl bromide
mixtures. Phytopathology, 51, 744-&.
Yost, R., Uehara, G. & Fox, R. 1982. Geostatistical
analysis of soil chemical properties of large land areas.
II. Kriging. Soil Science Society of America journal,
46, 1033-1037.
GISTAM2015-1stInternationalConferenceonGeographicalInformationSystemsTheory,ApplicationsandManagement
200
