
The Effect of Acceleration and Deceleration Information of Preceding
Vehicle Group on Fuel Economy of the Following Vehicle
Shuichi Matsumoto
Faculty of Information and Communications, Bunkyo University, 1100, Namegaya, Chigasaki, Kanagawa, 253-8550, Japan
Keywords: ITS, Traffic Flow, Eco-driving, Driving Simulator.
Abstract: Eco-driving and other environmentally-friendly behaviors have been gaining widespread acceptance. In
order to encourage eco-driving efficiently, this study looked at the effect of preceding and pre-preceding
vehicle’s acceleration-deceleration information on the following vehicle's gasoline mileage. As a result, the
following was found: 1. By providing information to a following vehicle, the fuel consumption rate of the
following vehicle can be reduced. 2. Subjects that improved their gasoline mileage tended to value pre-
preceding vehicle information more than those that worsened it. 3. With the provision of information on the
pre-preceding vehicle, the following vehicles started moving earlier. 4. The pre-preceding vehicle's
acceleration information caused the following vehicle to increase accelerate gradually when starting to
move. Therefore, it was suggested that sharing the information on preceding and pre-preceding vehicles was
effective.
1 INTRODUCTION
Recently, motivating and supporting through the
provision and sharing of information have been
pointed out as essential for the long-term
continuation of eco-driving (Beusen et al., 2009);
(Matsumoto et al., 2014); (Hao Yang and Wen-Long
Jin, 2014). For this reason, systems that provide
information on fuel economy to motivate drivers to
change their driving behavior have been considered,
and many systems including eco-drive indicators are
under development. For further development of
these systems, it is important to support drivers to
harmonize with traffic flow by detecting not only
information of one's own vehicle but also that of the
preceding vehicle group (Matsumoto et al., 2011).
Sato et al. tried to improve fuel economy by
indicating information on acceleration/deceleration
on a panel at the back of preceding vehicles to
provide the information to following vehicles. The
result reported that the provision of information may
enable an ideal following with few needless changes
in acceleration and also an improvement in fuel
economy (Saito et al., 2012).
In this study, based on both these study results
and trends in information technology, not only
information on the acceleration/deceleration of the
preceding vehicle but also that of the preceding
Table 1: Display Method of Acceleration Information.
Acceleration
a(m/s2)
display
0.4<=a
-
0.4<a<0.4Low
a<=-0.4
▲あ
▼-あ
▲あ
vehicle group including the pre-preceding vehicle
was presented and the effect on driving behavior,
visual recognition and fuel economy was quantified.
2 EXPERIMENTAL OVERVIEW
2.1 Experimental Environment
As multiple subjects needed to drive in an identical
driving environment, UC-win/Road (manufactured
by Forum 8 Co., Ltd. and hereafter called "DS") was
used to conduct the experiment in a virtual space
which represented a linear road with no buildings
along it. The data regarding acceleration, speed,
engine speed, accelerator pedal input, brake pedal
input, and the position of the vehicle were obtained
5
Matsumoto S..
The Effect of Acceleration and Deceleration Information of Preceding Vehicle Group on Fuel Economy of the Following Vehicle.
DOI: 10.5220/0005353700050010
In Proceedings of the 1st International Conference on Vehicle Technology and Intelligent Transport Systems (VEHITS-2015), pages 5-10
ISBN: 978-989-758-109-0
Copyright
c
2015 SCITEPRESS (Science and Technology Publications, Lda.)
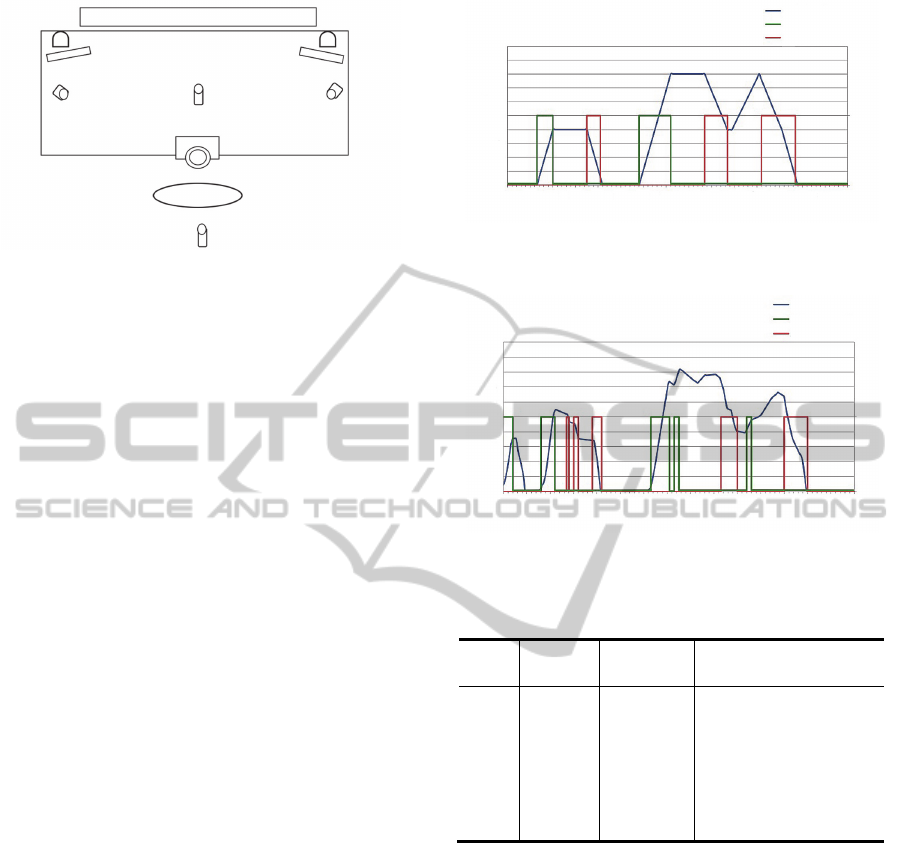
Speaker Speaker
42-inch monitor
8-inch monitor 8-inch monitor
Camera 1 Camera 2Camera 3
Camera 4
Steering wheel
seat
Figure 1: Experimental Equipment.
from DS as outputs. Four vehicles (hereafter called
"pre-preceding vehicle", "preceding vehicle",
"subject's vehicle" and "following vehicle" in order
from front to back, and the front two vehicles are
called "preceding vehicle group") were programmed
to run on the experimental road. From the subject's
vehicle, the view of the pre-preceding vehicle is
blocked by the preceding vehicle. The pre-
preceding vehicle was programmed to run on a low
speed, mode 10, simulating driving in an urban area.
The travel distance was approximately 700 m and
each drive took approximately 3 minutes. Data of
the vehicle driven by an average man in his twenties
(having held his driver's license for 4 years and
drives 3-4 times a week) following his preceding
vehicle was recorded and used as the driving data for
the preceding vehicle. Based on a previous study
(Matsumoto et al., 2014), the following vehicle was
set to follow the subject's vehicle with the same
driving behavior so the inter-vehicular distance
could be not too long. The brake lights of the
preceding vehicle group were switched off during
the experiment. If the deceleration information
provided by the lighting of brake lights overlapped
with the deceleration information indicated on the 8-
inch monitor, the time of visual recognition may
have been inaccurate.
2.2 Provision of Information
In the preliminary study, information was provided
in three steps, as shown in Table 1, based on the
indication format and threshold values of
acceleration obtained by the previous study (Saito et
al., 2012). The configuration of experimental
equipment is shown in Figure 1. Two 8-inch
monitors were used in this study.
One at the left side indicated the
acceleration/deceleration information of the
preceding vehicle, and one at the right side indicated
that of the pre-preceding vehicle, both flickering at a
Speed of pre-preceding vehicle
Provision condition of acceleration information
Provision condition of deceleration information
0 102030405060708090100110120130140150
0 0
1
5
10
15
20
25
30
35
40
45
50
Speed [km/h]
Time [sec]
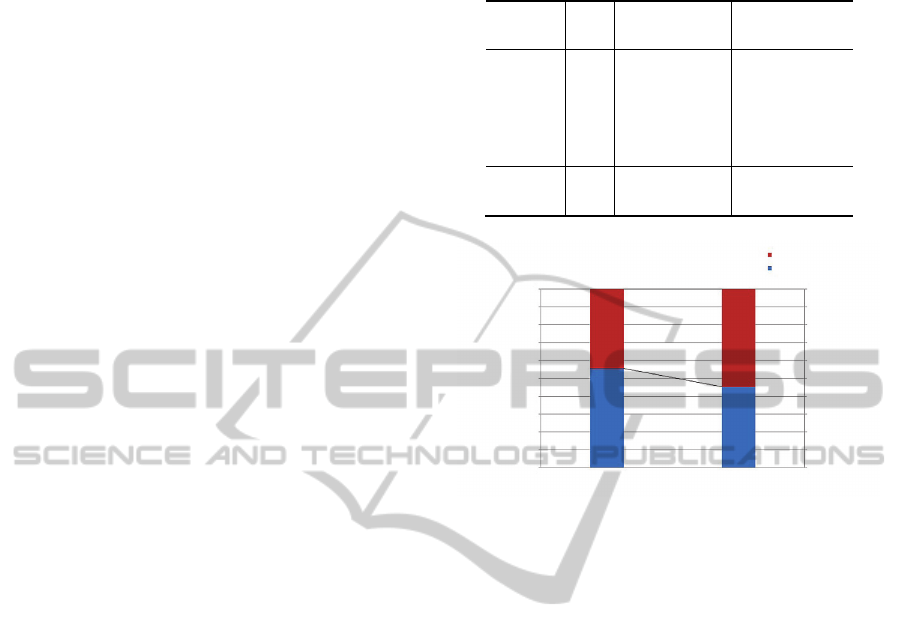
Figure 2: Swept Path and Acceleration/Deceleration
Information of Pre-Preceding Vehicle.
0 102030405060708090100110120130140150
0
0
1
5
10
15
20
25
30
35
40
45
50
Spee
d
[k
m
/h]
Time [sec ]
Velocity of preceding vehicle
Provision condition of acceleration information
Provision condition of deceleration information
Figure 3: Swept Path and Acceleration/Deceleration
Information of Preceding Vehicle.
Table 2: Attribution of Subjects
ID Age
D
rivin
g
E
xperience
Driving Frequenc
y
A
B
C
D
E
F
G
22
34
22
21
22
46
47
2
26
3
3
4
25
27
1-2 times per wee
k
almost everyday
1-2 times per week
3-4 times per week
1-2 times per week
once in a month
once in a month
frequency of 1 Hz. The green triangle showed the
acceleration of preceding and pre-preceding
vehicles. The white crossbar showed very little
acceleration or deceleration, and the red triangle
showed the deceleration of preceding and pre-
preceding vehicles. Figure 2 and 3 shows the zone
where acceleration/deceleration information of the
pre-preceding and preceding vehicles is indicated.
Numbers in the right axis show the information
provision status; 1 represents the period of time
when information is provided, and 0 represents the
time when no information was provided. For the pre-
preceding vehicle, the time of information provision
accounted for 34.7% of the whole driving time
(acceleration 40.4%, deceleration 59.6%). For the
preceding vehicle, the rate was 27.3% (acceleration
43.9%, deceleration 56.1%).
VEHITS2015-InternationalConferenceonVehicleTechnologyandIntelligentTransportSystems
6
2.3 Experimental Conditions
To adjust to the experimental environment, subjects
practiced driving under two scenarios; with and
without the provision of information. In the main
experiment, each subject drove two times each under
two situations; with and without the provision of
information. Driving experiments were performed
randomly to minimize the influence of the order.
After the experiment, subjects took a questionnaire
on the difference in driving with and without the
provision of information.
2.4 Subject
Seven drivers (six males and one female) joined the
experiment as subjects. Table 2 summarizes the
attributes of each subject. Fully informed consent on
the participation in the experiments was obtained
from the subjects in advance, after given
explanations about the following matters: 1)
Disadvantages caused by the experiments 2)
Consideration of privacy 3) Guarantee of their right
to withdraw from the experiment. They were then
given instructions as described below.
Observe the Japanese traffic regulations.
Drive safely.
Follow the preceding vehicle, but do not pass
the preceding vehicle group.
Do not switch lanes.
Do not fall too far behind the preceding vehi-
cle.
Before driving with the provision of information, an
additional instruction was given to the subjects to
drive taking the acceleration/deceleration
information into account where necessary. Two or
three subjects drove in a day.
3 RESULT AND DISCUSSION
Under the experimental environment, the provision
of information on the acceleration/deceleration of
the preceding vehicle group was found to have the
tendency to increase fuel economy by 2.3% on
average. Therefore, the relation between the change
in driving behavior after the provision of
information and the increase in fuel economy was
examined, based on the difference in visual
recognition of acceleration information between
subjects who increased the fuel economy and those
who did not. Table 3 shows the fuel economy for
each subject. Subjects A, B, C, D and E who
Table 3: Improvement of Fuel Economy by Subject (unit:
km/l).
ID
Information not
Provided
Information Provided
improvement
group
A
B
C
D
E
8.0
8.0
7.9
7.9
8.1
8.4(+5.6%)
8.2(+2.0%)
8.4(+5.9%)
8.3(+4.9%)
8.4(+1.0%)
reduction
group
F
G
8.4
8.1
8.3(-1.0%)
7.7(-4.7%)
0%
10%
20%
30%
40%
50%
100%
90%
80%
70%
60%
0%
10%
20%
30%
40%
50%
100%
90%
80%
70%
60%
Preceding vehicle
Pre-preceding vehicle
Rates of time of visual recognition on
information of the pre-preceding vehicle [%]
Rates of time of visual recognition on
information of the preceding vehicle [%]
Improvement group Reduction group
Figure 4: Rates of Time of Visual Recognition on
Preceding Vehicle Group.
increased the fuel economy were classified as
"elevation group", and subjects F and G who
reduced the fuel economy were classified as
"reduction group". The figure parenthesis shows the
increase-decrease rate of fuel economy, using the
rate with no provision of information as the standard.
Firstly, Figure 4 shows the rate of time of visual
recognition on acceleration/deceleration information
of the preceding vehicle group. The rates of time of
visual recognition on pre-preceding and preceding
vehicles were 56% and 44% respectively in the
elevation group, whereas the rates in the reduction
group were 45% and 54%, respectively. Therefore, it
was found that the elevation group tended to visually
recognize the acceleration information of the pre-
preceding vehicle more frequently, compared to the
reduction group. Figure 6 shows the result of the
questionnaire on degree of references of pre-
preceding and preceding vehicles. For all subjects,
the average rates of references of pre-preceding and
preceding vehicles were 40% and 60%, respectively.
However, the rate of references of acceleration
information for pre-preceding vehicles was higher
than the average rate of 40% for four subjects out of
five in the elevation group. In contrast, both subjects
in the reduction group answered that they referred
more to acceleration information of preceding
TheEffectofAccelerationandDecelerationInformationofPrecedingVehicleGrouponFuelEconomyoftheFollowing
Vehicle
7
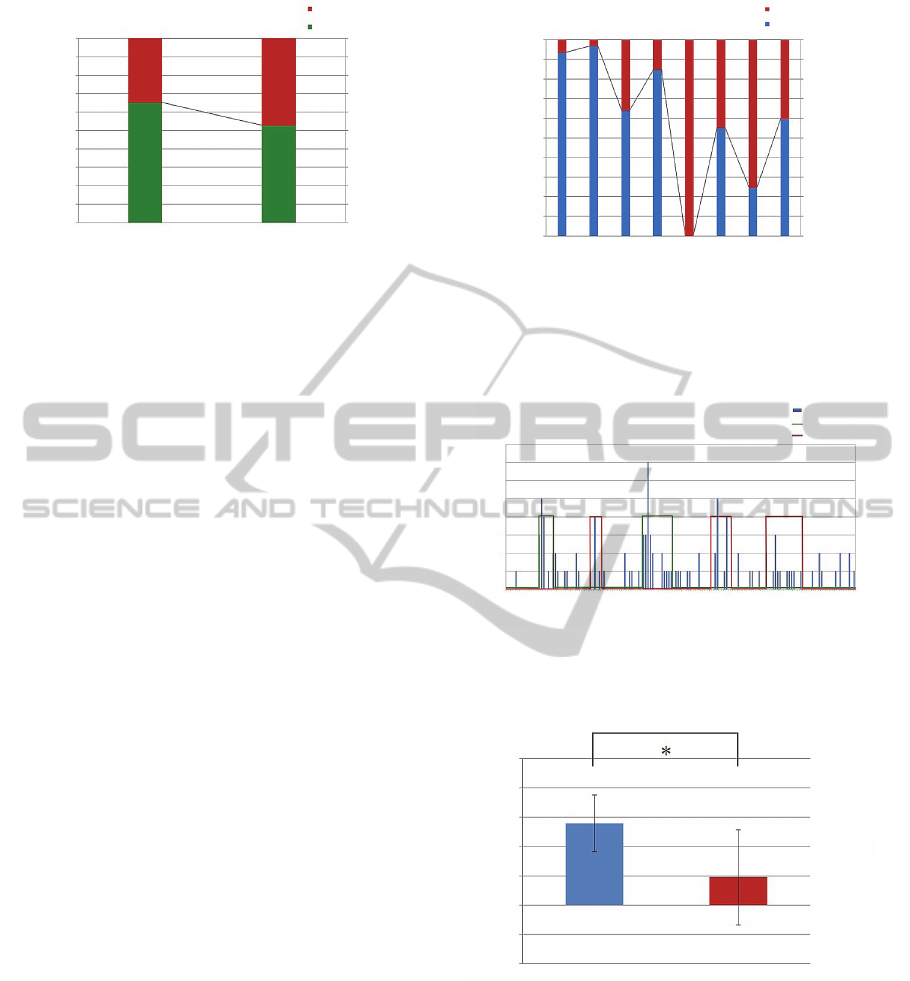
Improvement group Reduction group
Rates of time of visual recognition
on accelation information [%]
Rates of time of visual recognition
on deceletion information [%]
Deceletion
Accelation
0%
10%
20%
30%
40%
50%
100%
90%
80%
70%
60%
0%
10%
20%
30%
40%
50%
100%
90%
80%
70%
60%
Figure 5: Rates of Time of Visual Recognition on
Acceleration/Deceleration Information of the Pre-
Preceding Vehicle.
vehicle, and the rate was higher than the average of
60%.
Secondly, Figure 5 shows the rates of time of
visual recognition of acceleration/deceleration
information of the pre-preceding vehicle. As a result,
the rates in the elevation group were 65% for
acceleration information and 35% for deceleration.
This shows that they put more emphasis on
acceleration information, compared to the reduction
group.
According to “10 tips for fuel-conserving Eco
Driving” by the Eco-Drive Promotion Council, soft
starts with gentle acceleration called “e-start”
improve fuel economy by approximately 10%, and
in an urban area, driving without excessive
accelerating reduces the fuel economy by
approximately 2% (The Eco-Drive Promotion
Council, 2013). Therefore in this study, specific
differences in the ways of accelerating at the start
time, when the improvement of fuel economy is
highly expected, were analyzed.
Firstly, in order to find out the timing when the
acceleration information of the pre-preceding
vehicle is frequently recognized, the recognition
times of all subjects for every second (hereafter
called "overall recognition time") were compiled and
plotted as shown in Figure 7. The summary indicates
that in the three second period after the 14 and 61
second mark, which coincide with the time of the
start of the pre-preceding vehicles, the visual
recognition increased. These periods are the time
when the acceleration information of the pre-
preceding vehicle is provided, and account for
64.1% of the overall visual recognition time.
Therefore, the time between the starts of the pre-
preceding vehicle and subject's vehicle (hereafter
called "starting time difference") was examined. The
result is shown in Figure 8. When the information
was provided, the starting time difference was
Preceding vehicle
Pre-preceding vehicle
Subject ID
0%
10%
20%
30%
40%
50%
100%
90%
80%
70%
60%
0%
10%
20%
30%
40%
50%
100%
90%
80%
70%
60%
A
B
C
D
E
F
G
A
ve
r
age am
ong
subje
c
ts
Distribution of degree of references to
information on pre-preceding vehicle [%]
Distribution of degree of references to
information on preceding vehicle [%]
Figure 6: Result of the Questionnaire on Degree of
References to Acceleration/Deceleration Information of
Preceding Vehicle Group.
Time of visual recognition
Provision condition of accelation information
Provision situation of deceleration information
0 10 20 30 40 50 60 70 80 90 100 110 120 130 140 150
0 0
1
5
10
15
20
25
30
35
40
45
50
Total time of visual recognition [t
i
m
e]
Time [sec ]
Figure 7: Relation Between Provision Condition of
Acceleration/Deceleration Information and Total Time of
Visual Recognition.
Information not provided Information provided
Starting time difference
with preceding vehicle [sec]
0
1
2
3
4
5
-1
-2
Figure 8: Starting Time Difference with Preceding
Vehicle.
shorter by 1.9 seconds compared to that of travels
without the provision of information (p<0.05). This
means that the time difference was further shortened
by approximately one second, compared to the result
of the previous study by Sato et al. (Saito et al.,
2012) in which the start time difference
among subject's vehicle and preceding
vehicle was shortened by one second when
Ⅰ:±SD, *:p<0.05
VEHITS2015-InternationalConferenceonVehicleTechnologyandIntelligentTransportSystems
8
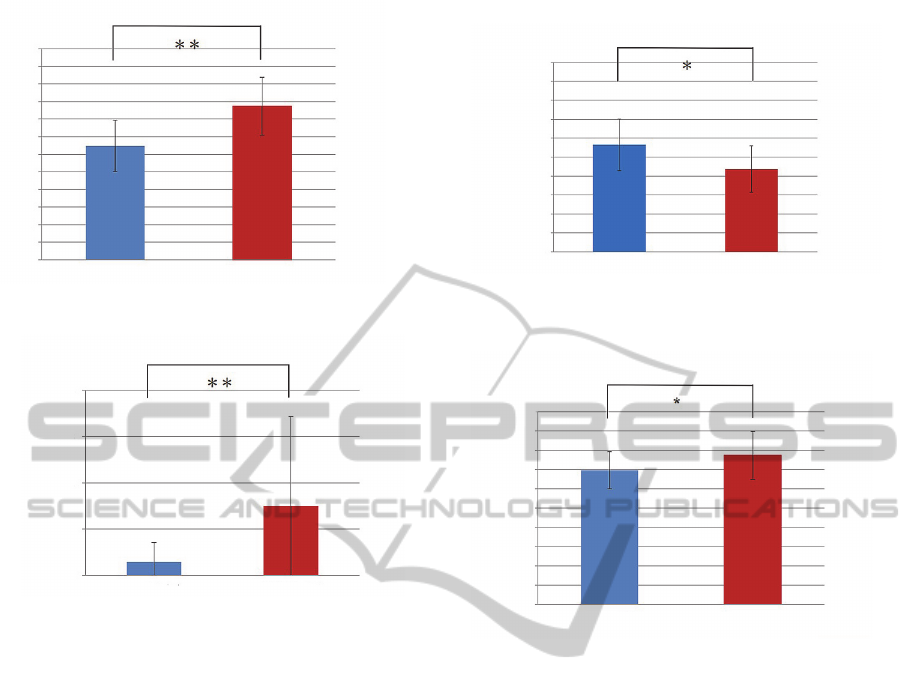
Information not provided Information provided
0
1
2
3
4
5
10
9
8
7
6
11
12
T
i
me-
t
o-
2
0
k
m
/
h
[
sec
]
Figure 9: Time-to-20 km/h.
Information not provided Information provided
0
1
2
3
4
Creeping time [sec]
Figure 10: Creeping Time.
acceleration/deceleration information was provided.
Therefore, it is expected that the operation in the
entire traffic flow may be more efficient with the
provision of information on both preceding and pre-
preceding vehicles, as opposed to the provision of
information on the preceding vehicle only.
Secondly, the changes in driving behavior at the
startup were analyzed. Eco-driving at the startup
includes a soft start with gentle acceleration, called
an “e-start”, and a start using the creep phenomenon.
To make the "e-start", it is recommended to start
moving at a speed of approximately 20 km/h in 5
seconds (The Eco-Drive Promotion Council, 2013).
This speed was used as a reference in examining the
time from the start until the velocity reached the
speed of 20 km/h (hereafter called "time-to-20
km/h") to evaluate the slow movement of vehicles at
the start. The result is shown in Figure 9. In total the
provision of information extended the "time-to-20
km/h" by 2.1 seconds (p<0.01). The average
acceleration pedal input during the "time-to-20
km/h" was also examined. As shown in Figure 11,
the average accelerate- on pedal input when
information was provided was reduced by 22.6%
compared to that when there was no information
provided (p<0.05).
Information not provided Information provided
0
10
20
30
40
50
100
90
80
70
60
Average acceleration pedal input
during the "time-to-20 km/h" [%]
Figure 11: Average Acceleration Pedal Input During the
"Time-to-20 km/h".
Information not provided Information provided
0
1
2
3
4
5
1.5
2.5
3.5
4.5
0.5
Fuel economy during the "time-to-20 km/h" [km/L]
Figure 12: Fuel Economy During the "Time-to-20 km/h".
The time from the start until the acceleration pedal
was depressed was defined as the "creeping time",
and the creeping times for each travel are shown in
Figure 10. In this experimental scenario, each trial
run has two timings for starting, which come at
approximately 14 and 61 seconds after the start of
the experiment.
However, if either of the starts was made after an
imperfect stop (as in the second travel by subject A,
first and second travels by subject B, and first travel
by subject F), those travels were excluded from the
analysis. As a result, among 24 starts in the travels
under information provision, 16 starts were made by
creeping after visually recognizing the information
on a pre-preceding vehicle. The creeping time was
extended by 13 seconds on average (p<0.01).
Subsequently, the effect on fuel economy, given
by the change in driving behavior under information
provision in accelerating area was evaluated. Fuel
economy at the time-to-20 km/h in each travel was
calculated, and the results are shown in Figure 12.
Information provision improved the fuel
economy at the time-to-20 km/h by 7.3% (p<0.05).
This value is relatively similar to the value of the
Ⅰ:±SD, *:p<0.01
Ⅰ:±SD, *:p<0.01
Ⅰ:±SD, *:p<0.05
Ⅰ:±SD, *:p<0.05
TheEffectofAccelerationandDecelerationInformationofPrecedingVehicleGrouponFuelEconomyoftheFollowing
Vehicle
9

fuel consumption reduced by the e-start, which is
approximately 10% (The Eco-Drive Promotion
Council, 2013), indicating that fuel economy can be
comparatively improved solely by the effect of
information provision without the necessity of
imposing rigorous driving rules.
4 CONCLUSIONS
Recently, many studies have been conducted to
assist drivers by providing information on fuel
economy of the preceding vehicle as well as safety.
However, it has been pointed out that providing
information on the vehicle running ahead of the
preceding vehicle is also necessary (Hao Yang and
Wen-Long Jin, 2014).
Therefore, this study used DS to give a
quantitative evaluation of the influence of providing
drivers with information on the
acceleration/deceleration of the preceding vehicle
and the pre-preceding vehicle simultaneously, on
fuel economy, visual recognition behaviors and
driving behaviors.
As a result, the possibility of an improvement in
fuel economy with this information provision was
indicated. Additionally, subjects who improved their
fuel economy tended to visually recognize the
acceleration information of the pre-preceding
vehicle more frequently compared to those who
reduced their fuel economy. In particular, visual
recognition of acceleration information of the pre-
preceding vehicle led to earlier detection of the
timing to start moving, by approximately 1.9
seconds. Additionally, provision of acceleration
information at start-up was confirmed to change the
driving behavior to be similar to that of eco-driving,
such as an increase in creeping time and a decrease
in acceleration pedal input. From above, the
effectiveness of provision of information on
acceleration/deceleration of a preceding vehicle
group to a following vehicle was indicated.
Issues in the future are to enhance data reliability
with a larger number of test subjects, and to clarify
further the influence of information of the
acceleration of preceding and pre-preceding vehicles
provided individually on the fuel economy and
driving behaviors.
REFERENCES
The Eco-Drive Promotion Council http://www.
ecodrive.jp/eco_10.html (2013,March 28)
Beusen, B, Broekx, S, Denys, T, Beckx, C, Degraeuwe, B,
Gijsbers, M., et al. “Using on-board logging devices
to study the longer-term impact of an eco-driving
course”, Transportation Research Part D, Vol.14,
pp.514–520, 2009.
S. Matsumoto, T. Park and H. Kawashima, “Comparative
Study on Fuel Consumption Reduction Effects of
Eco-Driving Instructions Strategies”, International
Journal of Intelligent Transportation Systems
Research, Vol. 2, pp.1–8, 2014.
Hao Yang, Wen-Long Jin. “A control theoretic
formulation of green driving strategies based on inter-
vehicle communications”, Transportation Research
Part C, Vol.41, pp48-60, 2014.
S. Matsumoto, T. Hiraoka, S. Yamabe and H.
Kawashima, ”Fundamental Study on Effect of Lead
Vehicle Information to Fuel Consumption Reduction
of Vehicle Groups”, Journal of Japan Society of Civil
Engineers Ser. D3, Vol.6, No.5, pp67-72, 2011.
Y. Saito, N. Hashimoto, S. Tsugawa and S.
Kato, ”Development of Deceleration Intention
Indicating System of Forward Vehicle: Effect of the
System”, Proceedings of IEEE Intelligent
Transportation Systems Conference 2012, pp.852-857,
2012.
VEHITS2015-InternationalConferenceonVehicleTechnologyandIntelligentTransportSystems
10
