
An Australian Ski Resort System
Kayleigh Rumbelow, Peter Busch and Deborah Richards
Department of Computing, Macquarie University, Sydney, Australia
Keywords: Ski Resorts, Information System, Social Computing, XML, Databases, RFID, Design Science.
Abstract: The aim of this system was to use and display existing ski access data in a new way to create business as
well as social enhancement opportunities for resorts and their guests. Radio Frequency Identification
(RFID) enabled passes, were used as input mechanisms captured by a scanner on snow at various locations.
Each scan was stored in a relational database and information extracted from this was shown to a user via a
webpage. A comparative analysis of two major resorts, both of which are currently using RFID ticket
technology was used to assess what information was currently provided to guests and how it was delivered.
This analysis was used to identify areas for future growth and development of an improved system. The use
of these services was often more of an after-ski activity rather than during (Jambon and Meillon, 2009). The
improvement described herein allowed the user display to operate on a delay rather than instantaneously.
The significance of this improved solution enabled a resort to differentiate itself from competitors. An
alternative data display is presented detailing the technologies employed and additional functionality that
could be explored.
1 INTRODUCTION
RFID (Radio Frequency Identification) technology
has been heavily deployed as part of supply chain
management strategies, tracking parts or products to
help enable greater visibility throughout. Access
management using RFID has been implemented in
ski resorts, car parks, theme parks, office buildings
and public transport environments (Anon, 2003).
With many ski resorts adopting RFID as part of their
access solution the potential access to huge amounts
of data begs the question ‘what can be done with all
this data?’ and ‘how can it be displayed to users in
different ways to provide an enhanced experience?’
Investigating how data is currently collected using
variations of RFID technology ticketing solutions
can help identify the challenges faced and the
limitations created by hardware and software.
Working within these constraints, an alternative data
display is explored.
2 SKI RESORTS AND RFID
Invented in 1948, RFID is commonly used for
resource/asset tracking and management. High
frequency (HF) passive RFID tags have become
standard for ski pass applications (O’Conner, 2008).
HF tags use inductive coupling to transmit data. The
reader and the tag form an electromagnetic field
which is used to give the chip within the tag, power
to run its circuitry to change the magnetic field and
register a scan (Violino, 2005). These tags are
embedded in a card that can be customized to
contain the resort logo, some advertising and the
pass-holder’s name. RFID lift access cards cannot be
punctured and attached to the user, they must be
stored in a pocket or protective sleeve. While
previous ticketing required line of sight for
checking, the RFID system does not, allowing users
to store the card within a pocket for the duration of
its use (O’Connor, 2008). Although HF passive tags
are common in ski ticketing, Vail resorts have opted
to use ultrahigh frequency (UHF) (O’Connor,
2008b). The method used to transmit data with UHF
systems is called propagation coupling - a reader
emits electromagnetic energy in the form of radio
waves to power the tag instead of an electromagnetic
field. The microchip backscatters this by changing
the load on the antenna and reflecting back an
altered signal (Violino, 2005). UHF tags have a
longer scanning range that Vail is expected to
leverage for other applications, such as estimations
for how long the wait is for each lift (O’Conner,
65
Rumbelow K., Busch P. and Richards D..
An Australian Ski Resort System.
DOI: 10.5220/0005356800650070
In Proceedings of the 17th International Conference on Enterprise Information Systems (ICEIS-2015), pages 65-70
ISBN: 978-989-758-098-7
Copyright
c
2015 SCITEPRESS (Science and Technology Publications, Lda.)

2007).
The motivation to employ RFID pass technology
include reducing ticket fraud, and increasing
customer service by allowing guests to move
through lift lines faster (Rafter, 2008). The gated
access system checks all tickets are valid, as this is
stricter and easier than previous human operated
hand held checking devices (O’Conner, 2010). The
ability to reload tickets online or over the phone
means guests can bypass ticket windows altogether
and head straight to the lifts (Anon., 2011). Within
Europe the option to purchase passes that allow
access to more than one resort was a major factor in
the adoption of RFID ski passes. RFID solutions
have been fully tested and widely accepted by both
resorts and guests for over a decade in Europe
(Barto, 2009), and likewise in Australia (table 1).
Table 1: Current RFID ticketing in Australia.
With the introduction of RFID ski passes, resorts
have the ability to search a specific pass and find the
last scanned location and time an individual was
there, which can be of assistance for a missing
person or child, and be the starting point for a
search. Supervisors also have the ability to hotlist a
pass and send a message to it. A children’s ski
school can also use this feature if a parent cannot be
contacted via the mobile number provided and their
child needs to be collected early due to illness.
2.1 Capturing Data
While RFID solutions have been adopted in many
areas, specialist solutions need to be sought for the
ski industry. White Pass resort (Washington USA)
found that inclement weather conditions including
snow and rain, dramatically reduced the effective
read distance of passive tags. While antennas could
be configured to allow for the drop-off in read
distance, to do so each time the weather became an
issue would be impractical (Collins, 2004).
2.2 Going Social
Although ski resorts are using RFID as a ticketing
solution allowing access to lifts, some are using it
for other services such as tracking the number of
vertical feet skied and earning points based on this,
along with the ability to share experiences with
others via social media (Swedberg, 2012). In 2010
Vail resorts debuted EpicMix, a platform enabling
users to track their stats online and connect with
each other using social media. The amount of
vertical feet skied is calculated using the difference
between lifts ridden. Users can earn “pins” based on
vertical feet achieved or other criteria specified by
the resort, such as riding a lift a certain number of
times within one day. Users will also be able to
publish their stats to Facebook and Twitter.
RFID combined with social media was used to
increase popularity for a series of festivals known as
‘Coca-Cola Village’ in Israel during summer 2010.
A RFID enabled wrist band was issued to each
teenager that was linked to their Facebook account.
Machines containing readers were placed across the
festival site and when a wristband was scanned, it
would post information related to a specific
attraction to the users Facebook page, photos could
also be posted. The system was a hit with Israeli
teenagers, claiming 100% reach with every teenager
knowing about it (Swedberg, 2010). Furthermore, in
a study conducted by Tampere University of
Technology it was found that a user’s primary use of
an online sports service was to keep a personal
sporting diary, yet sharing training information and
social features were also essential (Ojala and
Saarela, 2010).
2.3 Visualisation
Given the above considerations, what was missing
was to incorporate visual aspects to data captured at
a single resort by the ski lift access gates. Bederson
and Shneideman (2003) describe visualization as a
way to interpret and translate data from computer
understandable formats to human ones by employing
graphical models, charts, graphs and other images.
Information visualization is concerned with abstract
phenomena, whereas scientific visualization is
concerned with visualization of three-dimensional
physical objects such as blood flow, protein
structures and crystal growth. However a physical
reality may not even exist for many information
visualization projects such as stock market
movements, social relationships and supermarket
purchases (Bederson and Shneideman, 2003).
Google fusion tables are one such example that can
be used to display a variety of data which often has a
geographical nature; this can be overlaid on to a
google map to allow relationships within the data to
ICEIS2015-17thInternationalConferenceonEnterpriseInformationSystems
66

be seen. Papatoniou (2011) utilized google fusion
tables to create a framework for visualizing the web
of data, this was then used to create a mashup of
information and knowledge related to the
Mediterranean Sea. Dunlop, Elsey and Masters
(2007) used a map of Val Thorens (a French ski
resort), to develop a mobile application assessing the
suitability of runs based on the physical conditions
of the slope; such as its classification, grooming and
weather conditions along with user-set preferences.
They displayed the suitability of each run on the
map in a variety of ways including colour saturation,
direct labelling and line width. Line width was
deemed the most suitable parameter, allowing for
many runs to be displayed on one map clearly. The
colours used corresponded with the classification of
the run they represented: green, blue, red and black
(European classification). Classification of runs in
North America and Australia use green, blue, black
and double black. Distinguishing between black and
double black using this representation could be
confusing.
3 APPROACH
The method adopted for this project used a design
science approach (Recker, 2013), where the key
outcome was an ‘instantiation’, that is to say an
implemented or prototyped system that could be put
to use. In line with design science there was a focus
on providing “novelty of the demonstrated utility of
an artefact; [and] a positive difference of the utility
of an artefact in comparison to existing work”
(Recker, 2013 p. 108).
A total of 14 tables were obtained from
Pulveriser ski resort as XML files ranging from 4KB
to 4GB in size. These files contained: access detail,
access location, access location group, instructor
location, instructor schedule, IP, IP type, lesson
level, location, pass media status, person profile,
prepaid access profile and status. In short, data
collected from readers around the Pulveriser resort
was obtained and stored in a MySQL database. The
data was then imported into pre-constructed tables.
After examination of the data, a number of ideas for
how the IT could deliver social enhancement came
to mind. Some options are provided below:
3.1 Visualisation of Ski Lifts Taken
throughout the Day
One idea is to present the skier with a visualisation
of lifts and times of ski-lifts used throughout their
day.
3.2 Find Your Instructor/Suggest to
Friends
Another option would be to analysing lift access
data to identify potential relationships, perhaps
looking for friends that have used the same lifts
within a given timeframe as a means of sharing
social information and experiences
3.3 Infer Ski-level for Days-ridden and
Trails to Be Accessed
Another option could be to allow instructors access
to the lifts-ridden-history of guests participating in
lessons. Logistically this would be difficult as extra
hardware would be required at lesson locations or to
be carried by instructors. Even if instructors could
see last lifts ridden, there is still huge variation in
ability within each slope, which could nonetheless
be useful. What if the skier had skied overseas or
grown substantially in the last year, makes
incorporating these options technically difficult.
3.4 Infer Ski-level for Days-ridden and
Trails to Be Accessed
Specifically for children, a social addition to the
skiing experience could be using a child’s lift access
data, to provide a quiz for children containing simple
questions about where they skied during a specific
day, such as “did you ride a chair lift today?” or “did
you go on a tbar today?” Admittedly, this would be
difficult to make accurate but still be interesting for
all age-levels. Within the Pulveriser children’s
learning area there is a mixed poma and T-bar lift
that does not have a RFID reader at the base of it,
which could result in a child riding a T-bar, yet the
ride not being registered to their pass. Other options
could include general skiing questions for children
about safety on the hill, as well as challenges such as
“find the height of Mount Kosciusko”, or whatever
peak may be shown on any given trail maps.
4 PROTOTYPE
In line with a design science approach to
‘instantiation’, the following introduces a prototype
system. In this case the system relates to one resort
specifically being that of ‘Pulveriser’ in New South
Wales. One approach to working with the prototype
AnAustralianSkiResortSystem
67
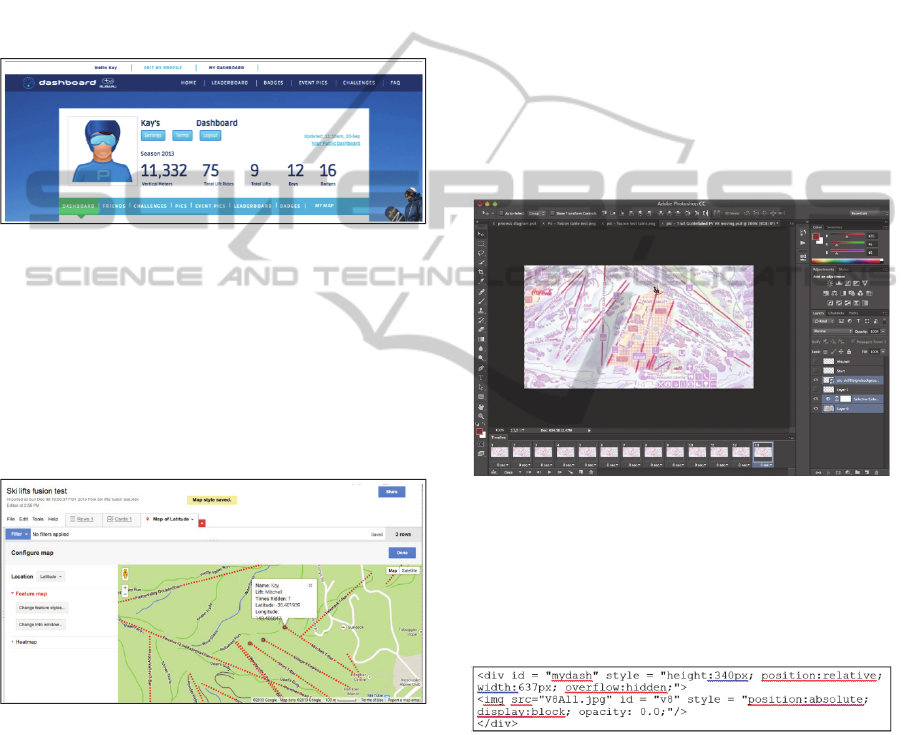
was to incorporate extra features which would be
located in a separate tab labelled “MY MAP” within
the layout of Pulveriser’s current dashboard, as
shown at the bottom of figure 1.
In order to visualize data that would be collected
from the RFID system of ski lifts taken throughout
the day and enhance the online service provided,
three different techniques were explored. Firstly
Google Fusion Tables, as the lift access data is
related to a geographical place within the resort,
where a google map could be used to display the
geographical data.
Figure 1: Pulveriser Dashboard with “MY MAP” tab.
In order to accomplish this process, a table was
created containing the names of three different lifts
and the longitude and latitude of their summits, and
the number of times it was ridden by any one user.
The resulting map is of this process is shown in
figure 2. The red dots illustrated relate to a row in
the table and can be selected to display further
detail.
Figure 2: Resultant map using Google fusion tables.
An added aspect to the prototype was to select a ski-
run of the Pulveriser ski resort map commonly
known as Front Valley, and alter the colour from the
original to allow an image to be seen more clearly
when the map was used as a background. Front
Valley has 3 major lifts servicing it, the Village 8
(V8 - that is an eight seater chair lift and two T-
bars), and two more slopes known as Mitchell and
Sturt. Mitchell is located on the right side when
looking at the map and Sturt on the left, with the V8
in the middle, the whole area is indicated by orange
hatch on the trail map. This section was chosen as it
is often the first access point for many skiers and
snow-boarders, as it is the first area to open and the
last to close each season.
Next a simple outline image of a skier riding a
chairlift was placed on top of the selected section of
the trail map as an extra layer to indicate a user’s
location. This indicator was placed along the route
of a lift to create a series of 12 separate images.
These images if displayed in sequence, visualize the
movement of a skier up a lift. Two methods of
displaying this visualization were implemented,
firstly a moving .gif file was created within
Photoshop using the 12 images each as separate
frames (figure 3). The second method of showing
the movement of a skier up a lift, used each of the 12
sequence pictures together as one picture, like a
filmstrip.
Figure 3: Using Photoshop to create a moving gif.
The image is loaded in to a div (division or a section
in an HTML document – figure 4), that has a set
height and width equal to that of one frame. The
overflow is hidden, giving the effect that the picture
is only of the rider at the bottom of the lift.
Figure 4: Div section in HTML.
A javascript function (figure 5 – following page) is
then used to change the position of the frame along
the filmstrip, showing each frame for a set time
interval, currently set to a tenth of a second, however
this can be changed if required.
While this is not a suitable visualization method
for resort guests, it could be utilized within the resort
for staff members who are already familiar with the
lift layout. A table of currently working instructors
with details of the last lift they rode, may be useful
ICEIS2015-17thInternationalConferenceonEnterpriseInformationSystems
68

for managers to see where lessons are currently
taking place around the mountain, or finding out
who is in a certain area if assistance was required.
James Niehues, a resort and panoramic artist, has
made a living creating maps for over 75% of the
large ski resorts (Harris, 2006), including areas in
the US, Canada, New Zealand, Australia, Japan and
Korea. Each one is hand-painted using watercolour
and many aerial photographs for reference, bringing
everything into a single view while maintaining
accuracy of relationships between elements. A
section of one of his ski maps was used for the final
two visualizations. Although the final 2
visualizations essentially achieve the same result and
look the same to the user, they were created using
two very different methods, namely animated .gifs
as well as a filmstrip picture. Examining the file size
of each of these methods for a single lift
visualization of the V8, the animated .gif file is
213KB yet the filmstrip is considerably bigger at
2.4MB.
Figure 5: Javascript function to change position.
Each of the individual pictures used to create the
filmstrip was 201KB, the quality of each could be
reduced to create a smaller filmstrip file if needed.
As the filmstrip is considered to be one file, the
whole file will be loaded just 1 time when the
corresponding web page is visited. The loading of
such a file compared to multiple individual files, has
implications for speed of page loading, efficiency
and accessibility. Although single lift rides can be
visualized with the current prototype, linking more
than one is a long process requiring editing of files
within Photoshop. The time frame between the
display of each frame of the filmstrip can be altered
within the JavaScript, this may be necessary if
multiple lift rides are simulated to keep the length of
the animation to a minimum.
4.1 Further Work
Naturally there is further work for the resort to
consider, including options of displaying multiple
lift rides without editing Photoshop files, allowing
reusability for many different combinations of routes
taken. Possible solutions could include: an in-depth
look at CSS options allowing the background to be
separate from the moving lift picture - reducing the
file size of each frame or allowing a HTML5 canvas
to be used. Alternatively one could use JavaScript to
order events and add a time delay where necessary,
allowing the move-skier function to be called
multiple times but for different lifts, and displayed in
an order that reflects pass data.
Once multiple lift rides are displayed in a
satisfactory manner, it is possible to link the lift
rides undertaken by any given skier in their own part
of the resort database, so as to enable an individual
visualization to be created dynamically for each user
within their own personal dashboard. The idea being
largely a social one in this case so that the skier is
able to show their friends what they have done and
make recommendations for others. Different options
could be available, such as last the 10 ski-lift rides
undertaken for perhaps a whole day, or the whole
week. A limit of how many lift rides may need to be
imposed to offer a balance between page loading
speed, visualization length and quality of images. An
option to customize the version of the resort map
displayed could be added, allowing a clearer view of
different resort areas if a user did not need to see the
entire map, for example just Guthega runs (a
separate area of the Pulveriser resort), could be
displayed on a Guthega specific map which would
be easier to see due to different aspects of the hill.
One can imagine the impact of these
recommendations particularly amongst the social
extroverted and Facebook savvy Generation Y.
5 CONCLUSIONS
Digital representations of ski resort access data
offered to users depend heavily upon the data
collection method employed at each resort. Two
different online displays of ski statistics were
compared and additional functionality considered.
An alternative visualization was developed within
the constraints of the data available, showing lifts
ridden using a resort map. The digital offering a
resort can produce is limited by the data it obtains
from tickets and passes. While many sport tracking
networks use global positioning from a mobile
AnAustralianSkiResortSystem
69

devices, the data collected from RFID passes at the
resort investigated here (Pulveriser), only provides
information about which lifts were ridden, there are
often many routes that can be taken from the top of
one lift to the bottom of another. Such data is
collected using High Frequency RFID enabled
passes and readers positioned at the bottom of each
lift. With over 200 million skiers worldwide and
many resorts adopting RFID ticketing solutions,
online offerings have been labelled the ‘evolution of
the skiing industry’. For the resort in question,
online statistics are currently displayed via a
dashboard that uses bar graphs, pie charts and tables
to show which lifts have been ridden and how many
vertical meters have been skied. Five of the nine
well known ski resorts in Australia currently have
RFID ticketing systems in place, with only one of
those providing access to personal statistics online,
which suggests a huge growth area in future years.
A visualization of a single lift ride was
developed using a filmstrip of different frames put
together in Photoshop to create an animation when
displayed in sequence on a web page, whereby
JavaScript was used to move through the frames. A
Google-Maps image was trialled for this
visualization but deemed unsuitable leading to the
resort map developed by James Niehues, being used
as the background for further tests. Further work
would involve expansion of the visualization created
as shown here, developing a method that could be
linked with resort data to dynamically produce a
visualization of multiple lifts ridden in varying
combinations, to reflect the actual course of a skier
throughout a day or given time period. The social
implications of such an action are particularly
relevant to the age group most interested in such
physical and social activities.
REFERENCES
Anon. Mar 2, 2003. “RFID makes a Splash at Water Park”
RFID Journal URL: www.rfidjournal.com/
articles/view?326 (last accessed 12 June 2014).
Anon. Oct 6, 2011. RFID News Roundup – Mammoth
Mountain Plans Mammoth RFID Installation URL
www.rfidjournal.com/articles/view?8846 (last
accessed 12 June 2014).
Barto, S., 2009. First European Ski Resorts to Start Using
U.S.-Developed RTP Enterprise POS Software:
Colorado-based Resort Technology Partners opens
Denver office to support expanding business. PR Web
URL: http://www.prweb.com/releases/RTP_software
/European_Ski_Resorts/prweb3265124.htm (last
accessed 12 June 2014).
Bederson, B., Shneideman, B., eds. 2003. The Craft of
Information and Visualisation: Readings and
Reflections: A volume in Iterative Technologies 1st
edition Elsevier.
Collins, J., April 5, 2004. “Tracking Skiers for a Good
Cause” RFID Journal URL: www.rdfidjournal
.com/articles/view?860 (last accessed 12 June 2014).
Dunlop, M, Elsey, B., Masters, M., 2007. “Dynamic
Visualisation of Ski data: A Context aware Mobile
Piste Map” MobileHCI '07 Proceedings of the 9th
international conference on Human computer
interaction with mobile devices and services pp: 375-
378.
Harris, A., 2006. Fortune on CNNMoney.com- You do
what? URL: http://money.cnn.com/popups/2006/
fortune/youdowhat/frameset.exclude.html (accessed
22nd December 2013).
Jambon, F., Meillon, B., 2009. “User experience and
evaluation in the wild” CHI EA '09 CHI '09 Extended
Abstracts on Human Factors in Computing Systems
pp: 4069-4074.
O’Conner, M., Jun 04, 2008a. “Alta Opts for RFID Lift
Tickets” RFID Journal URL: www.rfidjournal
.com/articles/view?4110 (accessed 12th June 2014).
O’Connor, M., July 15, 2008b. “Vail Picks New Line with
UHF RFID powered Passes” RFID Journal URL:
http://www.rfidjournal.com/articles/view?4193 (last
accessed 12th June 2014).
O’Connor, Mary Catherine, September 3, 2010. “Vail
resorts Links RFID with Social Media” RFID Journal
URL: www.rdfidjournal.com/articles/view?7845 (last
accessed 10th October 2013).
Ojala, J & Saarela, J., 2010. “Understanding Social Needs
and Motivations to Share Data in Online Sports
Communities” MindTrek '10 Proceedings of the 14th
International Academic MindTrek Conference:
Envisioning Future Media Environments pp: 95-102.
Rafter, M., Jun 4, 2008. “Aspen Signs with Skidata, RTP
for integrated RFID/POS System” RFID Journal
URL: www.rfidjournal.com/articles/view?4111 (last
accessed 12th June 2014).
Recker, J., 2013. Scientific Research in Information
Systems: A Beginner’s Guide Springer Berlin.
Swedberg, C., Aug 25, 2010. “RFID Helps Make Friends
for Israeli Teens” RFID Journal URL:
www.rfidjournal.com/articles/view?7830 (last
accessed 12th June 2014).
Swedberg C., Jun 7, 2012. “RFID wins Gold with US Ski
and Snowboard Team” RFID journal URL:
www.rfidjournal.com/articles/view?9598 (last
accessed 12th June 2014).
Violino, B., Jan16, 2005. “The Basics of RFID
Technology” RFID Journal URL: www.rfidjournal
.com/articles/view?1337 (last accessed 12th June
2014).
ICEIS2015-17thInternationalConferenceonEnterpriseInformationSystems
70
