Visualization 3D Reconstruction
Volume Rendering of Mucus into Paranasal Sinuses
Rodrigo Freitas Lima and Mauricio Marengoni
Postgraduate Programme in Electrical Engeneering, Mackenzie Presbyterian University, Sao Paulo, Brazil
Keywords:
Medical Images, Computer Tomography, Visualization Toolkit, Insight Toolkit, Volume Rendering, Segmen-
tation, Computer Vision, Paranasal Air Sinuses.
Abstract:
This position paper explains our method for segmenting and volume rendering in computer tomography im-
ages. Our application is developed to reconstruct craniofacial objects in 3D visualization using insight toolkit
and visualization toolkit frameworks. We intend to quantify volume rendering of mucus found in CT images
and analyze the data which is an important tool in sinus disease treatment. Two algorithms were implemented
in order to compare the results: an automatic segmentation and a manual method. Both solutions presented
some issues that will be discussing in the next sections.
1 INTRODUCTION
In this position paper, we discuss new solutions to
segment and visualize 3D Computer Tomography
(CT) images.
Computer Vision (CV) is an important tool to
Medical Diagnosis, with emphasis on segmentation
and image processing (Szeliski, 2011). Visualiza-
tion, in CV is a transformation of data or informa-
tion in pictures. Two open-sources software help
us to work with visualization. Visualization Toolkit
(vtk) is a C++ class library that supports volumet-
ric methods and advanced modeling techniques while
Insight Toolkit (itk) is a medical library that imple-
ment image processing algorithms and segmentation
tools(Schroeder et al., 2002).
We applied visualization in craniofacial CT im-
ages and demonstrated how works segmentation and
visualization adopting vtk.
Computer tomography has a long history start-
ing with a X-Ray discovered in 1895, by Wilhelm
Conrad R
¨
ontgen (1845-1923). Allen MacLeod Cor-
mack (1924-1998) and Sir Godfrey Hounsfield (1919-
2004) were pioneers of medical computer tomogra-
phy (Buzug, 2008). Sir Godfrey Hounsfield also
transformed attenuation values, normally represented
in gray values, onto a dimensionless scale and re-
lated to attenuation value of water. These values is a
quantitative scale for describing radiodensity (Buzug,
2008).
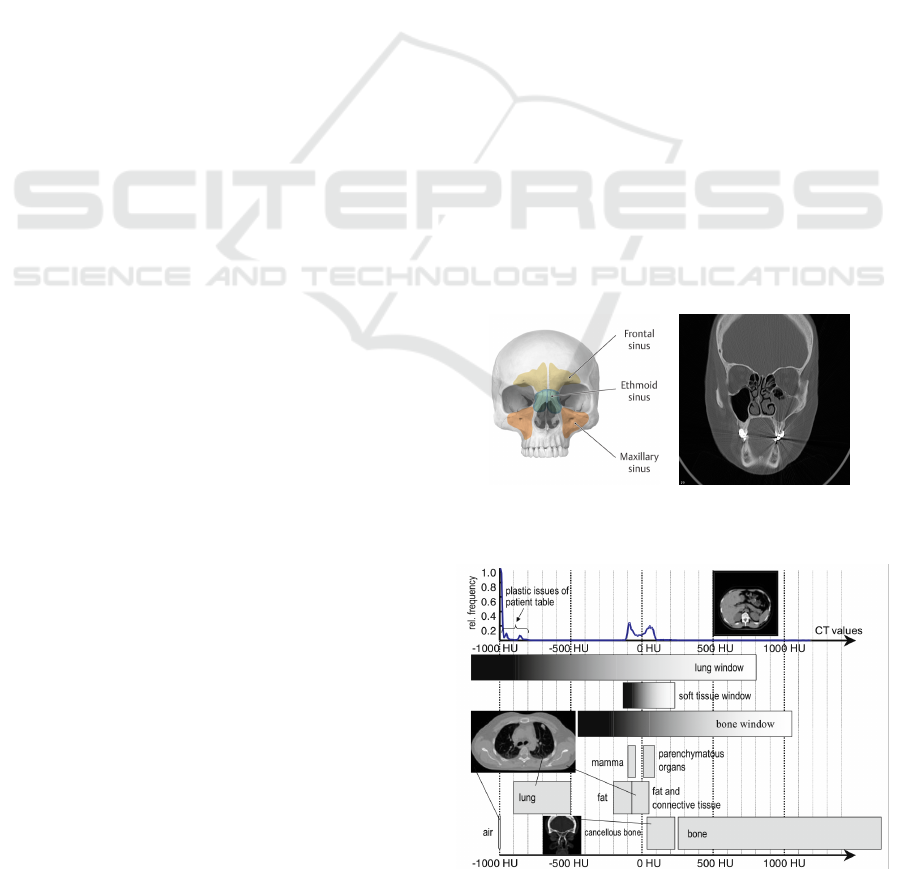
Craniofacial CT, Figure 1, can illustrate where is
(a) (b)
Figure 1: Paranasal air sinuses (Gilroy et al., 2012).
Figure 2: Hounsfield Units (Buzug, 2008, p. 477).
the region of interest and where mucus accumulates
in paranasal sinus.
Figure 2 illustrates common HU of body human.
On CT images, the mucoid attenuation HU is simi-
215
Lima R. and Marengoni M..
Visualization 3D Reconstruction - Volume Rendering of Mucus into Paranasal Sinuses.
DOI: 10.5220/0005359102150220
In Proceedings of the 10th International Conference on Computer Vision Theory and Applications (VISAPP-2015), pages 215-220
ISBN: 978-989-758-091-8
Copyright
c
2015 SCITEPRESS (Science and Technology Publications, Lda.)
lar to or less than paraspinal skeletal muscle, +10 to
+40 (Agarwal et al., 2010). According to Cummings
Otolaryngology, two cases need to be analyzed; when
sinus secretions are acute and of low viscosity, the HU
range is from +10 to +25; In chronic state, sinus se-
cretions become thickened and concentrated and the
HU range have density measurements of +30 to +60
Hounsfield units (Flint et al., 2010).
Drebin, Carpenter and Hanrahan, 1988, proposed
that these values could be used to classify volume in
CT images. They used transfers functions for this
classification. Transfer function can map information
at a voxel location into different values such as mate-
rial, color and opacity. Levoy, 1988, created a new
method, adding a gradient magnitude dimension to
the specification of a transfer function because clas-
sify a volume just based on scalar value was not capa-
ble of isolating an object (Drebin et al., 1988; Levoy,
1988; Schroeder et al., 2002).
Levoy, 1988, found several problems when the im-
age has slight changes in opacity ramps or when inter-
polation methods radically alter image features. Tot-
suka and Levoy, 1993, proposed a new volume ren-
dering method that works in frequency domain, dif-
ferently from conventional methods that works in spa-
cial domain. This method results less reality images
because do not shows occlusion.
This paper proposes a new application and a mix
of techniques that can segment and visualize small
ranges of HU index. The itk library is used to process
and segment, while vtk renders and quantify accumu-
lated mucus.
2 RELATED WORK
Silva, 2008, described an active shape method (asm)
to finding and segmenting mucus in computer to-
mography images, however he has not implemented
Hounsfield values and 3D reconstruct.
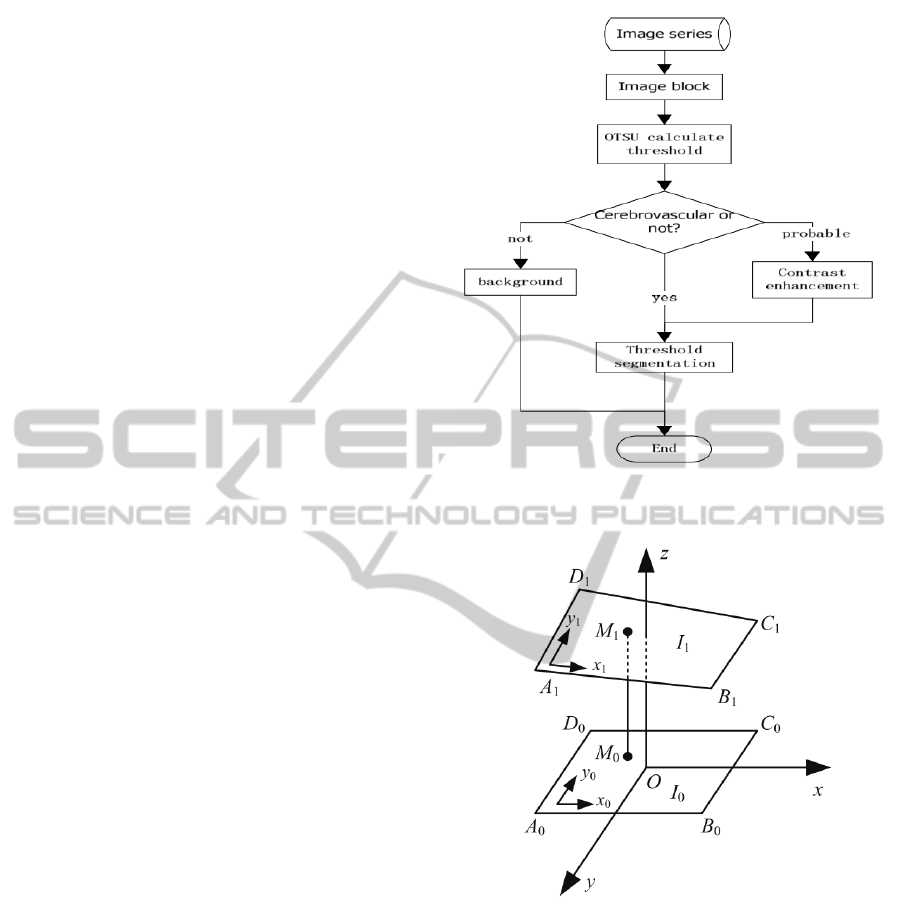
Zhang, 2012, combined a sub-block Otsu Algo-
rithm, and image enhancement, with anisotropic dif-
fusion filters to improving contrast and protect edges
(Zhang et al., 2012). This process is explained in Fig-
ure 3.
We intend to use local optimal threshold segmen-
tation (Zhang et al., 2012) to resolving the same sub-
ject that Silva (2008) was working.
Yan et al., 2012, proposed reconstruct the gas-
trointestinal tract in three dimension adopting a CR
or MRI images. They used Matlab for image registra-
tion, photoshop to perform the segmentation and the
vtk to reconstruct and visualization.
Figure 4 shows an image registration process
Figure 3: The process of image segmentation (Zhang et al.,
2012).
Figure 4: Image Registration (Yan et al., 2012, p. 24).
where I
0
is the reference while I
1
is the image to be
registered. Then, the method creates a relationship
between any point M
1
(x
1
, y
1
, z
1
) in the point I
1
and
the point M
0
(x
0
, y
0
, z
0
) at the identical position in the
I
0
.
Wang et al., 2014 improved the Marching Cubes
(MC) algorithm. This method is fundamental for
classification volume process and is a widely routine
used to extract isosurfaces from volumetric data set.
The MC technique divides volume data set into cells
and then create triangles to approximate isosurfaces
within each cells.
Standard MC method generates the type A ”hole
VISAPP2015-InternationalConferenceonComputerVisionTheoryandApplications
216
problem” which occurs when at least one cube face
has an intersection point in each of its four edges. The
type A happens because the MC process each cell se-
quentially without considering the neighboring cells
of an active cell. This method requires each cell to be
visited at least once to ensuring its activeness prop-
erty.
Wang et al., 2014, proposed to use Adjacent
Lookup Table (A-LUT) to improving performance.
A-LUT method is used to guide which cells to visit
from a given cell. MC and A-LUT method together
can segment more efficiently and fast than standard
MC. Also this technique detects more objects because
AlutMC can find limits between different isosurfaces.
3 METHOD
Our method is implemented in C++ using itk 4.7 and
vtk 6.1. The project was created using object oriented
programming benefits. Itk and vtk are a freely open-
source software, the first is for image processing and
registration and the second for 3D graphics and vi-
sualization. Both library works with Digital Imaging
and Communications in Medicine (DICOM) and we
can link these frameworks making a conversion be-
tween platforms.
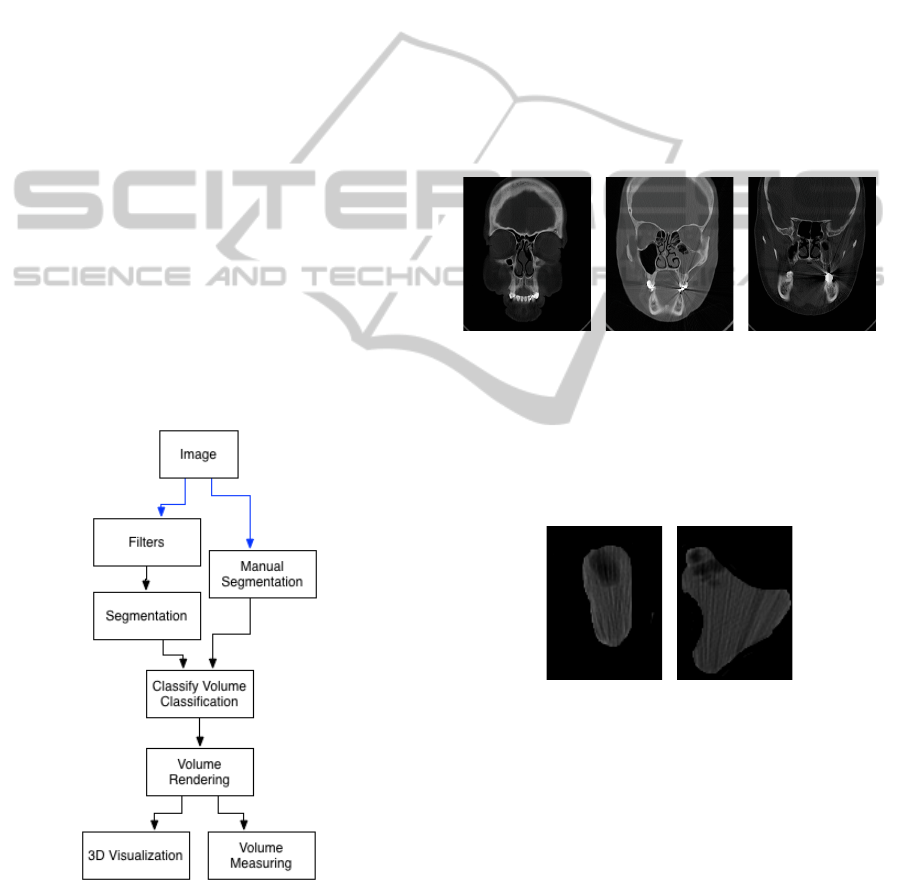
Figure 5: Our method.
In this position paper, we use DICOM images
from Silva, 2008, qualification work. Silva analyze
seven dataset DICOM series from different people.
Two different segmentation techniques were imple-
mented; one automatic, with image processing be-
fore segment and other manual, just to compare re-
sults with automatic segmentation. Figure 5 show all
steps from our solution.
3.1 Manual Segmentation
Manual Segmentation uses same DICOM images as
automatic process. This DICOM serie has 34 images,
but maxillary sinus appear from 12 to 26.
Figure 6(a) and 6(c) shows the start and finish im-
ages in this process. It is important to know that this
sequence is not generic and results can be compared
just if the automatic process use the same DICOM se-
quence. This process is just a method to compare both
results.
(a) 12 (b) 19 (c) 26
Figure 6: DICOM image sequence.
Figure 6(b) shows left maxillary sinus with an in-
flammatory process. MIPAV medical software for ed-
ucational purpose was used to cut the region of inter-
est as the Figure 7 illustrates.
(a) (b)
Figure 7: Manual maxillary sinus segmentation.
The volume will be segmented and results will be
used to compare with automatic process. We can see
all process in Figure 5.
3.2 Image Processing and Segmentation
This process is necessary to image enhancement. Fil-
ters can remove noise to improving results in segmen-
tation process. Silva, 2008, used in his work median
filters and high pass filters to removing almost noises
(SILVA, ROBSON LU
´
IS, 2008).
Visualization3DReconstruction-VolumeRenderingofMucusintoParanasalSinuses
217
Vtk has some class, see Section 3.3, that can filter,
segment and render the surface. The vtk classifica-
tion method uses a Marching Cubes (MC) technique
to filtering surfaces that represent a constant valued
scalar function. MC method, implemented in vtk, re-
sulted an unsuccessful segmentation on small ranges
in Hounsfield Index. Itk will be used to filtering and
to segmenting before starting volume rendering in vtk
library (Schroeder et al., 2002).
The itk library has algorithms that can classify the
volume of the object with Hounsfield Units, like vtk,
but before, the itk library will be used to reduce noise
and prepare image for segmentation and visualization.
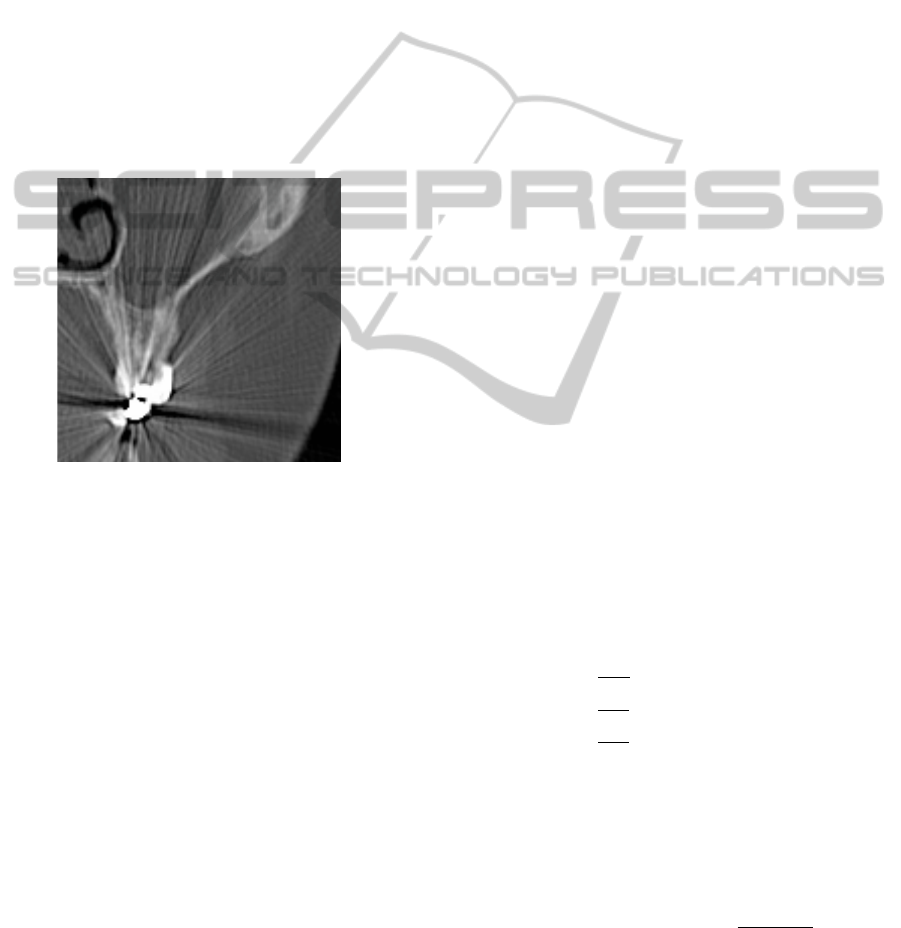
Noises with high density materials, like metal arti-
facts in dental fillings, generates a noise in CT im-
ages that need to be solved before image segmenta-
tion. Figure 8 show this problem.
Figure 8: Metal artifacts in CT image.
Metal artifacts reduction (MAR) methods can re-
move this noise. Wang et al., 2013, proposed a
new method, FP-MAR, that consists of an interpola-
tion method with an edge-preserving blur filter (Wang
et al., 2013). This process needs to be as efficient as
possible for a good segmentation then be done.
Itk and vtk have good methods to segmenting CT
images. One of them is the Threshold method that can
cut a region of interest using a normalized HU range
or value.
3.3 3D Volume Rendering
Previous results, like image processing and segmen-
tation techniques, have a big importance for this pro-
cess. Images with metal artifacts or other types of
noise need special and effective filters. Vtk is the
main tool for this process. In reconstruction process,
we use from the output segmentation process infor-
mation which consist in a vtk data type, more pre-
cisely, image data.
Three important algorithms for volume rendering
will be tested, vtkMarchingCubes, vtkContourFilter
and vtkContourFilter with vtkPolyDataNormals. Vtk-
MarchingCubes is a specific class to generating vol-
ume data and this class use an image data with dataset
type. Other two algorithms are generally used for
generics operations. Generality, generics operations
have more cost in a CPU times and specialization in
programmer time (Schroeder et al., 2002).
VtkMarchingCubes implements MC technique
and is more efficient than other two methods because
it can render the volume with more resolution and pre-
cision and works with the same dataset type that DI-
COM images (Schroeder et al., 2002).
3.4 Volume Measuring
After volume rendering we need measure how much
mucus has in this selected volume. Vtk provides al-
gorithm called vtkMassProperties to do this, based in
Alyassin A. M. et al., Evaluation of new algorithms
for the interactive measurement of surface area and
volume, 1994 (Kitware Inc., 2014).
In Alyassin A. M. et al., 1994, paper, they analise
two different techniques for open and close planes,
one for volume other for surface area. For this paper,
the volume measurements technique in close planes,
MUNC (Maximum Unit Normal Component) and
DTA (Divergence Theorem Algorithm), is essential
to finalize the entire process.
The MUNC algorithm calculates normal vectors
components from pointlist using the gradient of the
image function f(x,y,z) at the marked surface points.
The magnitude of the normal vector for each point
in the pointlist normalize the gradient. The surface
area is estimated using voxel counting to sum marked
voxels (Alyassin et al., 1994).
The ∆a
i
is the differential surface area and is cal-
culated as,
∆a
i
=
∆x∆y
|n
z
i
|
, if n
z
is the MUNC
∆x∆z
|n
y
i
|
, if n
y
is the MUNC
∆y∆z
|n
x
i
|
, if n
x
is the MUNC,
(1)
where ∆z, ∆y and ∆x are dimensions and n
x
, n
y
and n
z
are the unit normal vector components. If ∆z =
∆y = ∆x = 1, then we can reduce the differential area
to the reciprocal of the absolute value of the MUNC.
In this case, surface area is calculated as,
surface area =
n
∑
i
∆a
i
=
n
∑
i
1
|MUNC
i
|
. (2)
The DTA estimates the volume of an object, from
its pointlist and the following equation estimated the
volume.
VISAPP2015-InternationalConferenceonComputerVisionTheoryandApplications
218
volume = k
x
∑
i
(x
i
n
x
i
∆a
i
) + k
y
∑
i
(y
i
n
y
i
∆a
i
)
+k
z
∑
i
(z
i
n
z
i
∆a
i
),
(3)
Where ∆a
i
is defined by Equation 1; x, y and z are
coordinates; k
x
, k
y
and k
z
are coefficients whose sum
is equal 1 and are defined as the fraction of the total
number of points in which the MUNC of those points’
gradient vector was in the direction indicated by the
subscript coefficient. DTA method requires a smooth
and closed surface (Alyassin et al., 1994).
More details about MUNC and DTA meth-
ods(open and close), refer Alyassin et al., 1994.
4 EXPERIMENTAL RESULTS
Initially, we wanted to segment mucus in paranasal
air sinus adopting a simple vtk process and using a
Hounsfield Unit (HU). Until now we can not resolve
this problem, because vtk process can not segment
small HU ranges.
Manual segmentation was implemented to com-
paring precision in automatic process. Figure 9 illus-
trate these results.
(a) (b)
Figure 9: Manual segmentation reconstructed.
Current manual segmentation method fails when
tries three-dimensional reconstruct, Figure 9(b). After
cut and convert original DICOM in PNG segmented
image the object loses dimensional and slice distance
values and results bidimensional image. After insert
slice and dimensional values, the results are improved
but the three-dimensional image not ilustrate real vol-
ume.
Improvements in manual segmentation are being
performed. We are testing this process without PNG
conversion, using region of interests cut algorithm im-
plemented in itk library to segmenting without con-
vert format.
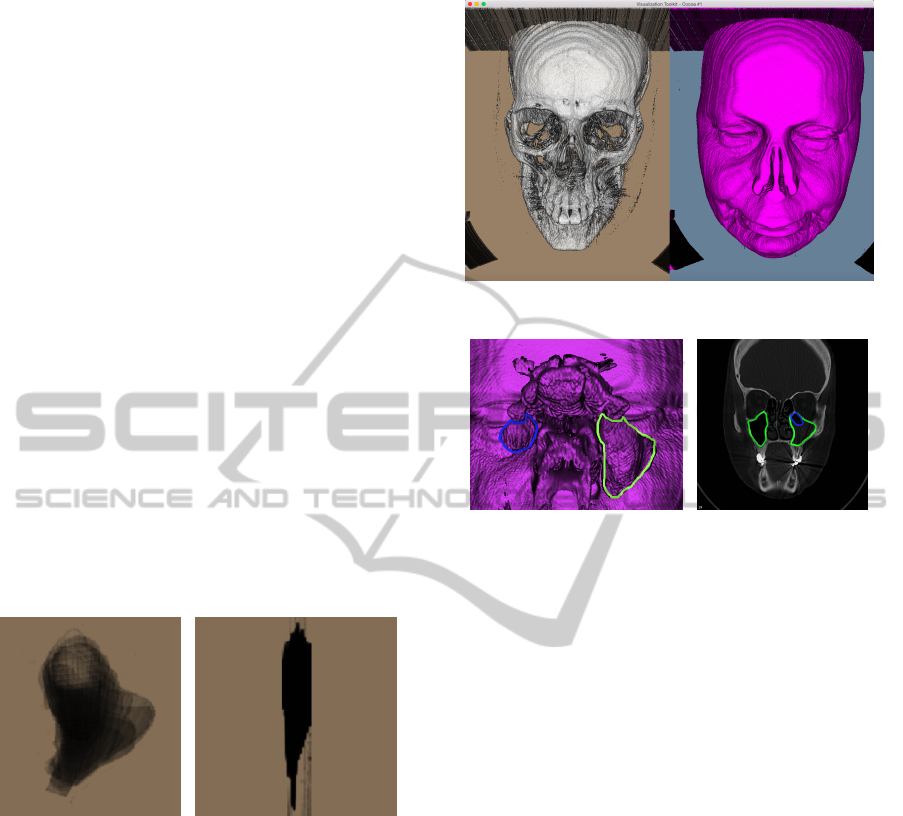
Automatic process results a successful segmenta-
tion according to Figure 10 shows. Classify surfaces
Figure 10: Volume rendering with vtkMarchingCubes.
(a) (b)
Figure 11: Maxillary sinus rendered (a) and detached max-
illary sinus on CT image (b).
using HU values have some problems when the val-
ues are similar or are part of the same window, like
soft tissue (-125 to +225) and mucus (+10 to + 40).
Has been shown in Figure 11(a), the right maxil-
lary sinus (on the left after rotation), green contour, is
bigger than left maxillary sinus in blue contour, be-
cause this process until now can not render the mucus
volume and just render air spaces as the Figure 11(b)
shown.
5 CONCLUSIONS
Classify and visualize the volume of the object us-
ing vtk proved be a simple process when the goal is
surfaces like bone or all soft tissues together. This
work is researching a method more accurate to extract
a small HU range. Until now, filters and independent
segmentation method to improving the objective help
but not solved all the problems.
Conversion between itk and vtk worked fine. In
Manual process, the conversion of segmented image
in PNG lost all DICOM information and even if di-
mensional and slices values are inserted, the method
can not render as we expected.
We can not compare Manual and Automatic pro-
cess until we solve the problems in our algorithm,
Visualization3DReconstruction-VolumeRenderingofMucusintoParanasalSinuses
219

then we do not have measurement results with both
process.
Has been shown in Figure 11, the process can not
render mucus volume. We need improve our methods
and research in others bibliographies about HU for
sinus inflammatory process.
The next steps will be experimented new methods
and implemented more tests with this algorithms and
others, like Silva, 2008, with active shape models, but
considering hounsfield units.
New DICOM image series without metal artifacts
noise will be added to compare results and Wang et
al., 2013, techniques will be implemented to resolving
metal artifacts noises.
ACKNOWLEDGEMENTS
Rodrigo Freitas Lima would like to thank Mackenzie
and CAPES for financial support.
Mauricio Marengoni would like to thank FAPESP-
Brazil for a travel grant.
REFERENCES
Agarwal, R., Khan, A., Gupta, D., Aggarwal, A. N., Sax-
ena, A. K., and Chakrabarti, A. (2010). An alter-
nate method of classifying allergic bronchopulmonary
aspergillosis based on high-attenuation mucus. PloS
one, 5(12):e15346.
Alyassin, A. M., Lancaster, J. L., and DOWNS III, J. H.
(1994). Evaluation of new algorithms for the interac-
tive measurement of surface area and volume. Medical
Physics, 21(6):741–752.
Buzug, T. M. (2008). Computed Tomography.
Drebin, R. A., Carpenter, L., and Hanrahan, P. (1988). ˜
Computer Graphics, Volume 22, Number 4, August
1988. 22(4):65–74.
Flint, P. W., Haughey, B. H., Lund, V. J., Niparko, J. K.,
Richardson, M. A., Robbins, K. T., and Thomas, J. R.
(2010). Cummings Otolaryngology - Head and Neck
Surgery. Elsevier, 5 edition.
Gilroy, A. M., MacPherson, B. R., Ross, L. M., Schuenke,
M., Schulte, E., and Schumacher, U. (2012). Atlas of
Anatomy.
Kitware Inc. (2014). VTK 6.2 Documentation.
Levoy, M. (1988). Display of Surfaces from Volume Data.
D:1–10.
Schroeder, W., Martin, K., and Lorensen, B. (2002). The
Visualization Toolkit. 3rd edition.
SILVA, ROBSON LU
´
IS (2008). Segmentac¸
˜
ao e Mod-
elagem 3D de Imagens de Tomografia Computa-
dorizada no Aux
´
ılio da Avaliac¸
˜
ao no Tratamento de
Asma.
Szeliski, R. (2011). Computer Vision. Texts in Computer
Science. Springer London, London.
Wang, J., Wang, S., Chen, Y., Wu, J., Coatrieux, J.-L.,
and Luo, L. (2013). Metal artifact reduction in CT
using fusion based prior image. Medical physics,
40(8):081903.
Yan, R. G., Guo, X. D., and Xu, C. (2012). Reconstruc-
tion and visualization of human gastrointestinal tract.
International Journal of Biomedical Science, 8(1):22–
27.
Zhang, B., Xing, Z., He, J., Yi, S., and Ma, L. (2012). Local
Optimal Threshold Segmentation and Reconstruction
of Cerebrovascular MRA Images. (Bmei):300–303.
VISAPP2015-InternationalConferenceonComputerVisionTheoryandApplications
220
