
Web-based Visualization Platform for Geospatial Data
Martin Hecher
1
, Christoph Traxler
2
, Gerd Hesina
2
, Anton Fuhrmann
2
and Dieter Fellner
3,4
1
Fraunhofer Austria, Visual Computing, Graz, Austria
2
VRVis, Zentrum f
¨
ur Virtual Reality und Visualisierung Forschungs-GmbH, Vienna, Austria
3
TU Graz, Institute of Computer Graphics and Knowledge Visualization(CGV), Graz, Austria
4
TU Darmstadt & Fraunhofer IGD, GRIS, Darmstadt, Germany
Keywords:
Geo-Visualization, Visual Analytics, Earth Observation, OGC, WebGL.
Abstract:
This paper describes a new platform for geospatial data analysis. The main purpose is to explore new ways to
visualize and interact with multidimensional satellite data and computed models from various Earth Observa-
tion missions. The new V-MANIP platform facilitates a multidimensional exploring approach that allows to
view the same dataset in multiple viewers at the same time to efficiently find and explore interesting features
within the shown data. The platform provides visual analytics capabilities including viewers for displaying 2D
or 3D data representations, as well as for volumetric input data. Via a simple configuration file the system can
be configured for different stakeholder use cases, by defining desired data sources and available viewer mod-
ules. The system architecture, which will be discussed in this paper in detail, uses Open Geospatial Consortium
web service interfaces to allow an easy integration of new visualization modules. The implemented software is
based on open source libraries and uses modern web technologies to provide a platform-independent, plugin-
free user experience.
1 INTRODUCTION
In the earth observation (EO) context a variety of
sensing devices is used to collect various types of in-
formation in different formats. With the continuous
evolution of technology the resolution and thus the
amount of acquired data is increasing constantly. Be-
cause of this overwhelming data amount and hetero-
geneous data sources it is hard, e.g., to find interest-
ing meteorological phenomenons or data correlations
between the heterogeneous datasets, especially if the
phenomenon or data correlation is not known before-
hand and cannot be searched for in an automatic way.
Tools providing efficient workflow to search and ex-
plore within heterogeneous earth observation data are
therefore key for selecting the interesting portions of
the input data for further processing, and to skip por-
tions containing non-useful data. Secondly, compar-
ing and analyzing data from different data sources
plays an important role in the field, e.g. when compar-
ing a computed scientific weather model output with
the actual satellite data to assess its accuracy.
In this paper we describe a web-based visualiza-
tion platform focusing on a ”Browse & Discover”
workflow to search through huge data repositories
from Earth Observation (EO) missions (e.g., imagery
and volume data from a satellite sensors), as well as
on a ”Compare & Analyse” workflow to assess data
from multiple EO sources. The development of the
platform and a reference prototype is embedded into
the research project V-MANIP (Multidimensional Vi-
sualization and Manipulation of Data). In this paper
we focus on the ”Visualization” subsystems of the
project. V-MANIP is used by scientific users such as
environmental analysts or meteorological office per-
sonnel which require access to EO data to support
their research or decision support process. In the
project, requirements were collected to base the sys-
tem architecture on. These requirements where de-
fined together with the meteorological science com-
munity. Use cases were also defined to validate the
platform. A description of the use cases can be found
in Section 3, results of the validation are part of Sec-
tion 5. A demo of the V-MANIP prototype can be
found at http://demo.v-manip.eox.at.
The described platform is conceptually divided
into a frontend layer running in the web browser as
a web application, and a backend server layer. The
frontend provides the general user interface, as well
as a set of viewer components for visualizing EO
311
Hecher M., Traxler C., Hesina G., Fuhrmann A. and Fellner D..
Web-based Visualization Platform for Geospatial Data.
DOI: 10.5220/0005359503110316
In Proceedings of the 6th International Conference on Information Visualization Theory and Applications (IVAPP-2015), pages 311-316
ISBN: 978-989-758-088-8
Copyright
c
2015 SCITEPRESS (Science and Technology Publications, Lda.)
data. The backend server is responsible for prepro-
cessing the raw input data from different data sources
into formats which can be visualized at interactive
frame rates in the web application. The communi-
cation between the two layers and the internal com-
ponents within the layers are handled through Open
Geospatial Consortium (OGC) standard and proposed
standard protocols.
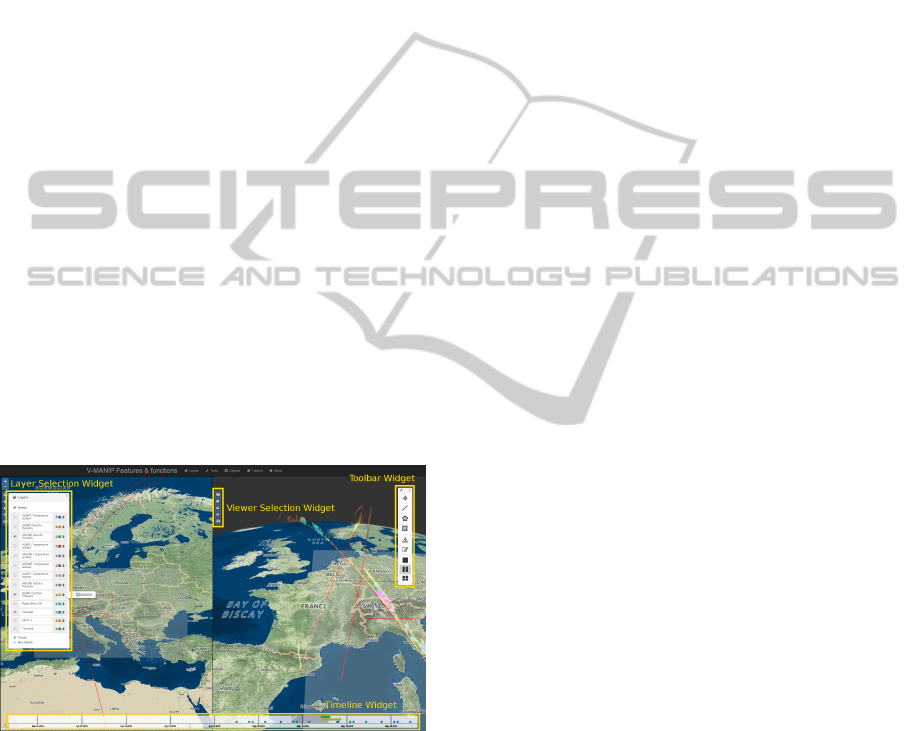
The web application provides a user with a set of
default graphical widgets to perform operations com-
mon for the collected use cases. Figure 1 shows the
graphical user interface of the application. A ”Layers
Selection Widget” allows to select which data sources
are displayed. A ”Timeline Widget” gives the user
visual information where on the timeline data exists
for the selected layers. It also allows the user to se-
lect a time of interest (TOI) to show data available
in the selected timespan. To select an area of inter-
est (AOI) the ”Toolbar Widget” provides different se-
lection tools, including point, line, box and polygon
selections. One main goal of the V-MANIP platform
is to provide the user with the possibility to visualize
one or multiple data sources simultaneously in dif-
ferent viewers. For that reason a ”Split View” fea-
ture allows to divide the screen into a multi-window
setup. Each of the windows can have it’s own viewer
assigned. The viewers are synchronized to show the
same spatial area and they react on events like select-
ing different layers, AOI or TOI.
Figure 1: Web application GUI with default widgets: Layer
Selection, Viewer Selection, Timeline and Toolbar.
Four viewers are provided with the system: The
2D Map Viewer, the Virtual Globe Viewer (VGV),
the Rectangular Box Viewer (RBV) and the 2D Vi-
sual Analytics Viewer. The 2D Map Viewer is not
described in detail in this paper. It provides the visu-
alization of two-dimensional map imagery and vari-
ous overlay possibilities for displaying multiple data
sources together. The Virtual Globe Viewer (VGV) is
a 3D globe for displaying maps, overlays and 3D ge-
ometry. The Rectangular Box Viewer (RBV) displays
volumetric data using image stacks. The 2D Visual
Analytics Viewer provides analytics information for a
data selection.
2 RELATED WORK
Visualization of abstract data such as sensor val-
ues in the geospatial context has become more and
more important in recent years. Dykes (Dykes et al.,
2005) provide a survey of existing systems and future
trends of geo-visualization. As one example of com-
bining geographical and multivariate visualizations,
Butkiewicz et al. draw iconic representations (called
probes) of multivariate views as detail information for
certain spots of a geographical context (Butkiewicz
et al., 2008). As another example, Brooks et al. pro-
posed a hybrid 2D/3D approach by showing multiple
information layers on top of a base terrain (Brooks
and Whalley, 2008). Zhang et al. presented a visual
analytics framework to analyse climate data. They
provide linked views of parallel coordinates with a
Google Earth plug-in, where 2D diagrams are embed-
ded (Zhang et al., 2013).
In many cases, time also plays an important role
when analyzing geographical data. Andrienko et al.
have proposed multiple approaches for visualizing
spatiotemporal patterns, including methods based on
self-organizing maps (Andrienko et al., 2010). Kapler
et al. integrate time in 2D and 2.5D terrain visual-
izations as an orthogonal axis (Kapler and Wright,
2004). In order to display more general data, Tomin-
ski (Tominski et al., 2005) proposed several 3D icons
for embedding temporal multivariate data on top of
maps. In all these cases, spatial information is pro-
vided by more or less standard maps. In contrast, we
envision a tight combination of a 3D globe with linked
interactive views providing analytic capabilities.
There are some other web-based globe viewer sys-
tems. One of them is Cesium, which is a WebGL vir-
tual globe with an integrated map engine. It allows to
watch orbits of satellites or the ISS in real-time. Ce-
sium does not support linked split views and it is not
its aim to explore Earth observation data.
OpenWebGlobe is an open source virtual globe
SDK implemented on base of HTML5, WebGL and
Javascript. The project was initiated by the Institute
of Geomatics Engineering (IVGI) of the FHNW Uni-
versity of Applied Sciences and Arts Northwestern
Switzerland (IVGI) and released as open source in
April 2011. Since then the functionality is being ex-
tended continuously. The focus lies on processing and
rendering of massive 3D geospatial environments.
IVAPP2015-InternationalConferenceonInformationVisualizationTheoryandApplications
312
3 COVERED USE CASES
The V-MANIP project was driven by the input of the
research community to build a platform that helps sci-
entists in their daily work. For that reason real-life
use cases were defined that served as validation sce-
narios for the developed software. The following list
shows defined use cases, each use case shows the con-
figured web application for the scenario in a screen-
shot to give the reader an impression of the flexibility
and configurability of the system.
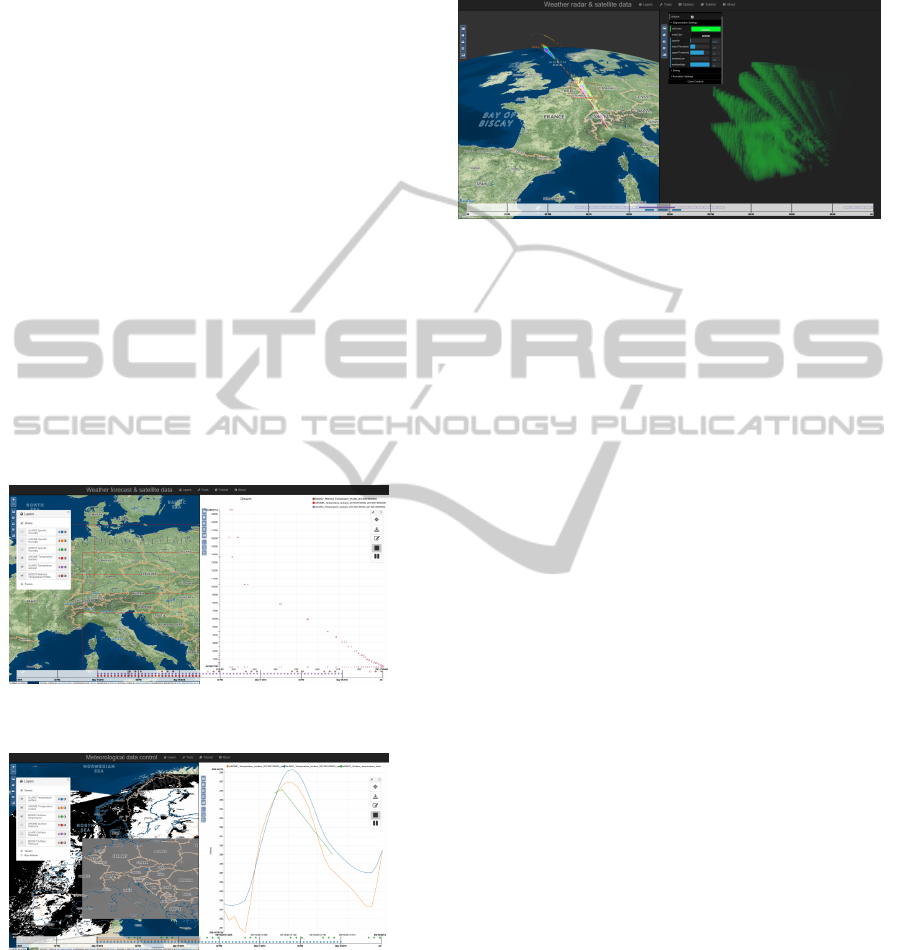
UC1: 3D Validation of Numerical Weather pre-
diction Model Output with Satellite Data to
verify the capabilities of the system to visual-
ize, analyze and compare multi-dimensional data
coming from numerical weather prediction mod-
els and satellite system (see Figure 2).
UC2: Data Quality Control of a Meteorological
Network with Satellite Data to test the ability of
the system for monitoring a meteorological net-
work and identifying suspicious ground measure-
ments with reference to satellite and numerical
weather prediction model data (see Figure 3).
Figure 2: [UC1] 3D validation of numerical weather pre-
diction model output with satellite data.
Figure 3: [UC2] Data quality control of a meteorological
network with satellite data.
UC3: Multi-dimensional Cloud Data Analysis
aims at verifying the capabilities of the system to
visualize and analyze two-dimensional and three
dimensional data coming from space-borne plat-
forms and on ground measuring systems (weather
radar). The main scope is to verify the possibil-
ity to see combined satellite cloud structure and
precipitation data combined with ground weather
radar observations (see Figure 4).
Figure 4: [UC3] Multi-dimensional cloud data analysis.
4 SYSTEM ARCHITECTURE
The V-MANIP sofware platform allows the registra-
tion and visualization of two and three dimensional
EO data. The registration and access control for the
data through the Data Preparation Subsystem and the
Security Subsystem are not part of this description.
This paper is focused on the 3D Client-Server Sub-
system and the Visual Analytics Client-Server Sub-
system. Figure 5 shows the system architecture as
a whole, including all subsystems. Each subsystem
consists of one or multiple components. The commu-
nication between the subsystems and components is
handled via standardized or standard candidate inter-
faces from the Open Geospatical Consortium (OGC),
namely the Web Map Service (WMS) , Web Map Tile
Service (WMS) , Web 3D Service (W3DS) and the
Web Processing Service (WPS) , which are linked in
the references.
4.1 3D Client-Server Subsystem
The 3D Client-Server subsystem (3DCS) is divided
into a frontend web client and a backend server sys-
tem. The web client is running within a Javascript
capable web browser with no additional plugins in-
stalled. It provides two viewer components: the Vir-
tual Globe Viewer (VGV) and the Rectangular Box
Viewer (RBV). The two viewers are responsible for
visualizing the EO datasets. For an interactive experi-
ence when browsing and displaying EO data it has to
be streamed to the VGV and RBV viewer efficiently.
The architecture foresees that CPU intense prepro-
cessing of the EO data is performed on the backend
server and the result is stored in a caching system.
This allows low-latency requests for the data from the
viewers. Two caches are implemented, one for 2D
images (Tile Cache) and one for 3D mesh data (Mesh
Web-basedVisualizationPlatformforGeospatialData
313
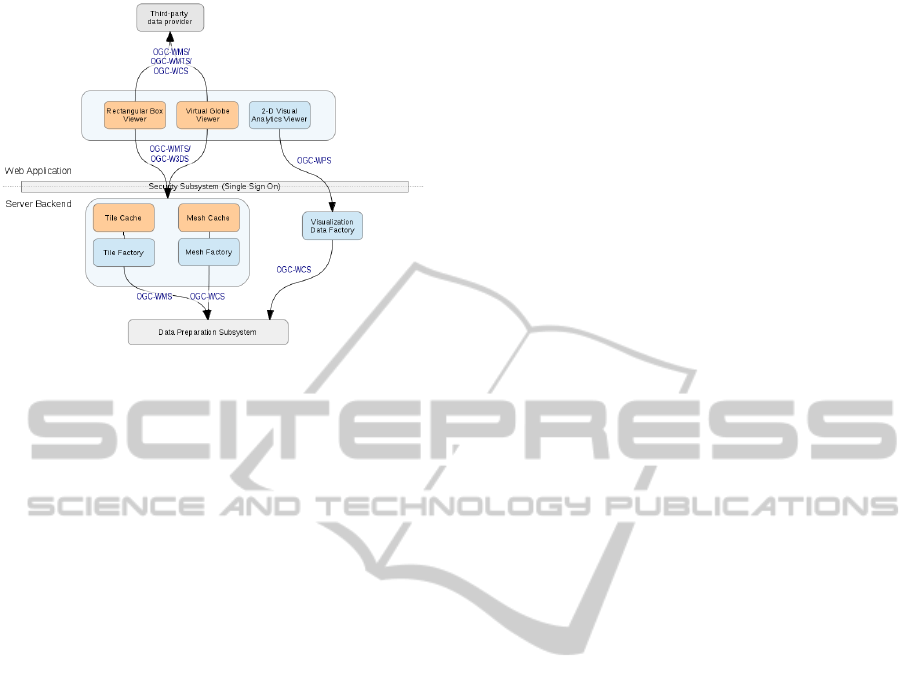
Figure 5: System architecture including all subsystems and
the interfaces between the subsystems’ components. This
paper describes a) the 3D Client-Server Subsystem includ-
ing the components colored in orange and b) the Visual An-
alytics Client-Server Subsystem including the components
colored in blue.
Cache). The preprocessing itself is done by the Fac-
tory system, which is described in Section 4.2.3 and
4.2.4. Figure 5 shows the architecture of the 3DCS
with the client and server components.
4.1.1 Virtual Globe Viewer
The web-based Virtual Globe Viewer component is
a globe application that allows a user to navigate on
the globe and to display 2D imagery data as layers,
as well as 3D geometry in a spatial context. The se-
lection tools from the Toolbox widgets allow to select
spatial areas to interact with the data, e.g. to examine
it in the 2D Visual Analytics Viewer (see 4.2.1).
The VGV is based on the open source library
GlobWeb (GlobWeb, 2014). This library was ex-
tended to visualize ”Vertical Curtains”, meaning that
a mesh comparable to a vertical plane is displayed on
the globe following the satellite track that captured
the sensor data with a certain inclination. The pre-
processed sensor data is mapped as a texture onto the
vertical mesh, forming a vertical curtain. The genera-
tion of the mesh (vertex positions, vertex normal and
texture coordinates) for a vertical curtain is done in
the Mesh Factory (see 4.2.4); the result is stored in the
Mesh Cache (see 4.1.4). Via the W3DS interface the
cached vertical mesh data is transferred to the Virtual
Globe Viewer via the OpenGL Transmission Format
(glTF, 2014), a compact, final stage transmission for-
mat to enable rapid delivery and loading of 3D content
optimized for WebGL. The glTF format also contains
web references to the textures mapped onto the mesh.
The referenced image data is fetched by the VGV af-
ter loading the glTF data via the WMTS interface of
the Tile Cache (see 4.1.3). Figure 4 shows a vertical
curtain example on the left.
4.1.2 Rectangular Box Viewer
The Rectangular Box Viewer (RBV) is a component
for visualizing data layers containing volume data,
e.g., radar data from a satellite. In selecting an AOI
and TOI via the application widgets the correspond-
ing volume data is loaded into the viewer for an inter-
active examination.
In the V-MANIP datasets volumetric-data is or-
thogonal to the view direction of the satellite. In
the data preparation module this data is added to the
system via multi-frame TIFF files, forming an image
stack with one defined axis orthogonal to the satel-
lite view direction. For the ease of description we
consider the case of a zero degree inclination of the
images (the second type in V-MANIP would be 45
◦
inclination), which means that the images are aligned
orthogonal to the vertical (with respect to the globe)
axis. The RBV will request an area of an images
stack via W3DS (where the images are contained in
a single container format), resulting in a certain num-
ber of images within the client. Image stacks for all
axes are prepared on the client side. A second visu-
alization option is to render the images in the stack
blended over each other (depending on the view di-
rection). The base software library for the RBV is the
XTK library (The X Toolkit (XTK), 2014).
4.1.3 Tile Cache
The Tile Cache component provides a cache of over-
lay images from V-MANIP layers as well as textures
to be applied to vertical curtains. The benefits of us-
ing a cache is that the on-the-fly production of the tiles
may be too time-demanding for a responsive user ex-
perience. A pre-seeded cache simply has to return
the requested tiles with little or no overhead regarding
the processing time for data creation. The data stored
in the cache is requested from the Mesh Factory and
stored in an WMTS compatible database structure.
The cached data can be requested by the web appli-
cation’s viewer modules via the WMTS protocol.
4.1.4 Mesh Cache
The Mesh Cache is located in the server backend and
stores all mesh information necessary to display ver-
tical curtains. The stored data consists of vertex po-
sition, vertex normals and texture coordinates to map
pre-processed texture images - which contain the ac-
tual EO information - onto the mesh. When the web
IVAPP2015-InternationalConferenceonInformationVisualizationTheoryandApplications
314

application requests a specific vertical curtain tile via
the W3DS interface the cache checks if the tile is al-
ready created. If not, the data is requested from the
Mesh Factory component, which creates the mesh in-
formation for the vertical curtain. The main purpose
of this cache is to enable fast data transmission to a
client. To ensure a reasonable transmission time to a
request it is necessary to keep the size of the trans-
mitted data at a minimum. This is taken care of in
using the glTF format as output format of the Mesh
Factory. glTF includes mesh compression algorithms
for minimizing the transmission size.
4.2 Visual Analytics Client-Server
Subsystem
The Visual Analytics Subsystem consists of compo-
nents to enable an interactive, visual analysis of Earth
observation data. It applies methods of information
visualization for in-depth visual exploration of com-
plex data and its relations. These components are de-
scribed in the following sub-sections.
4.2.1 Visual Analytics Viewer
The Visual Analytics Viewer provides different in-
formation visualization methods for interactive visual
analysis of Earth observation data. This allows de-
tailed investigation of selected data sets. Complex
data sets and their relations are intuitively compre-
hensible. It makes outliers and clusters easily percep-
tible. This subsystem is based on the Javascript li-
brary Data Driven Documents (D3) (Bostock, 2014).
A set of different interactive views has been selected
based on use cases, which are a box plot for statistical
analysis, a scatter plot showing data distribution, par-
allel coordinates for relations of multivariate values
and streamlines for direct visual comparison of time
series. It is embedded in a multi-view web client and
thus preservers the geo-spatial context.
4.2.2 Visualization Data Factory
The Visualization Data Factory is a component lo-
cated on the server backend and services various pro-
cesses through WPS. Requesting the execution of a
specific process with the expected parameters will re-
turn a result that can then be visualized by the 2D
Analytics Viewer component. The Visualization Data
Factory can access registered data directly as well as
execute various processes which return processing re-
sults.
4.2.3 Tile Factory
The Tile Factory generates data requested by the Tile
Cache (see 4.1.4) and serves it through WMS. Vol-
umetric data is represented by a stack of GeoTIFF
layers (Sazid Mahammad and Ramakrishnan, 2014).
Each layer represents a volumetric slice parallel to the
ground. This stack is converted by the Tile Factory in
an volumetric representation encoded in the NIfTI-1
data format (National Institutes of Health, 2014). The
Tile Cache requests volumetric data within the bounds
of a single tile from the Tile Factory, which crops and
merges the GeoTiff layers accordingly.
4.2.4 Mesh Factory
The Mesh Factory generates the 3D mesh and texture
data needed by the Virtual Globe Viewer, which re-
quests it via the Mesh Cache. The data is provided
to the Mesh Cache through the GetScene request, as
specified in the W3DS standard.
The Mesh Factory requests vertical curtain data
information from a database on the file system, which
was populated by the Data Preparation Subsystem.
This data is delivered as XML encoded sample points
along the satellite footprint path and height values,
and GeoTIFF (Sazid Mahammad and Ramakrishnan,
2014) images containing the actual measurements on
the vertical grid specified by these sample points.
These samples occur in continuous strips along the
satellites path on the ground. The Mesh factory has
to crop and merge them to the bounds of the tile re-
quested by the Mesh Cache. Special care has to be
taken to cover all edge cases that occur when clipping
geometric data on a spherical topology: wraparound
of coordinates over the 180
◦
meridian, singularities on
the poles and paths coinciding with tile borders. The
processed geometry representing the vertical satellite
measurements over time result in a dense geometric
mesh. To reduce the rendering load for the viewer, es-
pecially when many curtains are visible, the geometry
can be requested in several levels of detail. Both mesh
and textures are reduced, resulting in approximately
the same amount of data for all tile sizes. The mesh is
delivered as compressed binary data in the glTF for-
mat. The format is currently in the OGC’s standard
candidate phase and will in our opinion future-proof
our interface.
5 CONCLUSION
The target science communities were included in
a continuous evaluation process during the project.
Web-basedVisualizationPlatformforGeospatialData
315

They expressed a clear interest in the results an even
the desire to incorporate V-MANIP into some of their
platforms. Interactive tutorials for every use case al-
lowed new users to become easily acquainted with the
software.
Some of the functionalities considered and re-
ported as highlights by the validation group members
are:
• Web application approach: No need for installing
or updating software on their local machine.
• Performance of the system: Speed of data access
and data manipulation.
• Time slider: Allows easy interpretation of where
and when data is available.
• Several illustration facilities: 2D views on
map/virtual globe, 3D views both in space (x,y,z)
and space/time (x,y,t) and analytical tools to dis-
play time series at selected points.
• The visualization of temporal and spatial avail-
ability of different data sources and the possibility
to combine different data sources in one applica-
tion which is essential for data viewing and data
mining with regard to big data.
Future work topics collected from the validation
group were:
• Additional information of the visualized data,
such as recording mission or sensor type and its
processing pipeline should be displayed, as well
as what algorithms were applied or which entities
did process the data.
• Upload of local data: Provide an interface to allow
direct upload of local data (e.g. data owned by
an institution) to be integrated into the system for
visualization.
In collaboration with science communities new vi-
sualizations and algorithms can be defined extending
the functionality of the open-source platform.
ACKNOWLEDGEMENTS
The V-MANIP project was funded by the European
Space Agency in Frascati, Italy (ESA/ESRIN) under
the reference AO/1-7193/12/I-AM. We would like to
thank the project team partners EOX (project lead),
Berner & Mattner, SISTEMA and ZAMG.
REFERENCES
Andrienko, G., Andrienko, N., Bremm, S., Schreck,
T., von Landesberger, T., Bak, P., and Keim, D.
(2010). Space-in-time and Time-in-space Self-
organizing Maps for Exploring Spatiotemporal Pat-
terns. In Proceedings of the 12th Eurographics / IEEE
- VGTC Conference on Visualization, EuroVis’10,
pages 913–922, Aire-la-Ville, Switzerland, Switzer-
land. Eurographics Association.
Bostock, M. (2014). Data-Driven Documents (D3).
http://d3js.org/.
Brooks, S. and Whalley, J. L. (2008). Multilayer hybrid
visualizations to support 3D GIS. Computers, Envi-
ronment and Urban Systems, pages 278–292.
Butkiewicz, T., Dou, W., Wartell, Z., Ribarsky, W., and
Chang, R. (2008). Multi-Focused Geospatial Analy-
sis Using Probes. IEEE Transactions on Visualization
and Computer Graphics, 14(6):1165–1172.
Dykes, J., Fabrikant, S., and Wood, J. (2005). Preface. In
Kraak, J. D. M. M.-J., editor, Exploring Geovisualiza-
tion, International Cartographic Association, pages ix
– xii. Elsevier, Oxford.
GlobWeb (2014). Virtual Globe with WebGL.
https://github.com/TPZF/GlobWeb.
glTF (2014). Runtime asset format for WebGL, OpenGL
ES, and OpenGL. https://www.khronos.org/gltf.
Kapler, T. and Wright, W. (2004). GeoTime Information Vi-
sualization. In Proceedings of the IEEE Symposium on
Information Visualization, INFOVIS ’04, pages 25–
32, Washington, DC, USA. IEEE Computer Society.
National Institutes of Health (2014). Nifti - neuroimaging
informatics technology initiative.
Sazid Mahammad, S. and Ramakrishnan, R. (2014). Geo-
TIFF - A standard image file format for GIS applica-
tions. http:// www.gisdevelopment.net/ technology/ ip/
mi03117pf.htm.
Schilling, A. and Kolbe, T. H. (2010). Draft for
OpenGIS Web 3D Service Implementation Standard.
http://www.w3ds.org/doku.php.
The X Toolkit (XTK) (2014). https://github.com/xtk/X.
Tominski, C., Schulze-Wollgast, P., and Schumann, H.
(2005). 3D Information Visualization for Time De-
pendent Data on Maps. In Proceedings of the Ninth In-
ternational Conference on Information Visualisation,
IV ’05, pages 175–181, Washington, DC, USA. IEEE
Computer Society.
Web Map Service (WMS) (2014).
http://www.opengeospatial.org/standards/wms.
Web Map Tile Service (WMTS) (2014).
http://www.opengeospatial.org/standards/wmts.
Web Processing Service (WPS) (2014).
http://www.opengeospatial.org/standards/wps.
Zhang, Z., Tong, X., McDonnell, K., Zelenyuk, A., Imre,
D., and Mueller, K. (2013). An interactive visual an-
alytics framework for multi-field data in a geo-spatial
context. Tsinghua Science and Technology on Visual-
ization and Computer Graphics, 18(2):111–124.
IVAPP2015-InternationalConferenceonInformationVisualizationTheoryandApplications
316
