
Interactive Computer Simulation and Animation (CSA) to Improve
Student Learning of Projectile Motion in an Undergraduate
Engineering Dynamics Course
Yongqing Guo and Ning Fang
Department of Engineering Education, Utah State University, Logan, UT, U.S.A.
Keywords: Computer Simulation and Animation (CSA), Interactive Learning Modules, Projectile Motion, Engineering
Dynamics, Quasi-experimental Research Design.
Abstract: Computer simulation and animation (CSA) has been receiving growing attention and application in recent
years in the international engineering education community. In the present study, an innovative set of CSA
learning modules was developed to improve student learning of projectile motion in engineering dynamics,
an important yet difficult undergraduate engineering course. The new CSA learning modules integrate
visualization with mathematical modeling to help students directly connect engineering dynamics with
mathematics. Quasi-experimental research involving an intervention group and a comparison group was
performed to investigate the extent to which the new CSA learning modules improved student learning of
projectile motion. The results show that as compared to the comparison group, students in the intervention
group increased their learning gains by 30.3% to 43.6% on average, depending on the specific CSA learning
modules. The difference in learning gains between the two groups is found to be statistically significant.
From the present study, it is concluded that properly-designed computer simulation and animation not only
provides students with a visualization tool for them to better understand engineering phenomena, but can
also improve their procedural skills for finally solving problems in engineering dynamics.
1 INTRODUCTION
Engineering dynamics is a fundamental core course
in many undergraduate engineering curricula, e.g.,
mechanical, aerospace, civil, biological, and
biomedical engineering. Students in these programs
are typically required to take engineering dynamics
before they are allowed to take subsequent advanced
courses such as advanced dynamics, structural
mechanics, system dynamics and control, and
machine and structural designs (Bedford and Fowler,
2009; Hibbeler, 2012).
Nevertheless, dynamics is widely regarded as
one of the most difficult engineering courses to
succeed in (Cornwell, 2000). When asked for their
perspectives on dynamics, many students used
phrases such as “much harder than statics,”
“extremely difficult,” “very challenging,” and “I am
afraid of it.” It was reported that on the standard
Fundamentals of Engineering examination in the
U.S. in 2009, the national average score on the
dynamics portion was only 53% (Barrett et al.,
2010).
A variety of instructional strategies, such as
hands-on experimentation, multimedia games, and
computer simulations and animations (CSAs), have
been developed to improve student learning (Bates
and Poole, 2003; Bernadin et al., 2008; Budhu,
2009; Calderón and Ruiz, 2014). Among these
instructional strategies, CSA has been receiving
increasing attention and application in recent years
in the international engineering education
community (Clark and DiBiasio, 2007; Donnelly et
al., 2004; Philpot and Hall, 2006). CSA does not
require expensive hardware, so it can be readily
implemented in teaching and learning. All the
hardware needed for running a CSA software
program is a computer. Most importantly, as many
students are visual learners, CSA provides them with
a visualization tool to better understand various
engineering problems (Dunn and Griggs, 2000;
Kolmos and Holgaard, 2010).
We have performed an extensive literature
review using a variety of popular databases, such as
173
Guo Y. and Fang N..
Interactive Computer Simulation and Animation (CSA) to Improve Student Learning of Projectile Motion in an Undergraduate Engineering Dynamics
Course.
DOI: 10.5220/0005363401730180
In Proceedings of the 7th International Conference on Computer Supported Education (CSEDU-2015), pages 173-180
ISBN: 978-989-758-108-3
Copyright
c
2015 SCITEPRESS (Science and Technology Publications, Lda.)
the Education Resources Information Center,
Science Citation Index, Social Science Citation
Index, Engineering Citation Index, Academic Search
Premier, and the American Society of Engineering
Education (ASEE) annual conference proceedings
(1995-2014). The recent Proceedings of the
International Conference on Computer Supported
Education were also examined.
The results of our extensive literature review
show that the vast majority of existing CSA software
programs developed for engineering dynamics (e.g.,
Flori et al., 1996; Gu and Tan; 2009; Kumar and
Plummer, 1997; Manjit and Selvanathan, 2005;
Stanley, 2009; Stanley, 2008) use graphs, charts, and
curves to show what happens in science or
engineering phenomena, but fail to show or explain
the mathematical equations used to generate those
graphs, charts, and curves. Students clearly see
“what” happens but may not understand or be able to
explain “why” or “how” it happens. For example,
Stanley (2008, 2009) developed a CSA program to
help student learn projectile motion. The CSA
program used graphs and charts to show the
variation of velocity while a particle undergoes
projectile motion. However, no mathematical
equations were provided to illustrate why velocity
changes. The assessment of student learning
outcomes relied heavily on questionnaire surveys.
The present study makes two contributions. First,
an innovative set of interactive CSA learning
modules was developed for engineering dynamics,
focusing on projectile motion, an essential learning
topic in engineering dynamics. In our CSA learning
modules, mathematical modeling was incorporated
into CSA to help students not only see “what”
happens but also understand “why” and “how;” or in
other words, to help students connect dynamics
phenomena with the mathematics behind them.
Second, a quantitative, quasi-experimental
research study involving an intervention group and a
comparison group was performed to investigate the
extent to which our CSA learning modules improved
student learning of projectile motion. The existing
relevant research (Flori et al., 1996; Gu and Tan;
2009; Kumar and Plummer, 1997; Manjit and
Selvanathan, 2005; Stanley, 2009; Stanley, 2008)
heavily depends on student surveys and interviews
to assess student learning outcomes associated with
CSA. Compared to the quantitative, quasi-
experimental study performed in the present study,
student surveys and interviews are subjective and
may not provide an objective assessment.
In the remaining sections of the paper, we first
describe how our CSA learning modules were
developed, focusing on a description of their unique
features. Then, the research question and the
research method are presented, followed by a
detailed description of the results and analysis. Some
discussions about the research findings are provided.
Conclusions are made at the end of this paper.
2 DEVELOPMENT OF
INTERACTIVE COMPUTER
SIMULATION AND
ANIMATION (CSA) LEANRING
MODULES
2.1 Design of Real-World Technical
Problems
In the present study, three real-world technical
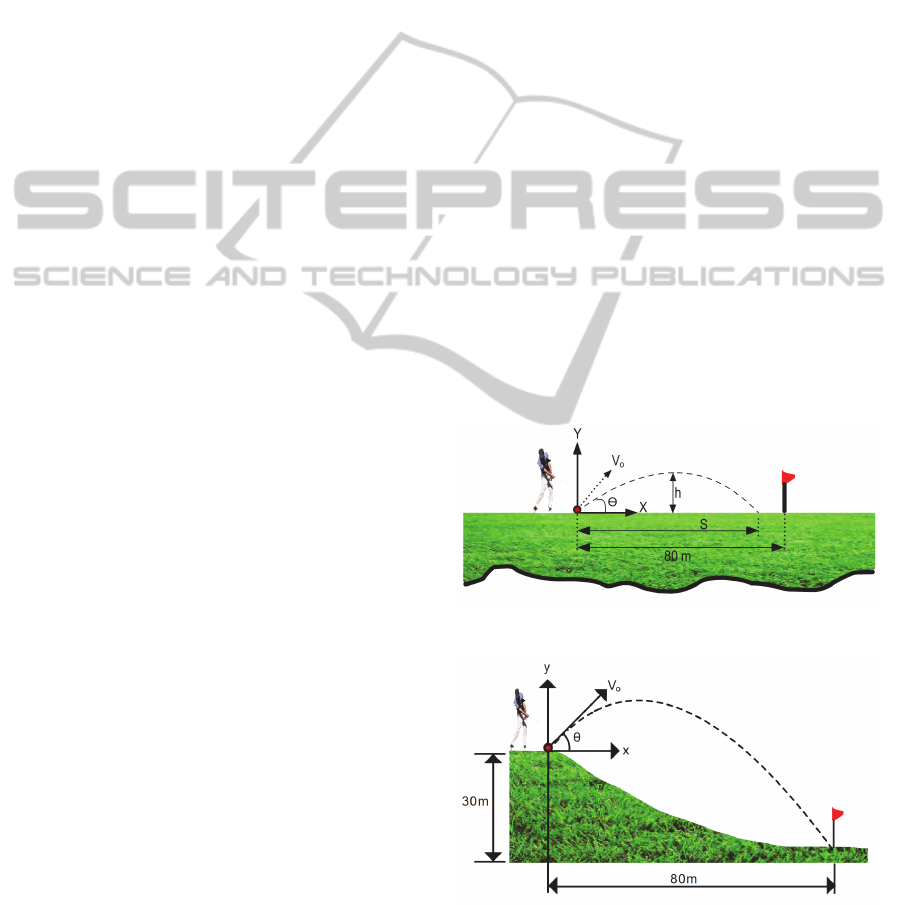
problems were designed, as shown in Figures 1-3.
These three problems all involve hitting a golf ball
to a target. In the first problem, the ball is initially on
the ground and finally lands at another position on
the ground. In the second problem, the ball is
initially on a hill and finally lands on the ground. In
the third problem, the ball is initially on the ground
and finally lands on a hill.
Figure 1: Technical Problem 1.
Figure 2: Technical Problem 2.
Each of the above three problems requires a
different mathematical treatment involving proper
CSEDU2015-7thInternationalConferenceonComputerSupportedEducation
174
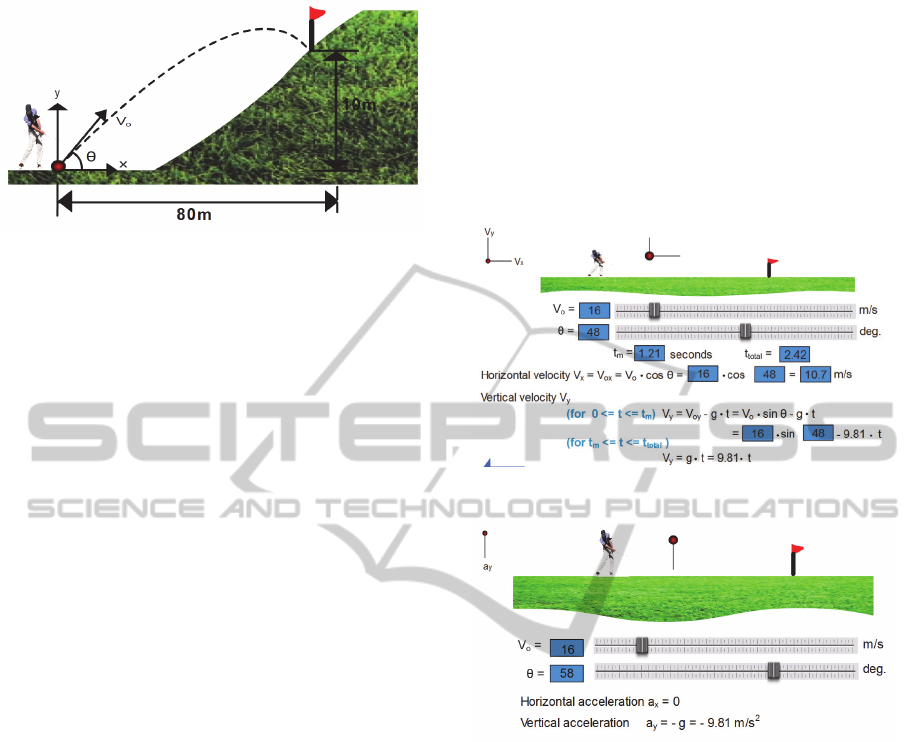
Figure 3: Technical Problem 3.
selection of the origin and the coordinate system
based on which the position of the ball can be
determined.
2.2 Development of Interactive CSA
Learning Modules and Their
Unique Features
From a variety of computer programming tools such
as ADAMS, Maple, Matlab, Working Model 2D,
and Adobe Flash, we chose Adobe Flash to develop
our CSA learning modules because once these
modules are developed, they can be directly
uploaded to the Internet for students to run. If a
software program is developed using ADAMS,
Maple, Matlab, or Working Model 2D, students
must use these particular programming tools, which
typically require payment of license fees to run the
software program.
Our CSA learning modules share the following
two learning objectives: a) apply kinematical
equations to determine displacement and velocity in
a projectile motion; and b) learn how velocity and
acceleration vary in a projectile motion. They have
the following primary features, among others:
1) Each CSA learning module integrates
visualization with the mathematical modeling of
projectile motion to help students directly connect
engineering dynamics with mathematics.
2) Each CSA learning module has an interactive
computer graphical user interface that allows
students to vary inputs and see how the numbers in
mathematical equations change, simultaneously and
dynamically, as the golf ball moves in a space.
3) Each CSA learning module is a web-based
and stand-alone computer software program, so
anyone who has access to the Internet can use it
anytime, anywhere, and at his or her own pace.
Figures 4 and 5 are two representative examples
showing the computer graphical user interfaces of
the first CSA module. Students learn how to perform
vector analyses of velocity (Figure 4) and
acceleration (Figure 5). Students can change the
initial velocity V
o
and the initial angle , and then
run computer animation to study how the horizontal
and vertical components of velocity (Figure 4) and
acceleration (Figure 5) vary both graphically (via the
varying length of a line) and numerically (via the
varying values of outputs of relevant mathematical
equations).
Figure 4: Example 1: velocity analysis.
Figure 5: Example 2: acceleration analysis.
For example, in Figure 4, as the ball moves, students
can see that the horizontal component (V
x
) of the
velocity keeps constant; whilst the vertical
component (V
y
) of the velocity gradually decreases
before the ball reaches the highest point, and then
gradually increases after the ball reaches the highest
point. In Figure 5, as the ball moves, students can
see that the horizontal component (a
x
) of
acceleration is always zero; whilst the vertical
component (a
y
) of acceleration keeps a constant
value of 9.81 m/s
2
.
3 RESEARCH QUESTION AND
RESEARCH METHOD
3.1 Research Question
The research question of this study is: To what
InteractiveComputerSimulationandAnimation(CSA)toImproveStudentLearningofProjectileMotioninan
UndergraduateEngineeringDynamicsCourse
175

extent did the CSA learning modules developed in
the present study improve student learning of
projectile motion in engineering dynamics?
3.2 Research Method
3.2.1 Quasi-experimental Research Design
A quantitative, quasi-experimental research design,
as shown in Table 1, was employed to answer the
research question above. The undergraduate students
who took an engineering dynamics course in either
of two recent semesters participated in the present
study. Students in Semester A were employed as a
comparison group, and they received classroom
lectures only but no CSA learning modules. Students
in Semester B were employed as an intervention
group, and they received classroom lectures as well
as the CSA learning modules. The same instructor
taught in both semesters. Pretests and posttests were
administrated in both groups to compare student
learning gains.
Table 1: Quasi-experimental research design.
Group Pretest Intervention Posttest
Comparison O O
Intervention O
×
O
3.2.2 Student Participants
Prior to the present study, all student participants in
the comparison and intervention groups signed a
Letter of Informed Consent approved by an
Institutional Review Board. Table 2 shows the
number of students who participated in pretests and
posttests that were built upon each of the three
technical problems described in Section 2.1. Note
that not every student participated in each pretest or
each posttest. Therefore, the number of students
varied slightly for different pretests and posttests.
Five assessment questions were built upon
Table 2: Number of student participants.
Group Number of student participants who
participated in pretests and posttests
that were built upon
Technical
Problem 1
Technical
Problem 2
Technical
Problem 3
Comparison
(not using
CSA
modules)
59
60
63
Intervention
(using CSA
modules)
83
84
85
Technical Problem 1. Another five assessment
questions were built upon Technical Problem 2.
Four assessment questions were built upon
Technical Problem 3. Students in both comparison
and intervention groups were asked to answer these
assessment questions. All assessment questions are
quantitative, multiple-choice questions.
Student participants included approximately 90%
males and 10% females. The small percentage of
female students is very common in engineering
schools in the United States. Student participants
were primarily from three departments: mechanical
and aerospace engineering, civil and environmental
engineering, and biological engineering. The
majority of student participants were from either the
mechanical and aerospace department or the civil
and environmental engineering department.
3.2.3 Calculation of Normalized Learning
Gains
The normalized learning gain was calculated for
each student and each assessment question using the
following equation proposed by Hake (1998):
Normalized learning gain =
Posttest score in % - pretest score in %
100 % - pretest score in %
(1)
Statistical analysis was conducted to compare
learning gains between the two groups.
4 RESULTS AND ANALYSIS
In this section, the effects of the three CSA learning
modules 1, 2, and 3, which correspond to the three
technical problems described in Section 2.1, are
described and analyzed.
4.1 Effect of CSA Learning Module 1
Figures 6 and 7 show the percentages of students
who chose correct answers for assessment questions
that were built upon Technical Problem 1 in the
comparison group and in the intervention group,
respectively.
From Figures 6 and 7, the percentages of
students who chose correct answers in pretests are
close between the two groups. However, the
percentage of students who chose correct answers in
posttests is significantly higher in the intervention
group than in the comparison group.
Figure 8 shows a comparison of normalized,
CSEDU2015-7thInternationalConferenceonComputerSupportedEducation
176
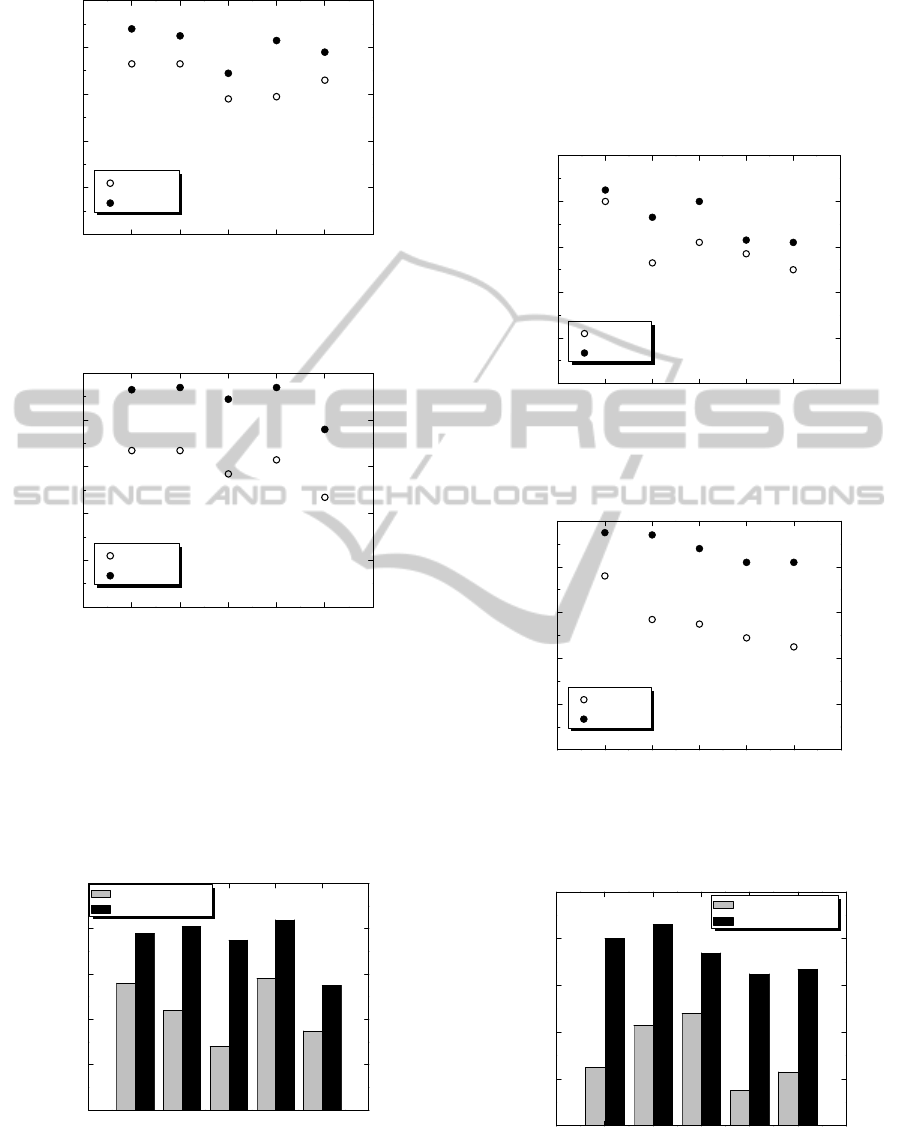
0123456
0
20
40
60
80
100
Pretests
Posttest
Percentage of students
who chose correct answers
Assessment question number
Figure 6: Comparison of pretests and posttests for
Technical Problem 1 for the comparison group.
0123456
0
20
40
60
80
100
Pretests
Posttest
Percentage of students
who chose correct answers
Assessment question number
Figure 7: Comparison of pretests and posttests for
Technical Problem 1 for the intervention group.
class-average learning gains between the two groups
for Technical Problem 1. As seen from Figure 8, the
intervention group has higher, or significantly higher
in some cases, learning gains for each assessment
question than does the comparison group.
0123456
0
20
40
60
80
100
Normalized, class-average
learning gain (%)
Assessment question number
Comparison group
Intervention group
Figure 8: Comparison of normalized, class-average
learning gains for Technical Problem 1 between
comparison and intervention groups.
4.2 Effect of CSA Learning Module 2
Figures 9 and 10 show the percentages of students
who chose correct answers for assessment questions
built upon Technical Problem 2 in the comparison
group and in the intervention group, respectively. A
0123456
0
20
40
60
80
100
Pretests
Posttest
Percentage of students
who chose correct answers
Assessment question number
Figure 9: Comparison of pretests and posttests for
Technical Problem 2 for the comparison group.
0123456
0
20
40
60
80
100
Pretests
Posttest
Percentage of students
who chose correct answers
Assessment question number
Figure 10: Comparison of pretests and posttests for
Technical Problem 2 for the intervention group.
0123456
0
20
40
60
80
100
Normalized, class-average
learning gain (%)
Assessment question number
Comparison group
Intervention group
Figure 11: Comparison of normalized, class-average
learning gains for Technical Problem 2 between
comparison and intervention groups.
InteractiveComputerSimulationandAnimation(CSA)toImproveStudentLearningofProjectileMotioninan
UndergraduateEngineeringDynamicsCourse
177
comparison of normalized, class-average learning
gains between the two groups is shown in Figure 11.
Observations similar to those described in
Section 4.1 can be made for Figures 8-11. The
intervention group has higher, or significantly higher
in some cases, learning gains for each assessment
question than does the comparison group.
4.3 Effect of CSA Learning Module 3
Figures 12 and 13 show the percentages of students
who chose correct answers for assessment questions
that were built upon Technical Problem 3 in the
comparison group and in the intervention group,
respectively. A comparison of normalized, class-
average learning gains between the two groups is
shown in Figure 14.
012345
0
20
40
60
80
100
Pretests
Posttest
Percentage of students
who chose correct answers
Assessment question number
Figure 12: Comparison of pretests and posttests for the
comparison group for Technical Problem 3.
The results in Figures 12-14 illustrate that the
intervention group also has higher, or significantly
higher in some cases, learning gains for each
assessment question than the comparison group.
012345
0
20
40
60
80
100
Pretests
Posttest
Percentage of students
who chose correct answers
Assessment question number
Figure 13: Comparison of pretests and posttests for
Technical Problem 3 for the intervention group.
012345
0
20
40
60
80
100
Normalized, class-average
learning gain (%)
Assessment question number
Comparison group
Intervention group
Figure 14: Comparison of normalized, class-average
learning gains for Technical Problem 3 between
comparison and intervention groups.
4.4 Overall Class-average Learning
Gains
Table 3 summarizes the overall class-average
learning gains for all three CSA modules. The
overall class-average learning gain for a particular
CSA learning module was calculated by taking the
average of normalized, class-average learning gains
for each assessment question associated with that
particular CSA module. The data shown in Figures
8, 11, and 14 were employed. For example, in Figure
8, which corresponds to CSA learning module 1, the
normalized, class-average learning gains for the
intervention group are 78%, 81%, 75%, 84%, and
55% for five assessment questions, respectively. The
overall class-average learning gain for CSA learning
module 1 for the intervention group is (78% + 81%
+ 75% + 84% + 55%)/5 = 74.5%.
Table 3: Overall class-average learning gains.
Group Overall class-average learning gains
measured through pretests and
posttests that were built upon
Technical
Problem 1
Technical
Problem 2
Technical
Problem 3
Comparison
(not using
CSA
modules)
44.3%
30.9%
31.2%
Intervention
(using CSA
modules)
74.5%
74.5%
70.7%
Based on Table 3, as compared to the comparison
group, students in the intervention group increased
their learning gains by 30.3%, 43.6%, and 39.5% on
average for CSA learning module 1, 2, and 3,
respectively.
CSEDU2015-7thInternationalConferenceonComputerSupportedEducation
178

To further study whether there exists a
statistically significant difference in the overall
class-average learning gains between the two
groups, non-parametric statistical Mann-Whitney U
tests were conducted, and the results are shown in
Table 4. The reason we chose non-parametric
statistical tests (rather than t-tests) in the present
study is that the distribution of raw datasets
collected (i.e., pretest and posttest scores) was found
to be not perfectly normal. Based on the values of
asymptotic significance shown in Table 4, the
difference in the overall class-average learning gains
between the two groups is statistically significant.
Table 4: Results of statistical Mann-Whitney U tests.
CSA
module 1
CSA
module 2
CSA
module 3
Z value
-2.481 -4.080 -3.422
Asymptotic
significance
(2-tailed)
0.013
0.000
0.001
5 DISCUSSIONS
Much existing literature asserts that computer
simulation and animation has a major limitation: It
can improve students’ conceptual understanding
only because CSA is primarily a visualization tool;
and CSA cannot improve students’ procedural skills.
Procedural skills are generally defined as skills to
get a numerical solution to, other than a qualitative
understanding of, a technical problem (Case and
Marshall, 2004; Hiebert and Lefevre, 1986; Rittle-
Johnson and Star, 2007; Taraban et al., 2007).
However, the research findings from the present
study reveal that if properly designed, CSA can also
simultaneously improve students’ procedural skills
to finally solve problems in engineering dynamics.
Our assertion is well supported by quantitative
evidence summarized in Table 3. The key is to
incorporate mathematical equations and procedures
into the design of CSA. Therefore, when students
run a CSA software program, they not only see
“what” happens via computer animation, but also
understand “why” and “how” via mathematical
equations and procedures. Interactive computer
graphical user interfaces are also important to
actively engage students in the learning process. So
students can learn by active doing, rather than by
passive watching.
6 CONCLUSIONS
With the advancement of modern computer
technology, computer simulation and animation has
been receiving growing attention and applications in
the international engineering education community.
In this paper, we have described the development
and assessment of an innovative set of CSA learning
modules to improve student learning of projectile
motion in engineering dynamics, a fundamental
undergraduate engineering course. We have
employed a quasi-experimental approach to
quantitatively measure student learning gains.
Students’ attitude towards and experiences with our
CSA learning modules, via student surveys and
interviews, will be reported in a separate paper as
they address a different research question, “What
were students’ attitudes toward and experiences with
the developed CSA learning modules?”
The present study makes two primary scientific
contributions. First, our new CSA learning modules
integrate visualization with mathematical modeling,
which greatly improves students’ procedural skills
for finally solving engineering dynamics problems.
Second, based on the results of quasi-experimental
research, it is found that as compared to the
comparison group, students in the intervention group
increased their learning gains by 30.3% to 43.6% on
average. The difference in learning gains between
the two groups is found to be statistically significant.
Finally, we suggest that mathematical equations and
procedures be incorporated into the design of
computer simulation and animation.
ACKNOWLEDGEMENTS
This material is based upon work supported by the
U.S. National Science Foundation under Grant No.
1122654. A computer science graduate student Mr.
Nawaf is acknowledged for helping to write the
initial computer codes to convert the designed CSA
learning modules into computer software programs.
REFERENCES
Barrett, S. F., LeFevre, E. W., Steadman, J. W., Tietjen, J.
S., White, K. R., and Whitman, D. L., 2010. Using the
Fundamentals of Engineering (FE) examination as an
outcomes assessment tool. National Council of
Examiners for Engineering and Surveying, Seneca,
SC.
Bates, A. W., Poole, G., 2003. Effective teaching with
InteractiveComputerSimulationandAnimation(CSA)toImproveStudentLearningofProjectileMotioninan
UndergraduateEngineeringDynamicsCourse
179

technology in higher education: foundations for
success, Jossey-Bass. San Francisco, CA.
Bedford, A., Fowler, W., 2009. Engineering mechanics
dynamics, Prentice Hall. Upper Saddle River, NJ, 5th
edition.
Bernadin, S., Kalaani, Y. A., and Goforth, F., 2008.
Bridging the gap between lab and lecture using
computer simulation. In Proceedings of the 2008
ASEE Annual Conference & Exposition, Pittsburgh,
PA.
Budhu, M., 2009. Enhancing instructions using interactive
multimedia simulations. Simulation, 76(4), 222-231.
Calderón, A., Ruiz, M., 2014. Bringing real-life practice in
software project management training through a
simulation-based serious game. In Proceedings of the
6th International Conference on Computer Supported
Education, Barcelona, Spain.
Case, J., Marshall, D., 2004. Between deep and surface:
procedural approaches to learning in engineering
education contexts. Studies in Higher Education,
29(5), 605-615.
Clark, W., DiBiasio, D., 2007. Computer simulation of
laboratory experiments for enhanced learning. In
Proceedings of the 2007 ASEE Annual Conference &
Exposition, Honolulu, Hawaii.
Cornwell, P. J., 2000. Dynamics evolution – change or
design. In Proceedings of the 2000 ASEE Annual
Conference & Exposition, St. Louis, MO.
Donnelly, A., Wu, C. Y., and Hodge, E., 2004. A model
for teaching materials evaluation: development and
testing of interactive computer simulations modules
for undergraduate education. In Proceedings of the
2004 ASEE Annual Conference & Exposition, Salt
Lake City, Utah.
Dunn, R., Griggs, S. H., (Eds.) 2000. Practical
approaches to using leaning styles in higher
education, Bergin & Garvey. Westport, CT.
Flori, R. E., Koen, M. A., and Oglesby, D. B., 1996.
Basic engineering software for teaching (BEST)
dynamics. Journal of Engineering Education, 85, 61-
67.
Gu, Y. T., Tan, A., 2009. Using visualization tool to help
engineering students learning dynamics. In
Proceedings of 20th Annual Conference for the
Australasian Association for Engineering Education,
Adelaide, Australia.
Hake, R. R., 1998. Interactive-engagement vs. traditional
methods: a six-thousand-student survey of mechanics
test data for introductory physics courses. American
Journal of Physics, 66(1), 64-74.
Hibbeler, R. C., 2012. Engineering mechanics dynamics,
Pearson Prentice Hall. Upper Saddle River, NJ, 13th
edition.
Hiebert, J., Lefevre, P., 1986. Conceptual and procedural
knowledge in mathematics: An introductory analysis.
In Hiebert, J., (Ed.), Conceptual and procedural
knowledge: The case of mathematics, Lawrence
Erlbaum. Hillsdale, NJ.
Kolmos, A., and Holgaard, J. E., 2010. Learning styles of
science and engineering students in problem and
project based education. International Journal of
Learning Technology, 5(3), 211-242.
Kumar, R., Plummer, M., 1997. Using contemporary tools
to teach dynamics in engineering technology.
International Journal of Engineering Education, 13,
407-411.
Manjit, S., Selvanathan, N., 2005. A TAPS interactive
multimedia package to solve engineering dynamics
problems. Campus-Wide Information Systems, 22,
275-289.
Philpot, T. A., Hall, R. H., 2006. Animated instructional
software for mechanics of materials: implementation
and assessment. Computer Applications in
Engineering Education, 14(1), 31-43.
Rittle-Johnson, B., Star, J., 2007. Does comparing solution
methods facilitate conceptual and procedural
knowledge? An experimental study on learning to
solve equations. Journal of Educational Psychology,
99(3), 561-574.
Stanley, R., 2008. An efficient way to increase the
engineering student’s fundamental understanding of
particle kinematics and kinetics by using interactive
web based animation software. Computers in
Education, 18, 23-41.
Stanley, R., 2009. A way to increase the engineering
student’s qualitative understanding of particle
kinematics and kinetics by using interactive web based
animation software. In Proceedings of the 2009 ASEE
Annual Conference & Exposition, Austin, TX.
Taraban, R., Definis, A., Brown, A. G., Anderson, E. E.,
and Sharma, M. P., 2007. A paradigm for assessing
conceptual and procedural knowledge in engineering
students. Journal of Engineering Education, 96(4),
335-345.
CSEDU2015-7thInternationalConferenceonComputerSupportedEducation
180
