Genetic Mapping of Diseases through Big Data Techniques
Julio C. S. dos Anjos
1
, Bruno Reckziegel Filho
1
, Junior F. Barros
1
Raffael B. Schemmer
1
, Claudio F. R. Geyer
1
and Ursula Matte
2
1
Universidade Federal do Rio Grande do Sul, GPPD, Institute of Informatics,
Caixa Postal 15.064, 91.501-970, Porto Alegre, RS, Brazil
2
Laboratory of Gene Therapy Hospital de Cl´ınicas de Porto Alegre,
Rua Ramiro Barcelos, 2350, 90035-903, Porto Alegre, RS, Brazil
Keywords:
Data Intensive Computing, MapReduce, Parallel Distributed Processing, Genome Annotation.
Abstract:
The development of sophisticated sequencing machines and DNA techniques has enabled advances to be made
in the medical field of genetics research. However, due to the large amount of data that sequencers produce,
new methods and programs are required to allow an efficient and rapid analysis of the data. MapReduce is a
data-intensive computing model that handles large volumes that are easy to program by means of two basic
functions (Map and Reduce). This work introduces GMS, a genetic mapping system that can assist doctors in
the clinical diagnosis of patients by conducting an analysis of the genetic mutations contained in their DNA.
As a result, the model can offer a good method for analyzing the data generated by sequencers, by providing a
scalable system that can handle a large amount of data. The use of several medical databases at the same time
makes it possible to determine susceptibilities to diseases through big data analysis mechanisms. The results
show scalability and offer a possible diagnosis that can improve the genetic diagnosis with a powerful tool for
health professionals.
1 INTRODUCTION
The information provided by DNA sequencing is
crucial to ensure the success of biological research.
Biotechnology is one of the fields that has benefited
the most from this kind of information, especially for
the development of new pharmaceutical substances,
foodstuffs, pesticides and agricultural products, and
when conducting a clinical diagnosis (William J and
Palladino, 2012).
DNA sequencing was once a very expensive pro-
cess, but currently there are techniques and machines
that are considerably more cost-effective. The Na-
tional Human Genome Research Institute (NHGRI)
has shown that prices fell between the years 2007 and
2008, when the sequencing methodology migrated
from Sanger to what was then called Next Genera-
tion Sequencing (NGS). The time taken for sequenc-
ing has also increased. As shown in Table 1, a few
NGS machines (particularly those that use ion semi-
conductors such as Ion Proton
TM
(Scientific, 2014) are
able to sequence millions of base pairs in a few hours,
and hence can produce large amounts of data very
quickly. However, at present there is a limited num-
ber of tools that can analyze the produced data in an
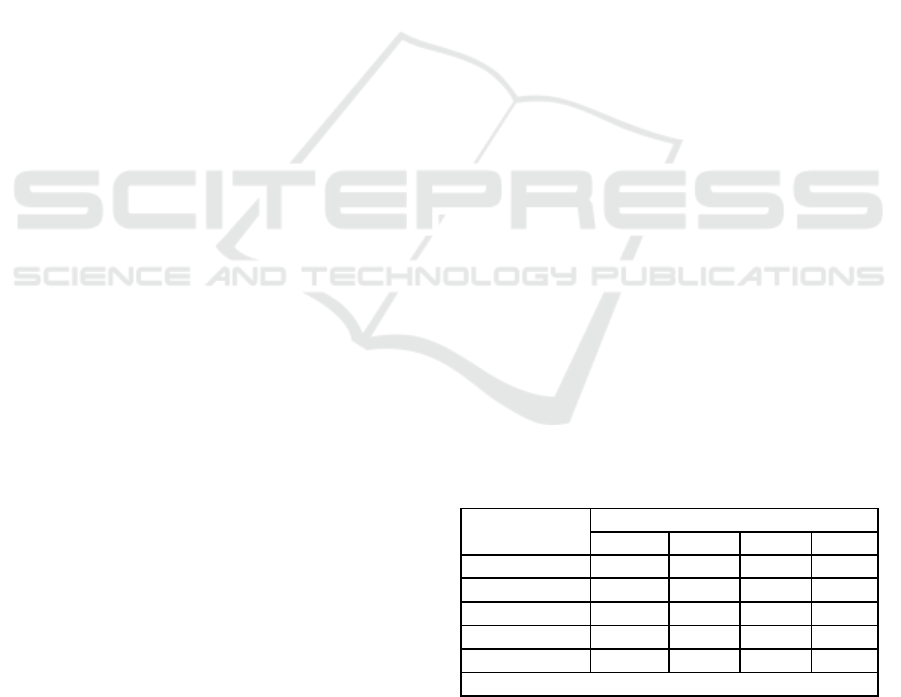
Table 1: Technical specifications of Ion Torrent sequencing
machines.
Machine Models
Characteristics PGM318 PI PII PIII
Sensor Number ∼11 M ∼165 M ∼660 M ∼1.2 B
Input Size ∼2 GB ∼10 GB ∼32 GB ∼64 GB
Execution Time 4∼7 hrs 2∼4 hrs 2∼4 hrs 2∼4 hrs
Average Read 400 BP 200 BP 100 BP 100 BP
Number of Reads ∼5.5 M ∼82 M ∼330 M ∼660 M
Key: M = Million B = Billion BP = Base Pairs GB = GigaBytes
automated and rapid fashion.
In this context, MapReduce computing is an at-
tractive solution as it implicitly offers a parallel dis-
tributed solution for processing large amounts of data,
such as those produced by sequencers. The MapRe-
duce framework is easier to program and has a dis-
tributed file system that other parallel systems do
not have, e.g. MPI. MapReduce improves accuracy
and reduces the complexity of biological applications,
such as, multiple sequence alignment algorithm (Zou
et al., 2014). This means that MapReduce is a frame-
work model that is suitable for this study. In addition,
the existing MapReduce implementations, such as
Hadoop (an open-source implementation maintained
279
Santos dos Anjos J., Reckziegel Filho B., F. Barros J., B. Schemmer R., Geyer C. and Matte U..
Genetic Mapping of Diseases through Big Data Techniques.
DOI: 10.5220/0005365402790286
In Proceedings of the 17th International Conference on Enterprise Information Systems (ICEIS-2015), pages 279-286
ISBN: 978-989-758-096-3
Copyright
c
2015 SCITEPRESS (Science and Technology Publications, Lda.)
by Apache Software Foundation) handles as fault-
tolerance and performance mechanisms such as load-
balancing, automatically.
There is an huge variation in human genomes that
can be determined by massive parallel sequencing.
However, many of these variations are not clinically
relevant. Thus, there is a great need for methods
that can discriminate between disease-causing muta-
tions and normal genetic variability in a short run-
time (Frebourg, 2014).
The purpose of this work is to develop a genetic
mapping system that can assist doctors in the clin-
ical diagnosis of patients by conducting an analy-
sis of the genetic mutations contained in their DNA.
The scientific goal is to provide an efficient method-
ology for the genetic mapping of diseases with big
data systems. The execution time of this GMS
must be scalable with regard to the amount of pro-
cessed data. The data is produced by sequencers
that employ the ion semiconductor technology. We
used the Hadoop MapReduce system and databases
from the Gene Report (NCBI, 2014) and Ensembl
(Kinsella et al., 2011). This work is available in
<https://github.com/GeneticMapping/GSM.git>.
The remainder of this work is structured as fol-
lows. Section 2 outlines the background that is re-
quired for the definition of the problem, the effects
of mutations on gene sequences and data required for
genetic diagnosis; it also, provides an overview of
the MapReduce programming model and the Hadoop
platform. Section 3 examines the related work in the
literature. Section 4 givesa detailed description of our
proposed solution. In Section 5 there is an account of
the methodology employed together with an analysis
of the obtained results. Section 6 summarizes the con-
clusions and make recommendations for future work
in the field.
2 BACKGROUND
This section provides background information on
genetics and sequencing and their application in
medicine. It also examines the technologies used in
these areas and the problems currently faced in find-
ing a suitable means of analyzing the impact of muta-
tions on the genome sequencing of patients.
2.1 Nucleotides, DNA, RNA and
Genome
Nucleotides are biological molecules that compose
the structure of nucleic acids (Alberts et al., 2014).
They are formed from a purine base (adenine or
guanine) or a pyrimidine base (thymine, cytosine or
uracil). Nucleotides are the basis for forming nucleic
acids that are large biological molecules, and essential
to all known forms of life. Deoxyribonucleic Acid
(DNA) contains the genetic code of a living being,
which comprises long sequences of nucleotides that
form a double helix structure. The Ribonucleic Acid
(RNA), which is often formed by a simple chain, syn-
thesizes the proteins from a cell on the basis of ge-
netic information contained in the DNA and conveyed
in the Messenger RNA (mRNA). The basic differ-
ences between the DNA and RNA structures lies in
the number of helices each has (the former has two
whereas the latter has only one), and in the change
of a base from thymine to uracil (William J and Pal-
ladino, 2012).
The DNA physical structure has a three dimen-
sional shape, which is the result of the forces exerted
by the electrons that compose the bases. Hence, any
change in one of the bases, alters the position of the
helix and its shape, and turns its function into a bi-
ological system. The change in molecular structure
can lead to a genetic mutation that may, or may not,
be associated with the propensity an individual has to
contract a certain disease (Sawyer et al., 2007).
By complying with the rules laid down by the ge-
netic code, the genetic information provided by the
DNA sequences via mRNA is translated into an amino
acid sequence, thus generating a protein (William J
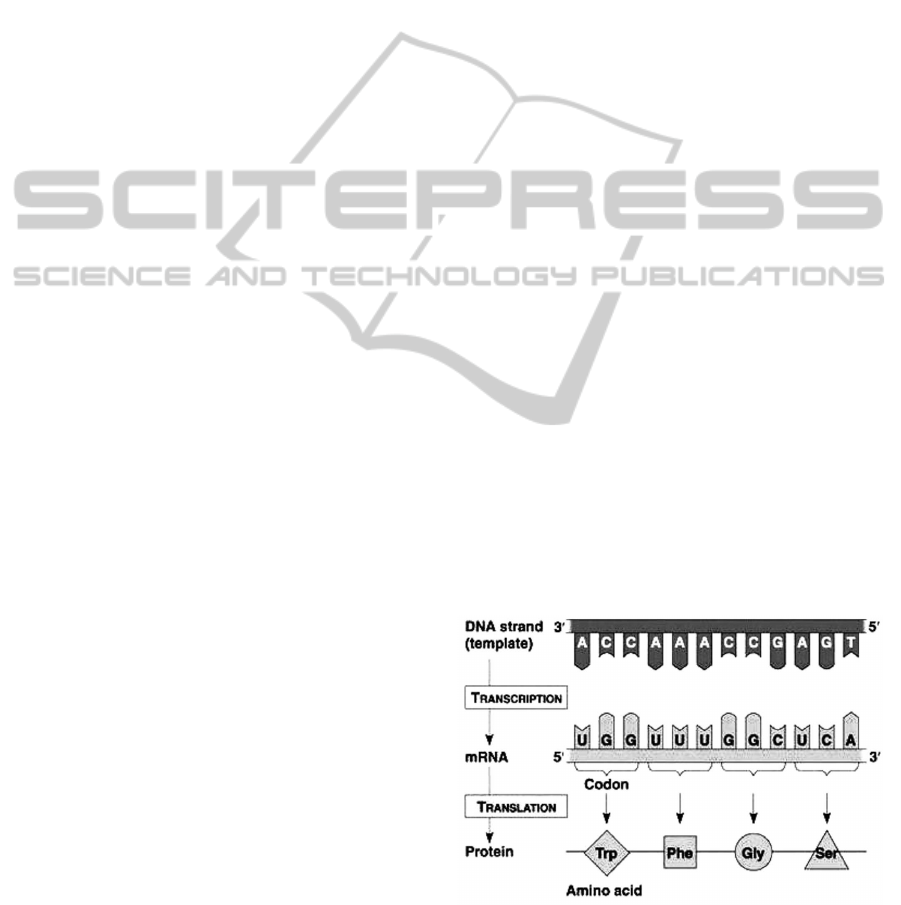
and Palladino, 2012). In this process, as shown in
Figure 1 which is adapted from (William J and Pal-
ladino, 2012), each triplet of nucleotides is called a
codon, and each codon represents an amino acid, that
synthesizes a protein. However, only the genomic re-
gions defined as coding regions are considered in the
process of protein translation.
Figure 1: Central dogma of molecular biology.
The genome represents all the genetic information
inherited by an organism. The human genome con-
sists of a large amount of DNA divided into organized
ICEIS2015-17thInternationalConferenceonEnterpriseInformationSystems
280
structures called chromosomes. The human genome
contains 23 chromosome pairs and an estimated num-
ber of 32,000 genes. The total number of DNA bases
is around 3.6 billion.
2.2 Mutations, Polymorphism and
Clinical Genetics
A mutation is defined as a change in the nucleotide
sequence of an organism. Mutations can be caused by
the irreparable damage suffered by the genome, errors
in the replication process or the insertion/deletion of
DNA fragments by mobile genetic elements. Several
studies, such as those carried out by (Johnsen et al.,
2013), suggest that, if a mutation changes the pro-
tein that a gene produces, the end result will likely
be harmful to the organism. The coding region of a
genetic code begins with a start codon and ends with
a stop codon; this region is the focus of our analysis.
However, it should also be noted that, some mutations
do not modify the amino acid generated (i.e., even if
a mutation takes place, the generated protein remains
the same).
Polymorphism is a kind of mutation that takes
place with a frequency greater than 1% in a popu-
lation, and can be divided into distinct, well-defined
classes. An example is the groups of the ABO blood
group system (classes A, B, AB and O). According to
(Nussbaum et al., 2013), there are three classes of mu-
tations, namely those that affect the number of chro-
mosomes in a cell (also called genomic mutations),
those that alter the structure of specific chromosomes
(chromosomal mutations), and mutations that change
individual genes (gene mutation). This work focuses
on conducting an analysis of gene mutation; however,
the impact of other mutations on the health of patients
will be addressed in future work.
2.3 MapReduce
MapReduce is a programming framework that ab-
stracts the complexity of parallel applications by par-
titioning and scattering data sets across hundreds or
thousands of machines, and by bringing computation
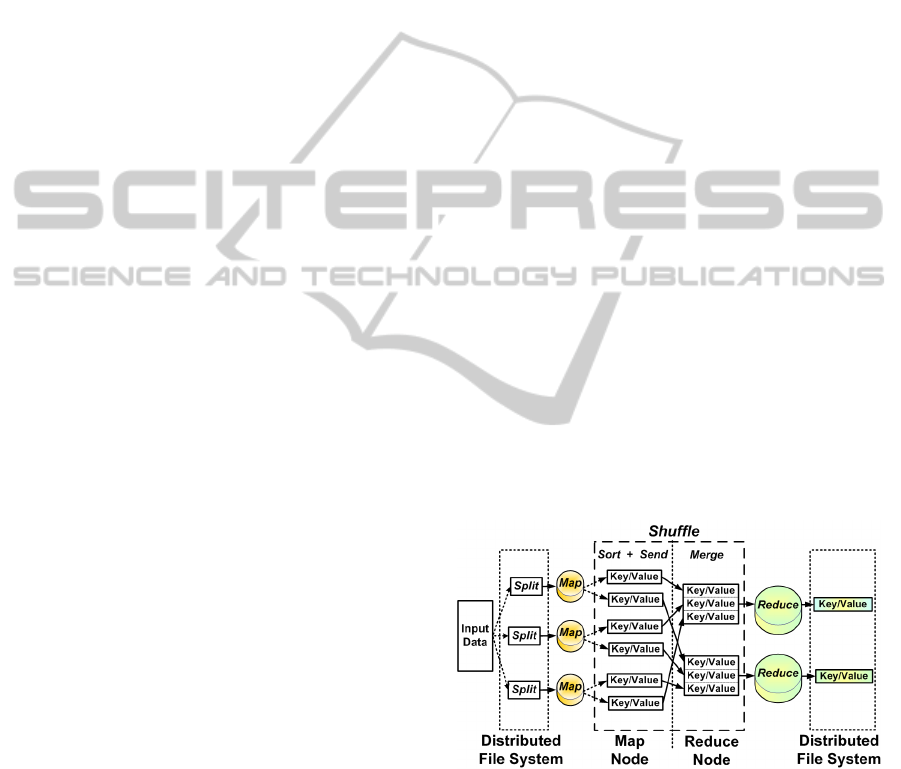
and data closer (Dean and Ghemawat, 2010). The
Figure 2, adapted from (White, 2012), shows the MR
data flow. The Map and Reduce phases are handled by
the programmer, whereas the Shuffle phase is created
while the job is being carried out. The input data is
split into smaller pieces called chunks, that normally
have a size of 64 MB. The data is serialized and dis-
tributed across machines that compose the Distributed
File System (DFS).
When running an application, the job is split by
the master into several Map and Reduce tasks; fol-
lowing this, it assigns tasks to workers that then
run each processing stage. The machine that is
given a Map task, handles a Map function and emits
key/value pairs as intermediate results that are tem-
porarily stored in the worker disks. The execution
model creates a computational barrier, which allows
tasks to be synchronized between the Map and Re-
duce. A Reduce task does not start its processing until
all the Map tasks have been completed.
A hash function is applied to the intermediate data
produced during the Map phase to determine which
keys will compose a Reduce task. All the pairs com-
bined with these keys are transferred to one machine,
during the Shuffle, so that they can be processed by
a Reduce task. After a reduction function has been
applied to this data, a new key/value pair is issued.
The result is then stored in the distributed file sys-
tem and thus can be made available to the client who
submitted the job. The Shuffle phase consists of two
stages: one performed on the machine that processes
the Map task, which sorts the keys and serializes the
data. The other is performed after the intermediate
data has been sent to the reducer machine, which ar-
ranges the received data to allow the keys to be prop-
erly grouped and then runs the Reduce task. The
Hadoop implements the Combiner function to save
bandwidth. The Combiner is a preprocessing of inter-
mediate keys into memory of workers during the map
phase to form the output for input data in the Reduce
phase. (White, 2012).
Figure 2: MapReduce data flowchart.
The management mechanisms, data replication
and execution control were added to the framework
during Hadoop implementation. The management ar-
chitecture is based on the master/worker model, while
a slave-to-slave data exchange requires a P2P model
(White, 2012). Hadoop MapReduce is a implemen-
tation for a wide range of Big Data applications used
by large companies like Facebook, Amazon, Cloud-
era and IBM. Most works, (including this system) are
GeneticMappingofDiseasesthroughBigDataTechniques
281

based on a Hadoop implementation which is regarded
as the most advanced open-source implementation of
MapReduce (Dean and Ghemawat, 2010).
3 RELATED WORKS
The advanced technique provides a collective solu-
tion for the problems currently facing mankind and
the NGS genome. It is a challenge to data process-
ing, in terms of computational resources (O’Driscoll
et al., 2014). When dealing with big data, it is nec-
essary to build new models or adjust existing ones by
taking account of the data dispersion and processing
capability. In establishing the relationship between
MapReduce and genomic analysis, it is necessary to
understand the characteristics that make the model
important for this research field. When supported
by the MapReduce model, the application develop-
ment is particularly well suited to common “map-
reduce scan” pipelines. Schatz introduced some im-
portant tasks for application development that can be
achievedwith MapReduce (Schatz, 2010), such as the
following:
1. Map: Genomic problems which are composed of
many sequences that can be mapped to the refer-
ence genome in parallel with multiple machines.
2. Reduce: Sequences of alignments are aggregated
so that all the alignments on the same chromo-
some or locus are grouped together and sorted by
position.
3. Scan: The sorted alignments are scanned to iden-
tify biological events, such as polymorphism or
different expressions.
On the basis of the above, it is worth discussing
the open MapReduce framework (Apache Hadoop)
that is used to build apps that conform to the needs
of genomics. In addition, there are libraries such as
Hadoop-BAM (Niemenmaa et al., 2012) that are used
to dealing with BAM files (a compressed file format
that is used for NGS and usually well suited to pro-
cessing genomic sequences in a large number of ma-
chines). Crossbow (Gurtowski et al., 2012) is another
example of how Hadoop can be used to discover Sin-
gle Nucleotide Polymorphism (SNP) from sequences
of data in cloud systems or Hadoop clusters. In a sim-
ilar way, our work is able to find gene mutations at
the first moment and afterwards, when making com-
parisons with databases, may detect possible diseases.
In the genomic mapping of sequences, CloudBurst
(Schatz et al., 2010) and ClodAligner (Nguyen et al.,
2011) are both cases where Hadoop can be used for
data analysis based on NGS sequencers for discover-
ing SNP sequences, as well as to build alignment for
short-reads or long-reads of genomic data in reference
to a human genome. It is worth taking note of the ca-
pability for scalability in these works through cluster
and cloud, as is shown in our work.
From the perspective of adopting an interface that
is user-friendly and easy for users, there are a range of
approaches that use MapReduce, such as the Genome
Analysis Toolkit (GATK) (McKenna et al., 2010)
where the aim is to create a functional language con-
trol flow by supporting the development of an NGS
application program. When compared with a tradi-
tional programming structure, it requires less time for
development. Another example is CloudDOE (Chung
et al., 2014) that frees scientists from the need to carry
out complicated procedures. Our study makes possi-
ble to create a system that saves time for user when
are genomic problems are being addressed.
In the case of health-care, Hansen stresses the ben-
efits that can be derived, (such as Big Data), from un-
derstanding factors such as the prevention of diseases,
detection of modifiable risk factors for disease and
intervention to bring about behavior change (Hansen
et al., 2014). As mentioned earlier, accessibility is
an important point to take into account. Our study
checks several disease databases to find a possible
relation of diseases with genomic mutations, with a
clear and simple method, based on the data output of
the Clinical Hospital of Porto Alegre (HCPA) scien-
tists. This study has the potential to help to find mu-
tations that are able to generate pathologies prior to
their action on an individual.
3.1 Genome Annotation
According to Costa, it is difficult to find an equivalent
system to genome annotation (Costa, 2014). There
are few Big Data projects that are aimed at supporting
the clinical area. The author cites Appistry Cloud, as
a cloud computing system for genetic analysis which
is concerned with oncology research and the develop-
ment of new drugs. Unlike our implementation, this
seeks to provide a tool to annotate generic patholo-
gies. CLC Bio is another work cited by Costa, as a
system for diagnosing cancer pathologies, although
this requires the user’s computer to install an appli-
cation to insert data and create scripts. These ap-
proaches are very complex for users without experi-
ence, in contrast with GMS, where the user only needs
to execute a web application.
The DNAnexus project (BCM, 2014) provides so-
lutions for DNA sequencing centers using NGS se-
quencers, since the application is developed for a
ICEIS2015-17thInternationalConferenceonEnterpriseInformationSystems
282
Cloud platform, but with an analysis and sequenc-
ing linked to DNA alignment. Although the analysis
does not involve polymorphism detection. The NGS
project (McKenna et al., 2010) shows a toolkit imple-
mentation in a MapReduce framework for an exome
analysis, the goal of which is capture sequencing , and
unlike other studies, our implementation is aimed at
identifying significant genetic mutations from a gene.
4 DESCRIPTION OF THE MODEL
Currently there are only a few applications for clinical
diagnosis that provide an automated genetic analysis
of patients with high scale of amount of data gener-
ated by NGS. A manual method was previously used
from the clinical diagnosis of patients by researchers
at the Clinical Hospital of Porto Alegre (HCPA), in
Brazil. Genetic data for each research study was ob-
tained from sequencers and entered by hand into Ex-
cel spreadsheets. After the data had been allocated
correctly, they had to be separated into codons and
comparedwith a mutation list that included the known
diseases. This process is time-consuming.
The Ion Torrent sequencers can generate data in
multiple formats, such as BAM, VCF and FASTA
(MEDLINE, 2013). The databases that provide ref-
erences for research are widely dispersed among a
hierarchy of classes. Several of these databases are
maintained by Government bodies such as the Na-
tional Center for Biotechnology Information (NCBI):
the database that stores information about several spe-
cific genetic mutations (dbSNP); the database that ref-
erences to the dbSNP and provides information about
mutations (Ensembl); the database that keeps infor-
mation about the composition of several coding ar-
eas of genes (CCDS) and the Gene Report, a database
that keeps information about mutations that are con-
sidered pathogenic, directly related to diseases. The
input data format used for these studies is similar to
FASTA.
This work implements a code by using the MR
programming model of Hadoop to analyze and pro-
cess the amount of data generated by the sequencing
process. Before starting the MR processing, the in-
put data is previously preprocessed by python scripts.
This preprocessing step indexes a cluster of genomic
analysis from several patients and forms a single in-
put data file. Each line of this file is composed by one
gene from one patient. The line is tagged by the pa-
tient identifier and the name of the gene. These data
are used in MR processing to determine how the gene
reference base should be used in the processing. This
model assumes that the input file is formed by differ-
ent kinds of genes and patients.
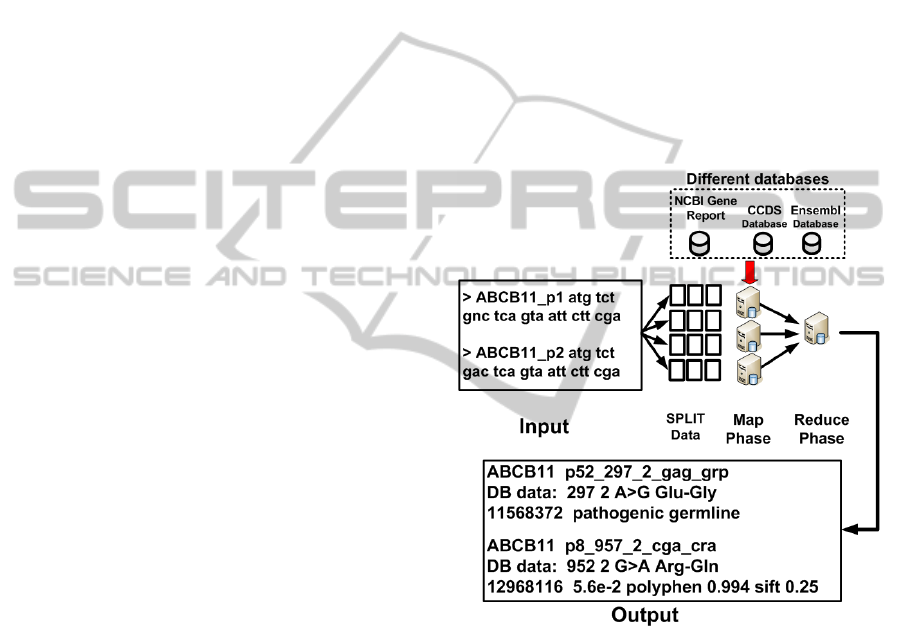
Figure 3 shows an overview of the flowchart of
this proposal. The flowchart is divided into three
stages. The first stage is responsible for persisting
the input data composed by the patients’ gene in the
Hadoop distributed file system (HDFS), where the
data is split into chunks. Each chunk consists of sev-
eral lines of the input data, where each line corre-
sponds to one gene from each patient. In the sec-
ond stage, a preprocessing of the input file is carried
out to find gene’s list from all patients. One Python
script search in CCDS database to find a reference
gene code, and index this information in a local mem-
ory cache of each worker node. The third stage is to
compose the annotation by using the code that imple-
ments the MR processing flow. The code consists of
two methods.
Figure 3: Flowchart of the proposal.
The first method is calling Map and is responsible
for reading the input data formed by the gene analysis
in patients and to compare the data with the reference
gene. The Map function notes the position where the
differenceis found, the reference tuple of the gene and
the input tuple of the patient gene. When a difference
is found in the input, this is compared with a reference
of genetic mutation in both Ensembl and Gene Report
databases. This comparison executes into Combiner
on Map phase.
The Combiner receives this data and searches in
the mutation databases. The search uses the position
and the name of the gene to query the databases and
writes the pathology data found. If one pathology is
reported, the Map emits a key/value pair intermedi-
GeneticMappingofDiseasesthroughBigDataTechniques
283
ate. The key is formed by the position in the gene and
the value within a tuple of a reference gene and the
patients’ gene.
After, the Reduce function emits a new key/value
pair with the information about any associated
pathologies, for each patient and saves on HDFS.
Only mutations found in the databases are written in
the output, followed by any messages from one asso-
ciated pathology to this mutation.
5 EVALUATION
This section describes the environment setup and re-
sults of the evaluation as a means of demonstrating
the features and scalability of our proposal.
5.1 The Environment Setup
Two environments have been considered. The first is
a cluster machine comprising 19 nodes with a hetero-
geneous configuration. In more detail, the cluster is
composed of 5 machines with a P4 2.79GHz proces-
sor, 2GB of RAM, and 400GB of hard disk; 14 ma-
chines with an Intel P4 2.79GHz Hyper Thread pro-
cessor, 2GB of RAM and 1TB hard disk; and a mas-
ter node with a QuadCore 3.1GHz processor, 4GB of
RAM and 1TB hard disk. The system is the Hadoop
version 1.0.4. The second is a cluster in Cloud Mi-
crosoft Azure that comprises 19 nodes, A1 type. This
node comprises a single core of Intel Xeon E5-2660,
1.75GB of memory RAM and 30GB of HDD. All of
the nodes have the same configuration. This study
relies on the same version of Hadoop and Linux ker-
nel in Azure in an attempt to approximate the results.
Azure settings were used to ensure that all the nodes
were allocated in the same geographic location.
In the experiments, we vary the number of used
worker nodes (i.e. 1, 2, 5, 10, 15 and 19) and the input
data size (i.e. 2GB, 10GB and 20GB). The number of
executions generated 18 different cases and each case
was executed 30 times, thus resulting in 540 experi-
ments being performed in the cluster. In all the tests,
the block size used by Hadoop for the data replication
and processing was 64MB and the replication factor
was set to 3. The standard deviation was lower than
5%.
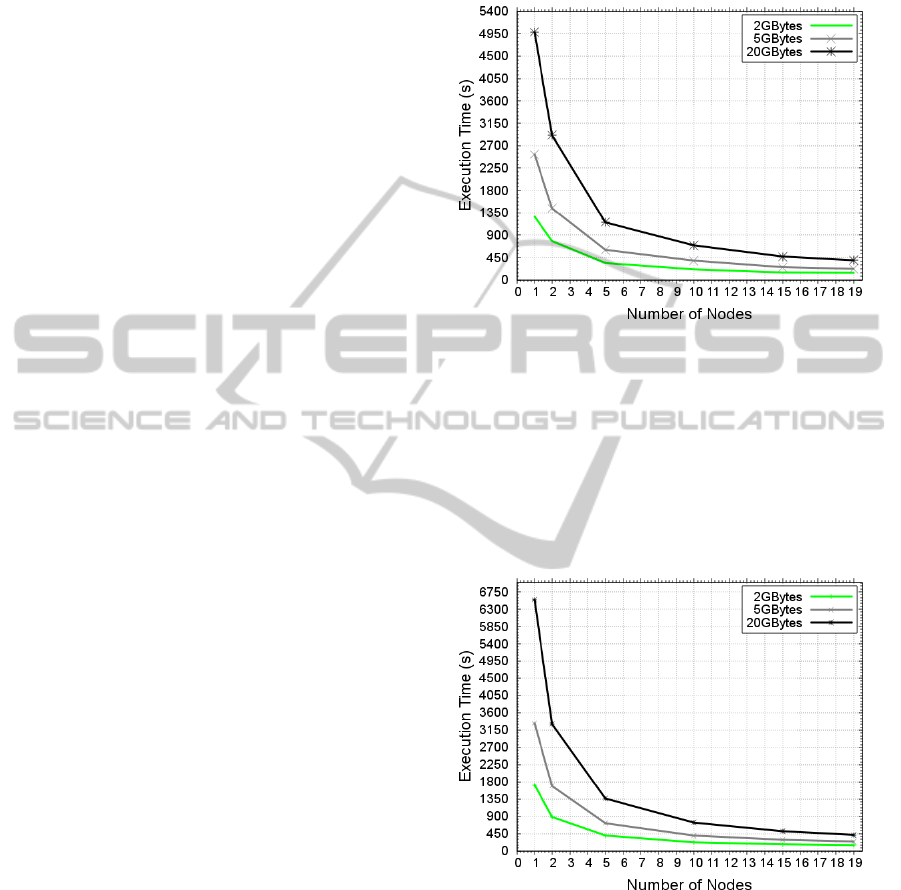
5.2 Results and Analysis
The experiment introduced by Figure 4 and Figure 5
shows the GMS execution time of the cluster and the
cloud. In the same configuration, it is often observed
that as the data input size increases, the executiontime
increases proportionally in the same way. The execu-
tion time is ≅ 2 hours for one standalone machine
(Intel P4 2.79GHz, 4GB RAM, HD 500GB).
Figure 4: GMS execution time in the GradeP cluster.
Similarly, when more nodes were added to al-
low the processing task to be carried out in a paral-
lel way, the time decreases proportionally to an in-
crease in the number of nodes. This occurs because
the data-intensive applications, developed by means
of Hadoop and the MR programming model, have a
greater scalability and better performance when there
is a larger volume of data.
Figure 5: GMS execution time in Cloud (Microsoft Azure).
The results showed that even the cloud configu-
ration has more powerful resources like newer CPU
cores than those of the cloud, the execution time is
slower than with the cluster. This can be explained
in function of shared network overhead on cloud. In
addition, Azure has to control the state of the virtual
machine that increases this overhead. However, both
of the configurations are scalable, which reduces the
run-time of all the input sizes in all the variations of
the node numbers. This shows that the solution pro-
ICEIS2015-17thInternationalConferenceonEnterpriseInformationSystems
284
posed by our work can be used either in cloud or clus-
ter environments, because it is scalable when there
is a large configuration of machines, and since the
speedup is considerable, it sets out from a sequential
time provided by one node. In addition, the increase
of the input size in the DNA sequencing increases the
requirements and the problem of the processing can
be resolved by adopting these approaches and tech-
niques.
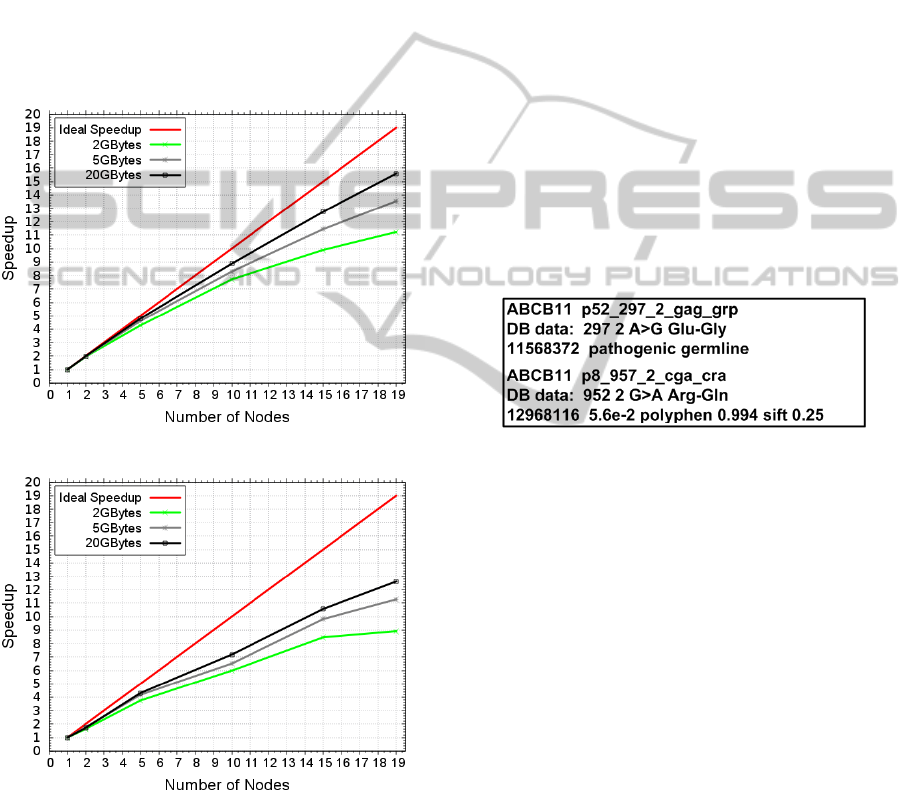
Figures 6 and 7 show the speedup. This met-
ric represents the acceleration of sequential execution
time when more than one node is used. The ideal
speedup is always the number of nodes used in the
execution.
Figure 6: GMS speedup in a Cluster.
Figure 7: GMS speedup in Cloud (Microsoft Azure).
The results in both cluster and cloud show that the
increase of speedup is related to the size of the input
data. In all the scenarios, the speedup improves when
more data are employed in the processing; this be-
havior is linked to MapReduce execution in Big Data.
The overhead required in Cloud for managing the re-
sources causes wait for the data to be processed.
The size of the input data can cover this time.
These results prove that large distributed machines
(ranging from a dozen to thousands of computed
nodes) correspond to the size of the data generated by
NGS sequencers, like Ion Torrent for example. The
last and most important point that needs to be made
is the question of achieving a better speedup by clus-
ter than by cloud. This performance is linked to the
execution time and the overhead (related by cloud)
which involves managing costs and sharing resources
through a network connection with the nodes.
5.2.1 Output Analyzis
The Figure 8 shows one example from the GMS
output. The detection of mutation A>G Glu-Gly
(pathogenic germline) in Position 2 of gene 297 com-
pared with reference DNA indicates the susceptibility
of colorectal cancer. The detection of mutation G>A
Arg-Gln in Position 2 of gene 957 compared with ref-
erence DNA, indicates the susceptibility to gallblad-
der cancer. This information demonstrates the correct
framework execution.
Figure 8: GMS output.
6 CONCLUSION
This work proposes and implements GMS to ana-
lyze and compute large amounts of data generated by
NGS sequencers such as Ion Torrent. In addition, this
study is a part of a research project that seeks to auto-
mate the process of collecting and processing of pa-
tient gene analysis, using techniques like a Big Data
framework and distributed environments to overcome
the limitations of traditional technologies, related to a
single personal computer.
The proposed GMS addressed the problems aris-
ing from automation and the handling of the data.
The detection of mutations e.g. A>G in Position
2 of gene 297 compared with reference DNA and
G>A in Position 2 of gene 957 compared with ref-
erence DNA, indicating the susceptibility of deter-
mined cancer type, demonstrates that our GMS pro-
posal achieves its initial goal. This work makes use of
two scenarios involving distributed machines, a clus-
ter and cloud computing. In the same scenarios, the
application proposes to enhance performance when
GeneticMappingofDiseasesthroughBigDataTechniques
285

using a greater number of resources. The results sug-
gest that both cluster and cloud can be used to achieve
a reduction of run-time, but the cloud scenery have a
overhead improved.
In future work, we believe that the researches
should to improve the features supported by the pro-
posed, such as those that concern generating feedback
from a mutation found in a patient gene to a database
of mutations like Ensembl or Gene Report can be im-
plemented. Other future study could attempt to im-
plement this system, for example, to finding an online
user-friendly solution in cloud. However, many issues
need still to be discussed to be explored graphic inter-
faces for the use of cloud to persist gene analysis of
the patients.
ACKNOWLEDGEMENTS
This work was supported by several institutions, in-
cluding the following: CNPq through grant number
MCT/CNPq N
o
70/2009 – PGAEST- MCT/CNPq;
FAPERGS via grant FAPERGS/CNPq 008/2009. It
was also assisted by the research project “GREEN-
GRID: Sustainable HPC”; Grid5000, a grid platform
developed by the INRIA ALADDIN project, and the
support provided by CNRS, RENATER and other uni-
versities. Some experiments were assisted by Mi-
crosoft Azure environment from Microsoft Research.
The research was also partly sponsored by CAPES
grant 99999.014966/2013-01(through DSE program)
and by CNPQ-PIBITI-UFRGS FUNTTEL - MARE-
MOTO project. Members from the GPPD MapRe-
duce group also assisted in the development of this
project.
REFERENCES
Alberts, B., Johnson, A., Lewis, J., Raff, M., Roberts, K.,
and Walter, P. (2014). Molecular Biology of the Cell.
Garland Science, 6th edition.
BCM (2014). DNA Nexus Project. Technical report.
Chung, W.-C., Chen, C.-C., Ho, J.-M., Lin, C.-Y., Hsu, W.-
L., Wang, Y.-C., Lee, D. T., Lai, F., Huang, C.-W.,
and Chang, Y.-J. (2014). CloudDOE: A User-Friendly
Tool for Deploying Hadoop Clouds and Analyzing
High-Throughput Sequencing Data with MapReduce.
PLOS ONE, 9:e98146.
Costa, F. F. (2014). Big data in biomedicine. Drug Discov-
ery Today, 19(4):433–440.
Dean, J. and Ghemawat, S. (2010). MapReduce - A Flexible
Data Processing Tool. Communications of the ACM,
53(1):72–77.
Frebourg, T. (2014). The challenge for the next generation
of medical geneticists. Hum Mutat, 35(8):909–11.
Gurtowski, J., Schatz, M. C., and Langmead, B. (2012).
Genotyping in the cloud with Crossbow. Curr Pro-
toc Bioinformatics.
Hansen, M., Miron-Shatz, T., Lau, A. Y. S., and Paton, C.
(2014). Big Data in Science and Healthcare: A Re-
view of Recent Literature and Perspectives. Yearbook
of medical informatics, 9(4):21–6.
Johnsen, J. M., Nickerson, D. A., and Reiner, A. P. (2013).
Massively parallel sequencing: the new frontier of
hematologic genomics. Blood, 122(19):3268–3275.
Kinsella, R. J., Kahari, A., Haider, S., Zamora, J., Proc-
tor, G., Spudich, G., Almeida-King, J., Staines, D.,
Derwent, P., Kerhornou, A., Kersey, P., and Flicek, P.
(2011). Ensembl BioMarts: a hub for data retrieval
across taxonomic space. Database, 2011:1–9.
McKenna, A., Hanna, M., Banks, E., Sivachenko, A.,
Cibulskis, K., Kernytsky, A., Garimella, K., Altshuler,
D., Gabriel, S., Daly, M., and DePristo, M. A. (2010).
The Genome Analysis Toolkit: A MapReduce frame-
work for analyzing next-generation DNA sequencing
data. Genome Research, 20(9):1297–1303.
MEDLINE (2013). The NCBI Handbook, volume
NBK143764. National Center for Biotechnology In-
formation, 2nd edition.
NCBI (2014). A Base Pathogenic Mutations. Technical
report.
Nguyen, T., Shi, W., and Shi, W. (2011). CloudAligner:
A fast and full-featured MapReduce based tool for se-
quence mapping. BMC Research Notes, 4(171):1–16.
Niemenmaa, M., Kallio, A., Schumacher, A., Klemela, P.,
Korpelainen, E., and Heljanko, K. (2012). Hadoop-
BAM: directly manipulating next generation sequenc-
ing data in the cloud. Bioinformatics, 28(6):876–877.
Nussbaum, R., McInnes, R., and Willard, H. (2013).
Thompson Genetics in Medicine. Elsevier Science
Publishers B. V., 7th edition.
O’Driscoll, A., Daugelaite, J., and Sleator, R. D. (2014).
Big data, Hadoop and cloud computing in genomics.
Journal of Biomedical Informatics, 46(5):774–781.
Sawyer, S. A., Parsch, J., Zhang, Z., and Hartl, D. L. (2007).
Prevalence of positive selection among nearly neutral
amino acid replacements in Drosophila. Proceedings
of the National Academy of Sciences, 104(16):6504–
6510.
Schatz, M. C., Langmead, B., and Salzberg, S. L. (2010).
Cloud computing and the DNA data race. NATURE
BIOTECHNOLOGY, 28(7):691–693.
Scientific, T. F. (2014). Choose Next-Generation Sequenc-
ing or Sanger Sequencing Solutions. Technical report.
White, T. (2012). Hadoop - The Definitive Guide, volume 1.
OReilly Media, Inc., 3rd edition.
William J, T. and Palladino, M. A. (2012). Introduction to
Biotechnology, volume 1. Pearson, 3rd edition.
Zou, Q., Li, X.-B., Jiang, W.-R., Lin, Z.-Y., Li, G.-L., and
Chen, K. (2014). Survey of MapReduce frame oper-
ation in bioinformatics. Briefings in Bioinformatics,
15(4):637–647.
ICEIS2015-17thInternationalConferenceonEnterpriseInformationSystems
286
