
CBK-Modes: A Correlation-based Algorithm for Categorical Data
Clustering
Joel Luis Carbonera and Mara Abel
Institute of Informatics, Federal University of Rio Grande do Sul, Porto Alegre, Brazil
Keywords:
Clustering, Subspace Clustering, Categorical Data, Attribute Weighting, Data Mining.
Abstract:
Categorical data sets are often high-dimensional. For handling the high-dimensionality in the clustering pro-
cess, some works take advantage of the fact that clusters usually occur in a subspace. In soft subspace cluster-
ing approaches, different weights are assigned to each attribute in each cluster, for measuring their respective
contributions to the formation of each cluster. In this paper, we adopt an approach that uses the correla-
tion among categorical attributes for measuring their relevancies in clustering tasks. We use this approach
for developing the CBK-Modes (Correlation-based K-modes); a soft subspace clustering algorithm that ex-
tends the basic k-modes by using the correlation-based approach for measuring the relevance of the attributes.
We conducted experiments on five real-world datasets, comparing the performance of our algorithm with five
state-of-the-art algorithms, using three well-known evaluation metrics: accuracy, f-measure and adjusted Rand
index. The results show that the performance of CBK-Modes outperforms the algorithms that were considered
in the evaluation, regarding the considered metrics.
1 INTRODUCTION
Clustering is a widely used technique in which a set
of data points is partitioned into a set of groups of ob-
jects that are as similar as possible (Aggarwal, 2014).
In this context, according to (Andreopoulos, 2014),
categorical data clustering refers to the clustering of
objects that are defined over categorical attributes (or
discrete-valued, symbolic attributes).
Traditionally, techniques of clustering are devel-
oped for handling objects that are described by nu-
merical attributes. In such cases, the similarity (or
dissimilarity) of objects and the quality of a cluster
can be determined using well-studied measures that
are derived from the geometric properties of the data
(Andreopoulos, 2014). In the case of categorical data
clustering, the categorical attributes are not inherently
comparable. Another challenge regarding categori-
cal data clustering arises from the fact that categor-
ical data sets are often high-dimensional (Bai et al.,
2011). In high-dimensional data, as the number of
dimensions in a dataset increases, distance measures
become increasingly meaningless, since thet the dis-
tance between a given object x and its nearest object
will be close to the dissimilarity between x and its far-
thest object. Due to this problem, which is one of the
aspects of the curse of dimensionality (Parsons et al.,
2004; Zimek, 2014), discovering meaningful separa-
ble clusters becomes a very challenging task.
For dealing with the curse of dimensionality, the
so-called subspace clustering approaches (Gan and
Wu, 2004; Zaki et al., 2007; Cesario et al., 2007;
Kriegel et al., 2012; Carbonera and Abel, 2014b) take
advantage of the fact that clusters usually occur in a
subspace defined by a subset of the original set of at-
tributes (Zimek, 2014). Soft subspace clustering (Jing
et al., 2007; Bai et al., 2011) is a special case of sub-
space clustering, in which different weights are as-
signed to each attribute in each cluster, for measur-
ing their respective contributions for the formation of
each cluster (Zimek, 2014). That is, in these tech-
niques, different weight vectors are assigned to dif-
ferent clusters. Due to this, the strategy for attribute
weighting plays a crucial role in soft subspace clus-
tering approaches.
In (Carbonera and Abel, 2014a), the authors ex-
plore a strategy for measuring the contribution of each
attribute considering its correlations with other at-
tributes. This approach is inspired by cognitive stud-
ies that state that humans spontaneously learn cate-
gories by exploring the correlations among the at-
tributes of the perceived objects. However, this ap-
proach was not evaluated in practical clustering al-
gorithms yet. In this paper, we address this issue,
603
Carbonera J. and Abel M..
CBK-Modes: A Correlation-based Algorithm for Categorical Data Clustering.
DOI: 10.5220/0005367106030608
In Proceedings of the 17th International Conference on Enterprise Information Systems (ICEIS-2015), pages 603-608
ISBN: 978-989-758-096-3
Copyright
c
2015 SCITEPRESS (Science and Technology Publications, Lda.)

by developing a novel algorithm called CBK-modes
1
(Correlation-based K-modes), which extends the ba-
sic k-modes algorithm by adopting the approach pro-
posed by (Carbonera and Abel, 2014a) for attribute
weighting. The performance of this algorithm was
compared against the performances of five algorithms
available in the literature, considering five real data
sets. The results show that CBK-Modes has perfor-
mances that are comparable to the performances of
other state-of-the-art algorithms that were considered
in the evaluation. The results also show that, in gen-
eral, CBK-modes has performances that are better
than the performances of other algorithms. The ex-
perimental analysis also suggest that the correlation-
based approach for attribute weighting is a sufficient
condition for improving the performance of clustering
algorithms.
In Section 2 we discuss some related works.
Section 3 presents the formal notation that will be
used throughout the paper. Section 4 presents the
correlation-based attribute weighting proposed by
(Carbonera and Abel, 2014a). Section 5 presents the
CBK-modes algorithm. Experimental results are pre-
sented in Section 6. Finally, section 7 presents our
concluding remarks.
2 RELATED WORKS
In the last few years, several algorithms have been
proposed for dealing with categorical data clustering.
In this work, our focus of interest is on the so-called
soft subspace clustering approaches o categorical data
clustering, such as (Chan et al., 2004; Bai et al., 2011;
Cao et al., 2013; Jing et al., 2007; Carbonera and
Abel, 2014b).
According to (Jing et al., 2007), in subspace clus-
tering, objects are grouped into clusters considering
subsets of the original set of dimensions (or attributes)
of the data set. Soft subspace clustering can be viewed
as a specific case of subspace clustering. Approaches
of this type estimate the contribution of each attribute
for each specific cluster. The contribution of a dimen-
sion is measured by a weight that is estimated and as-
signed to the dimension during the clustering process.
Thus, the resulting clustering is performed in the full-
dimensional, though skewed data space.
The approach proposed in (Chan et al., 2004), for
example, computes each weight according to the aver-
age distance of data objects from the mode of a clus-
ter. Thus, a larger weight is assigned to an attribute
1
The source of the CBK-modes algorithm can be found
in http://www.inf.ufrgs.br/∼jlcarbonera/?page id=87.
that has a smaller sum of the within cluster distances
and a smaller weight is assigned to an attribute that
has a larger sum of the within cluster distances. The
approach proposed in (Bai et al., 2011) assumes that
the contribution of a given attribute for a given clus-
ter is proportional to the frequency of the categori-
cal value of the mode of the cluster for that attribute.
In (Cao et al., 2013), the authors apply the notion of
complement entropy for developing an approach for
attribute weighting. The complement entropy reflects
the uncertainty of an object set with respect to an at-
tribute (or attribute set), in a way that the bigger the
complement entropy value is, the higher the uncer-
tainty is. In (Jing et al., 2007), the authors propose an
approach for attribute weighting based on the notion
of entropy, which is a measure of the uncertainty of a
given random variable. This approach minimizes the
within cluster dispersion and maximizes the negative
weight entropy to stimulate more dimensions to con-
tribute to the identification of a cluster. In (Carbon-
era and Abel, 2014b), the authors propose to measure
the relevance of categorical attributes in the cluster-
ing process through the entropy-based relevance in-
dex (ERI). The ERI of some attribute a
h
(given by
ERI(a
h
)) is inversely proportional to the average of
the uncertainty that is projected to the attribute a
h
by
the modes of all attributes in the dataset.
3 NOTATION
In this section, we will introduce the notation, adopted
from (Carbonera and Abel, 2014a), which will be
used throughout the paper:
• U = {x
1
, x
2
, ..., x
n
} is a non-empty set of n data
objects, called a universe.
• A = {a
1
, a
2
, ..., a
m
} is a non-empty set of m cate-
gorical attributes.
• dom(a
i
) = {a
(1)
i
, a
(2)
i
, ..., a
(l
i
)
i
} describes the do-
main of values of the attribute a
i
∈ A, where l
i
,
is the number of categorical values that a
i
can
assume in U. Notice that dom(a
i
) is finite and
unordered, e.g., for any 1 ≤ p ≤ q ≤ l
i
, either
a
(p)
i
= a
(q)
i
or a
(p)
i
6= a
(q)
i
.
• V is the union of attribute domains, i.e., V =
S
m
j=1
dom(a
j
).
• C = {c
1
, c
2
, ..., c
k
} is a set of k disjoint partitions
of U, such that U =
S
k
i=1
c
i
.
• Each x
i
∈ U is a m − tuple, such that x
i
=
(x
i1
, x
i2
, ..., x
im
), where x
iq
∈ dom(a
q
) for 1 ≤ i ≤ n
and 1 ≤ q ≤ m.
ICEIS2015-17thInternationalConferenceonEnterpriseInformationSystems
604

4 CORRELATION-BASED
APPROACH FOR
CATEGORICAL ATTRIBUTE
WEIGHTING
In (Carbonera and Abel, 2014a), the authors devel-
oped an approach for attribute weighting consider-
ing the correlations among the categorical attributes
as a measure of their relevance. This proposal was
inspired by studies in the Cognitive Sciences (Slout-
sky, 2010) that have pointed out that humans spon-
taneously learn categories exploring the correlations
among the attributes of the perceived objects. The ap-
proach proposed by the authors does not require pre-
vious supervised labeling of the data set and does not
require the setting of any parameter. In the following,
we will present this approach.
Since the frequency of the categorical values in
the dataset is important for the approach, it is consid-
ered the function f req
i
: V → N, which maps a given
categorical value a
(l)
h
to the number of objects in the
partition c
i
∈ C that are characterized by a
(l)
h
in the
corresponding attribute a
h
∈ A. That is
f req
i
(a
(l)
h
) = |{x
q
|x
q
∈ c
i
and x
q,h
= a
(l)
h
}| (1)
where, ∀a
(l)
h
∈ V ;∀c
i
∈ C; 0 ≤ f req
i
(a
(l)
h
) ≤ |c
i
|; let
|c
i
| be the number of data objects in c
i
. Notice that
in f req
i
, the index i means that we are considering all
objects in the partition c
i
∈ C. We will adopt the same
notation to the other functions.
Also, the function ψ
i
: V ×V → N maps two given
categorical values a
(l)
h
∈ dom(a
h
) and a
(p)
j
∈ dom(a
j
)
to the number of objects, in c
i
∈ C, in which these
values co-occur (assigned to the attributes a
h
and a
j
,
respectively). That is:
ψ
i
(a
(l)
h
, a
(p)
j
) =|{x
q
|x
q
∈ c
i
and x
qh
= a
(l)
h
and x
qj
= a
(p)
j
}|
(2)
Besides that, the function M
i
: V × A → N maps
a given categorical value a
(l)
h
∈ dom(a
h
) and a given
categorical attribute a
j
∈ A, to the greatest value
that ψ
i
(a
(l)
h
, a
(p)
j
) can assume, considering all a
(p)
j
∈
dom(a
j
). That is:
M
i
(a
(l)
h
, a
j
) = max
p∈dom(a
j
)
{ψ
i
(a
(l)
h
, a
(p)
j
)} (3)
Thus, M
i
(a
(l)
h
, a
j
) represents the number of co-
occurrences of the value a
(l)
h
∈ a
h
and the value a
M
j
∈
a
j
in the partition c
i
∈ C; where a
M
j
is the categorical
value that has the greatest number of co-occurrences
with the value a
(l)
h
.
Finally, it is defined the function α
i
: V × A → R,
in a way that
α
i
(a
(l)
h
, a
j
) =
M
i
(a
(l)
h
, a
j
)
f req
i
(a
(l)
h
)
(4)
where ∀a
(l)
h
∈ V ; ∀a
j
∈ A; ∀c
i
∈ C; 0 ≤ α
i
(a
(l)
h
, a
j
) ≤ 1.
Considering these functions, it is possible to de-
fine the maximum co-occurrence correlation index
(mcci) and the correlational relevance index (cri); the
two main notions underlying the approach.
Definition 1. Maximum co-occurrence correlation
index: The mcci is an index that can be measured
between two given categorical attributes a
h
∈ A and
a
j
∈ A, considering a given partition c
i
∈ C, through
the function mcci
i
: A × A → R, such that:
mcci
i
(a
h
, a
j
) =
∑
|dom(a
h
)|
l=1
α
i
(a
(l)
h
, a
j
)
|dom(a
h
)|
(5)
where ∀a
h
∈ A; ∀a
j
∈ A; ∀c
i
∈ C;0 ≤
mcci
i
(a
h
, a
j
) ≤ 1. It is important to notice
that ∀a
(l)
h
∈ V ; ∀a
j
∈ A;∀c
i
∈ C;(M
i
(a
(l)
h
, a
j
) =
f req
i
(a
(l)
h
)) =⇒ (mcci
i
(a
h
, a
j
) = 1); i.e.,
mcci
i
(a
h
, a
j
) assumes the greatest value possible
in this situation. Thus, informally, the mcci measured
between a
h
∈ A and a
j
∈ A is proportional to how
much the categorical values a
(p)
j
∈ a
j
vary, regarding
each categorical value a
(l)
h
∈ a
h
. Notice also that
mcci
i
(a
h
, a
j
) is not necessarily equal to mcci
i
(a
j
, a
h
).
Definition 2. Correlational relevance index: The cri
is an index that can be assigned to a given attribute a
h
in a given partition c
i
∈ C as defined by the function
cri
i
: A → R, such that
cri
i
(a
h
) =
∑
|A|
j=1
mcci
i
(a
j
, a
h
)
|A|
(6)
where ∀a
j
∈ A;∀c
i
∈ C;0 ≤ cri
i
(a
h
) ≤ 1.
Thus, the correlational relevance index of a given
attribute a
h
∈ A, considering a given partition c
i
∈C of
the data set, is proportional to the average of the maxi-
mum co-occurrence correlation indexes that are mea-
sured between every a
j
∈ A and a
h
. We assume that
the correlational relevance index of a given attribute
can be used as a measure of its relevance, considering
a given partition of the data set, for categorical clus-
tering tasks.
In (Carbonera and Abel, 2014a) the authors also
proposed an algorithm for computing the cri of all at-
tributes a
h
, assuming a given partition c
i
of the data
CBK-Modes:ACorrelation-basedAlgorithmforCategoricalDataClustering
605

set as input. More details and examples regarding
this approach can be viewed in (Carbonera and Abel,
2014a).
5 CBK-MODES: A
CORRELATION-BASED
K-MODES
The CBK-modes extends the basic K-modes algo-
rithm (Huang, 1998) by considering correlational rel-
evance index (cri) for measuring the relevance of each
attribute in each cluster. Thus, the CBK-modes can be
viewed as a soft subspace clustering algorithm. Our
algorithm uses the k-means paradigm for searching a
partition of U into k clusters that minimize the objec-
tive function P(W, Z, V ), with unknown variables W,
Z and V , as follows:
min
W,Z,V
P(W, Z, V ) =
k
∑
l=1
n
∑
i=1
w
li
d(x
i
, z
l
) (7)
subject to
w
li
∈ {0, 1} 1 ≤ l ≤ k, 1 ≤ i ≤ n
k
∑
l=1
w
li
= 1, 1 ≤ i ≤ n
0 ≤
n
∑
i=1
w
li
≤ n, 1 ≤ l ≤ k
v
lj
∈ [0, 1], 1 ≤ l ≤ k, 1 ≤ j ≤ m
(8)
where:
• W = [w
li
] is a k × n binary membership matrix,
where w
li
= 1 indicates that x
i
is allocated to the
cluster C
l
.
• Z = [z
lj
] is a k ×m matrix containing k cluster cen-
ters.
The dissimilarity function d(x
i
, z
l
) is defined as
follows:
d(x
i
, z
l
) =
m
∑
j=1
θ
a
j
(x
i
, z
l
) (9)
where
θ
a
j
(x
i
, z
l
) =
(
1, x
ij
6= z
lj
1 − v
lj
, x
ij
= z
lj
(10)
where
v
lj
= cri
l
(a
j
) × cri
U
(a
j
) (11)
Notice that v
lj
is the result of a local attribute
weight (cri
l
(a
j
)) multiplied by a global attribute
weight (cri
U
(a
j
)). In this way, we are considering the
contributions of the correlations among attributes in
both local and global levels.
The minimization of the objective function 7 with
the constraints in 8 forms a class of constrained non-
linear optimization problems whose solutions are un-
known. The usual method towards optimization of 7
Algorithm 1: CK-modes.
Input: A set of categorical data objects U and the number k of
clusters.
Output: The data objects in U partitioned in k clusters.
begin
Initialize the variable oldmodes as a k × |A|-ary empty array;
Randomly choose k distinct objects x
1
, x
2
,...,x
k
from U and
assign [x
1
, x
2
, ..., x
k
] to the k × |A|-ary variable newmodes;
Calculate initial global weights GW
j
of a
j
∈ A using cri
U
(a
j
);
Set all initial weights LW
lj
to GW
j
, where 1 ≤ l ≤ k, 1 ≤ j ≤ m;
Set all initial weights v
lj
to LW
lj
× GW
j
, where 1 ≤ l ≤ k,
1 ≤ j ≤ m;
while oldmodes 6= newmodes do
for i ← 1 to |U| do
for l ← 1 to k do
Calculate the dissimilarity (using the
dissimilarity function of equation 9) between
the i − th object and the l −th mode and
classify the i − th object into the cluster
whose mode is closest to it;
for l ← 1 to k do
Find the mode z
l
of each cluster and assign to
newmodes;
Calculate the weight LW
lh
of each attribute a
h
∈ A
of the l − th cluster, using cri
l
(a
h
);
Set all initial weights vlj to LW
lj
× GW
j
, where
1 ≤ l ≤ k, 1 ≤ j ≤ m;
is to use partial optimization for Z, W and V . In this
method, following (Cao et al., 2013), we first fix Z
and V and find necessary conditions on W to mini-
mize P(W, Z, V ). Then, we fix W and V and minimize
P(W, Z, V ) with respect to Z. Finally, we then fix W
and Z and minimize P(W, Z, V ) with respect to V . The
process is repeated until no more improvement in the
objective function value can be made. The Algorithm
1 presents the CBK-modes algorithm, which formal-
izes this process, using the correlational relevance in-
dex for measuring the relevance of each attribute in
each cluster.
6 EXPERIMENTS
The evaluation of our approach was performed by
comparing the CBK-modes algorithm with five state-
of-the-art algorithms. This comparison was based on
three well-known evaluation measures: accuracy (or
purity) (Huang, 1998; He et al., 2011), f-measure
(Larsen and Aone, 1999) and adjusted Rand index
(Bai et al., 2011). Our tests considered six real-
world data sets: congressional voting records, mush-
room, breast cancer, soybean
2
, genetic promoters and
splice-junction gene sequences. All the data sets were
2
This data set combines the large soybean data set and
its corresponding test data set
ICEIS2015-17thInternationalConferenceonEnterpriseInformationSystems
606
obtained from the UCI Machine Learning Reposi-
tory
3
. Regarding the data sets, the missing value in
each attribute was considered as a special category in
our experiments.
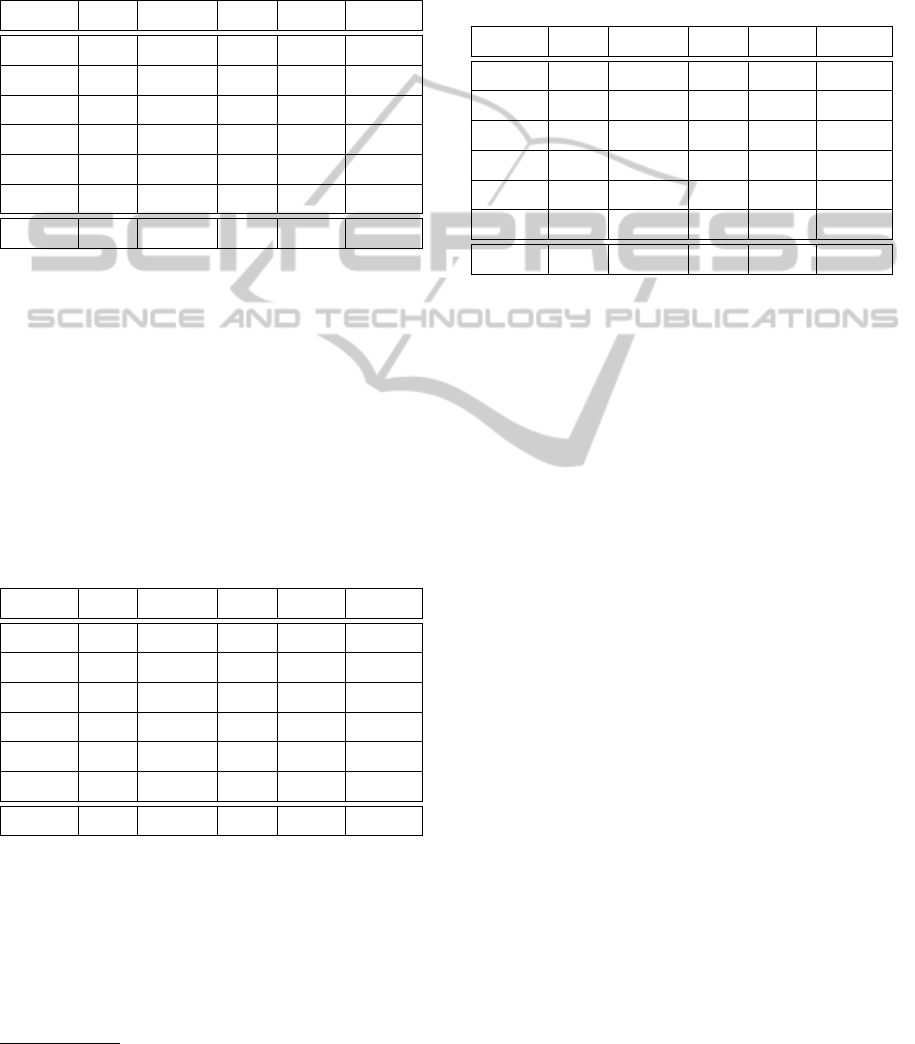
Table 1: Comparison of the average accuracy produced by
each algorithm in 100 random runs, and the respective stan-
dard deviations.
Algorithm Vote Mushroom
Breast
cancer
Soybean Promoters
KM
0.86
±0.02
0.71
±0.15
0.70
±0.00
0.63
±0.03
0.59
±0.08
NWKM
0.86
±0.03
0.72
±0.14
0.70
±0.01
0.63
±0.04
0.61
±0.08
MWKM
0.86
±0.01
0.72
±0.14
0.70
±0.00
0.63
±0.03
0.61
±0.08
WKM
0.87
±0,01
0.73
±0.13
0.70
±0.01
0.65
±0.03
0.62
±0.08
EBKM
0.87
±0.00
0.76
±0.12
0.70
±0.01
0.66
±0.03
0.62
±0.08
CBKM
0.87
±0.00
0.76
±0.13
0.71
±0.01
0.66
±0.03
0.65
±0.11
Average
0.87
±0.01
0.73
±0.14
0.70
±0.01
0.64
±0.03
0.62
±0.09
We compared the CBK-modes (CBKM) algo-
rithm with five algorithms available in the literature:
standard k-modes (KM) (Huang, 1998), NWKM (Bai
et al., 2011), MWKM (Bai et al., 2011), WK-modes
(WKM) (Cao et al., 2013) and EBK-modes (EBKM)
(Carbonera and Abel, 2014b). For the NWKM algo-
rithm, following the recommendations of the authors,
the parameter β was set to 2. For the same reason, for
the MWKM algorithm, we have used the following
parameter settings:β = 2, T
v
= 1 and T
s
= 1.
Table 2: Comparison of the average f-measure produced
by each algorithm in 100 random runs, and the respective
standard deviations.
Algorithm Vote Mushroom
Breast
cancer
Soybean Promoters
KM
0.76
±0.02
0.64
±0.13
0.54
±0.00
0.42
±0.04
0.53
±0.05
NWKM
0.78
±0.03
0.64
±0.12
0.56
±0.05
0.42
±0.05
0.54
±0.04
MWKM
0.77
±0.01
0.64
±0.12
0.54
±0.02
0.42
±0.05
0.54
±0.05
WKM
0.78
±0,01
0.66
±0.12
0.55
±0.04
0.45
±0.04
0.55
±0.05
EBKM
0.78
±0.00
0.67
±0.11
0.56
±0.05
0.45
±0.04
0.55
±0.05
CBKM
0.79
±0.01
0.68
±0.12
0.59
±0.06
0.47
±0.04
0.57
±0.07
Average
0.78
±0.01
0.66
±0.12
0.56
±0.04
0.44
±0.04
0.55
±0.05
For each data set, we carried out 100 random
runs of each one of the considered algorithms. This
was done because all of the algorithms choose their
initial cluster centers via random selection methods,
and thus the clustering results may vary depending
on the initialization. In each run, we computed the
performance metrics that were selected: accuracy, f-
measure and adjusted Rand index. The Tables 1, 2
3
http://archive.ics.uci.edu/ml/
and 3 present respectively, the averages (with stan-
dard deviation) of accuracy, f-measure and adjusted
Rand index. Notice that in these tables, the average
performance is presented at the top of each cell and
standard deviation is presented at the bottom.
Table 3: Comparison of the average adjusted Rand index
(ARI) produced by each algorithm in 100 random runs, and
the respective standard deviations.
Algorithm Vote Mushroom
Breast
cancer
Soybean Promoters
KM
0.51
±0.01
0.26
±0.26
0.01
±0.02
0.37
±0.04
0.06
±0.08
NWKM
0.54
±0.06
0.26
±0.25
0.02
±0.05
0.37
±0.05
0.07
±0.08
MWKM
0.52
±0.01
0.28
±0.25
0.01
±0.02
0.37
±0.05
0.07
±0.09
WKM
0.54
±0.02
0.29
±0.25
0.02
±0.05
0.41
±0.05
0.08
±0.09
EBKM
0.54
±0.01
0.33
±0.23
0.03
±0.05
0.42
±0.05
0.09
±0.10
CBKM
0.54
±0.01
0.33
±0.25
0.05
±0.06
0.42
±0.04
0.13
±0.13
Average
0.53
±0.02
0.29
±0.25
0.02
±0.04
0.39
±0.05
0.08
±0.10
The Tables 1, 2 and 3 show that the CBK-modes
algorithm is able to achieve high-quality overall re-
sults, considering the selected data sets and measures
of performance. Notice that the CBK-modes algo-
rithm have performances that are equivalent to or
better than the performances of state-of-the-art algo-
rithms, such as NWKM, MWKM and EBKM. And,
since the performance CBK-modes is better than the
performance of the basic K-modes, we can conclude
that using the correlational relevance index as a mea-
sure of the relevance of attributes is a sufficient con-
dition for improving the performance of the basic K-
modes algorithm.
7 CONCLUSION
In this paper, we propose CBK-modes, an extension
of the K-modes algorithm, which uses a correlation-
based approach for attribute weighting. Our experi-
ments have shown that the proposed algorithm has a
performance comparable to (or even better than) the
performance of the state-of-the-art algorithms. The
results also suggest that using the correlational rel-
evance index as a measure of the relevance of at-
tributes is a sufficient condition for improving the per-
formance of the clustering algorithms. In the next
steps, we plan to investigate how the correlational
relevance index can be used for improving the per-
formance of others algorithms and how this approach
can be extended for dealing with mixed data sets (with
both categorical and numerical attributes).
CBK-Modes:ACorrelation-basedAlgorithmforCategoricalDataClustering
607

ACKNOWLEDGEMENTS
We gratefully thank Brazilian Research Council,
CNPq, PRH PB-17 program (supported by Petro-
bras), for the financial support to this work. In addi-
tion, we would like to thank Sandro Fiorini for com-
ments and ideas.
REFERENCES
Aggarwal, C. C. (2014). Data Clustering: Algorithms
and Applications, chapter An Introduction to Cluster
Analysis, pages 1–28. CRC Press.
Andreopoulos, B. (2014). Data Clustering: Algorithms and
Applications, chapter Clustering Categorical Data,
pages 1–28. CRC Press.
Bai, L., Liang, J., Dang, C., and Cao, F. (2011). A
novel attribute weighting algorithm for clustering
high-dimensional categorical data. Pattern Recogni-
tion, 44(12):2843–2861.
Cao, F., Liang, J., Li, D., and Zhao, X. (2013). A weighting
k-modes algorithm for subspace clustering of categor-
ical data. Neurocomputing, 108:23–30.
Carbonera, J. L. and Abel, M. (2014a). Categorical data
clustering:a correlation-based approach for unsuper-
vised attribute weighting. In Proceedings of ICTAI
2014.
Carbonera, J. L. and Abel, M. (2014b). An entropy-based
subspace clustering algorithm for categorical data. In
Proceedings of ICTAI 2014.
Cesario, E., Manco, G., and Ortale, R. (2007). Top-down
parameter-free clustering of high-dimensional cate-
gorical data. Knowledge and Data Engineering, IEEE
Transactions on, 19(12):1607–1624.
Chan, E. Y., Ching, W. K., Ng, M. K., and Huang, J. Z.
(2004). An optimization algorithm for clustering us-
ing weighted dissimilarity measures. Pattern recogni-
tion, 37(5):943–952.
Gan, G. and Wu, J. (2004). Subspace clustering for high
dimensional categorical data. ACM SIGKDD Explo-
rations Newsletter, 6(2):87–94.
He, Z., Xu, X., and Deng, S. (2011). Attribute value weight-
ing in k-modes clustering. Expert Systems with Appli-
cations, 38(12):15365–15369.
Huang, Z. (1998). Extensions to the k-means algorithm for
clustering large data sets with categorical values. Data
Mining and Knowledge Discovery, 2(3):283–304.
Jing, L., Ng, M. K., and Huang, J. Z. (2007). An
entropy weighting k-means algorithm for subspace
clustering of high-dimensional sparse data. Knowl-
edge and Data Engineering, IEEE Transactions on,
19(8):1026–1041.
Kriegel, H.-P., Kr
¨
oger, P., and Zimek, A. (2012). Subspace
clustering. Wiley Interdisciplinary Reviews: Data
Mining and Knowledge Discovery, 2(4):351–364.
Larsen, B. and Aone, C. (1999). Fast and effective text
mining using linear-time document clustering. In
Proceedings of the fifth ACM SIGKDD international
conference on Knowledge discovery and data mining,
pages 16–22. ACM.
Parsons, L., Haque, E., and Liu, H. (2004). Subspace clus-
tering for high dimensional data: a review. ACM
SIGKDD Explorations Newsletter, 6(1):90–105.
Sloutsky, V. M. (2010). From perceptual categories to
concepts: What develops? Cognitive science,
34(7):1244–1286.
Zaki, M. J., Peters, M., Assent, I., and Seidl, T. (2007).
Clicks: An effective algorithm for mining subspace
clusters in categorical datasets. Data & Knowledge
Engineering, 60(1):51–70.
Zimek, A. (2014). Data Clustering: Algorithms and Appli-
cations, chapter Clustering High-Dimensional Data,
pages 201–229. CRC Press.
ICEIS2015-17thInternationalConferenceonEnterpriseInformationSystems
608
