
Scoping Automation in Software Product Lines
Andressa Ianzen
1
, Rafaela Mantovani Fontana
1,2
, Marco Antonio Paludo
1
, Andreia Malucelli
1
and Sheila Reinehr
1
1
Pontifical Catholic University of Paraná (PUCPR), R. Imaculada Conceição, 1155, Curitiba, PR, Brazil
2
Federal University of Paraná (UFPR), R. Dr. Alcides Vieira Arcoverde, 1225, Curitiba, PR, Brazil
Keywords: Linguistic Annotation, Software Product Lines, Scoping.
Abstract: Software product lines (SPL) are recognized as a way to increase the quality as well as to reduce the cost,
delivery time, and mitigate risks of software products. Scoping, an essential step in SPLs, requires time and
effort of domain experts; thus, automation initiatives at this stage are invaluable. This paper presents a semi-
automatic approach for defining scope in SPLs. Consequently, a method is pro-posed for the semi-automatic
identification and classification of product features, along with an approach for evaluating the variabilities
and commonalities between the established line and a new product. Experiments conducted to evaluate the
approach verify the benefits of the semi-automatization of scoping, including reduction of the time and
human effort involved.
1 INTRODUCTION
Software Product Lines (SPL) are recognized as a
way to increase quality, reduce costs, reduce
delivery time, and minimize risks in software
production (Clements and Northrop, 2002). Using
SPLs, reuse is systematized, drawing upon the
identification and development of assets that will be
reused by SPL products and their architecture
(Linden et al., 2007).
To identify reusable assets that should be
developed, execution of an activity called scoping is
essential. The scoping activity aims to map the scope
while identifying and delimiting the products,
features, and areas of the domain that should be part
of the SPL. It also identifies common features and
variables, and is critical to the success of the SPL
(John, 2010).
Scoping requires intense participation of the
domain experts. In the creation of a SPL, according
to the extraction approach (Alves et al., 2010),
existing systems are first used to create an assets
base. Since the dependence on human intervention at
this stage can be limiting, it is important to adopt an
approach that reduces the need for the presence of
domain experts (John et al., 2006).
The goal of this study is to develop a semi-
automatic approach to assist in SPL scoping. The
proposed approach consists of two steps: 1) scoping,
using a proposed method for the semi-automatic
identification and classification of features based on
artifacts of the organization’s product; and 2)
product engineering, which facilitates evaluation of
the variabilities and commonalities between the
created SPL and a new product, and is used to
support the decision on whether to include the
product in the product family.
The proposed approach can help organizations
that wish to migrate to the SPL approach to begin
mapping their products and view them as families in
the same domain that share components seen as
common features.
The remainder of this paper is organized as
follows: In Section 2, work related to SPL scoping is
presented. In Section 3, the structure of the study is
discussed. In Section 4, the proposed approach is
outlined. In Section 5, the results obtained are
discussed. Finally, in Section 6, conclusions and
limitations of the study are presented.
2 SCOPING IN SPL
Sixteen proposals related to scoping in SPL were
identified in a literature review conducted.
In Ganesan et al., (2006), an approach for
analyzing the source code to identify the people who
know the domain of the organization's products is
82
Ianzen A., Mantovani Fontana R., Paludo M., Malucelli A. and Reinehr S..
Scoping Automation in Software Product Lines.
DOI: 10.5220/0005372400820091
In Proceedings of the 17th International Conference on Enterprise Information Systems (ICEIS-2015), pages 82-91
ISBN: 978-989-758-097-0
Copyright
c
2015 SCITEPRESS (Science and Technology Publications, Lda.)

presented. This is one of the major benefits of the
method for the scoping phase.
The approach proposed by Noor et al., (2007)
performs the scoping manually, and promotes the
migration of existing systems to the SPL approach.
The mapping phase of product line requires the
participation of stakeholders and domain experts.
In Noor et al., (2008), principles of agile
methodologies are applied in the planning of SPL,
and the participation of stakeholders who know the
domain is required during the execution of the
process.
In Carbon et al., (2009), the agile practice
“planning game” was adapted and used with SPL,
complementing the continuous process of scoping. It
focuses especially on changes or new requirements
from external customers.
Analysis of the approaches presented in John and
Eisenbarth (2009) indicates that scoping is an
activity that involves various stakeholders of the
organization and that all sixteen approaches are
considered relevant. The selection criteria to
consider an approach to be relevant are
characteristics like strong relationship with product
lines, some maturity, and sufficient documentation
to be understood and applied.
The study by Liu et al. (2010) initially proposed
the identification of commonalities between
different domains to be analyzed subsequently by
developers. The difficulty of the essential
commonalities between the systems being found and
persisting was demonstrated.
The basis of the approach by Ullah et al., (2010)
is the generation of multiple product portfolios from
customer preferences, requiring strong intervention
of the customers in the process. The base is existing
systems that will evolve into the SPL, considering
the structure of the systems, so as to propose
variations.
The commonality and variability extraction
(CAVE) approach proposed by John (2010) is a
manual approach that uses user documentation as a
source for the process of scoping. In the proposed
approach, an SPL consultant applies patterns to
design a matrix that is subsequently validated by the
domain expert.
The work presented in Lee et al., (2010)
compares and analyzes traditional approaches to the
realization of the activity of scoping to find its
essential components and develop them into a single
approach.
The approach by Muller (2011) has a focus that
is complementary to scoping, in that it seeks to
identify features that most directly influence the
financial performance of the line.
Unlike the approach presented previously by
Ganesan et al., (2006), in which the source code is
examined in order to identify people with
involvement in the domain, the next two approaches
use the source code to identify the product features.
Duszynski (2011) proposes a reverse engineering
approach to extract variability information from the
source code of similar software products. The
requirement is to use codes that are clones of the
others, typically obtained from products that have
been duplicated and do not employ the concepts of
SPL. Ziadi et al., (2012) created class diagrams
simplified for later decomposition into smaller parts,
in order to identify candidate features. In both of the
above cases, the intervention of experts is necessary,
owing to the limitations of the approaches.
Other semi-automatic approaches have been
proposed by Yoshimura et al., (2008), who
examined the candidate variabilities based on the
historical product version, considering that its
variables can be obtained because there are
persistence’s in change history and by Archer et al.,
(2012), who had the goal of transposing the
description of products into a feature model, in
which product descriptions are organized into tables,
with each row representing a product.
The proposal by Medeiros and Almeida (2012) is
a three-stage process that first extracts features based
on the source code of legacy applications, after
comparison of the similarities to finally obtain the
refinement of the result with the intervention of a
scope analyst, an expert in the application domain.
Finally, Cruz et al., (2013) makes the association
of source code of legacy applications with features
and considers issues such as measures of lines of
code, cyclomatic complexity, and coupling. The
authors adopt a process with stages of inference of
asset costs, relevance to the desired segments,
calculation, and qualification of candidate products
and, finally, the grouping of the best products for
each application segment.
Thus, it can be seen that most of the above
approaches require the intervention of experts,
stakeholders, or customers, performing manual tasks
that can generate errors and sometimes hamper the
efficiency of the SPL scoping process. The study in
John (2010) identified the importance and need for
automation of the standards for automatic analysis of
documents and identification of artifacts for SPL.
To satisfy the need identified in the literature and
in the results of the analysis of current approaches,
this paper proposes an approach that reduces human
involvement in the scoping phase of the SPL. The
ensuing section shows how the approach proposed to
fill this gap was developed.
ScopingAutomationinSoftwareProductLines
83

3 STUDY STRUCTURE
This study aimed to develop a semi-automatic
approach to assist in SPL scoping. To achieve the
proposed objective, the research was divided into
two stages, as depicted in Figure 1:
Figure 1: Study structure.
In Stage 1, the conceived method was
implemented in the Java programming language,
using the Eclipse IDE. Partial results are detailed in
Section 4. The proposed method was evaluated via
an experiment with manuals from the LG family of
smartphones (available on the web). The experiment
aimed to compare the results of the manual reading
and analysis of six user manuals for creating an SPL,
with using the proposed approach for the creation of
the SPL. Two researchers participated in the
experiment.
The experiment was conducted in two stages. In
the first stage, six user manuals were read and the
features identified manually extracted. A total of 62
pages were read in the first manual, 51 pages in the
second, 48 pages in the third, 39 pages in the fourth,
30 pages in the fifth, and 52 pages in the sixth. In
total, 282 pages were read in the experiment, by both
participants. While the document was being read, the
identified features were also being recorded in
another document. The time spent reading and
extracting features from the documents was also
recorded.
In Stage 2, the proposed algorithm was
implemented to evaluate whether or not a new
product was part of an already established SPL. This
implementation was validated in an experiment that
evaluated whether four different products were part
of an existing SPL. The experiments were performed
based on the SPL created in the first experiment, and
evaluated 1) a cell phone from the family of
smartphones, but from another brand; 2) a
conventional cell phone of the same brand as used in
the creation of the SPL; 3) an LCD TV; and 4) a
smartphone from the same family as that of the SPL
that was generated in the previous stage.
The next section presents the proposed
approaches in two stages and describes the results of
the experiments used to evaluate them.
3.1 Threats to Validity
Experiments are used to verify the effects of
interventions (Kampenes et al., 2009). In this study,
they were used at two different times and in different
ways. The first involved the participation of
individuals to compare the manual to the semi-
automatic approach. The second involved testing of
the algorithm on different products to verify its
effectiveness in identifying the characteristics of
these products. For the second experiment, there
were no concerns about the internal validity, since
people were not involved. However, in the first
experiment, it was possible to identify a threat to the
internal validity called “selection bias” (Kampenes
et al., 2009).
According to Kampenes et al., (2009), selection
bias occurs when the characteristics of the
individuals involved in the experiment can influence
the result of the experiment. One way to reduce this
threat is to reduce differences between the
individuals involved. In this research, an attempt
was made to involve individuals with the same
training (IT), with completed or continuing post-
graduate studies. In this way, it is expected that
selection bias was reduced in the first experiment,
and that the threats to the internal validity of the
study were likewise reduced.
4 PROPOSED APPROACH TO
SPL SCOPING
This section presents the results of the study as well
as the experiments conducted in order to evaluate
Semi-automatic approach to assist in SPL scoping
Method for Semi-automatic identification
and cla ssification of features.
Experiment: comparison of analysis and
manual reading with the proposed
method.
Approach to evaluate the variabilities and
commonalities between the created SPL
and a new product.
Experiment: evaluation of four different
products in an existing SPL.
STAGE 1
ST
A
GE 2
ICEIS2015-17thInternationalConferenceonEnterpriseInformationSystems
84

them.
4.1 Method for Semi-automatic
Identification and Classification of
Features
The process used in the implemented application is
shown in Figure 2 and begins with definition of the
source folder of the documents. If they are in PDF
format, they are converted to TXT format using the
PDFBox library (Apache, 2012). Processing by
TreeTagger then occurs, in which the words are
separated by blanks (tokenization) using an
LXParser library, and special characters removed.
The definition of this set of special characters was
presented in a proof of concept of the linguistic
annotation tool conducted previously.
Each processed document gives rise to other
containing language annotations that, in turn, are
processed in the search for features. Lines that do
not have a verb (or that have a verb but no noun or
adjective) are ignored. All the others are processed
to identify the following sequences:
VERB + NOUN + ADJECTIVE
VERB + ADJECTIVE + NOUN
VERB + NOUN + NOUN
VERB + NOUN.
In an example text from the manual, “To send a text
message, use the phone,” two valid sequences were
found: “send text message” and “use phone.” It is
important to mention that the entire line is analyzed
at once, such that the desired standards are then
sought. For example, the line above would be
linguistically annotated as follows: (PRP to) (V
send) (NOM text) (NOM message) (V use) (Det the)
(NOM phone).
Then, only the verbs, nouns, and adjectives are
taken into consideration, and the format of the entire
line is identified. In the process, the patterns that are
searched for are compared with the format identified
in the sentence and, if there is a match, the words
that correspond to the pattern are removed from the
line and are considered a feature. The analysis then
continues without these words until the end of the
line.
The valid sequences identified are then analyzed
again to check which of them are related to auxiliary
verbs; these are then discarded. Then, the identified
features are processed to identify the root of words
in order to group similar nouns, as in the case of
plurals and verbs that are synonyms. Traceability of
the documents with the features is maintained for the
purpose of classification within the family.
The features are presented to the user with their
respective synonymous functionalities, when
applicable, and with one of the following
classifications: common (present in all products),
variable (present in two or more products), or
optional (present in a single product). Possible
actions are the exclusion or signaling of synonymous
features. After the user interactions, the features are
written to an eXtensible Markup Language (XML)
file to facilitate their reuse and distribution.
There is an iteration in this procedure to enable
the consideration of “stop features.” Following the
“TreeTagger” stage, which performs the linguistic
annotation of all the artifacts provided by the user
for the creation of the SPL, the algorithm moves on
to handle one artifact at a time. The first artifact is
processed, organized, and presented to the user. The
user analyzes the features, excludes what she wants
to exclude, creates synonymous features (if
necessary), and finalizes the analysis of the artifact.
At this point, the features that have been excluded
by the user are saved in a list of “stop features.”
The algorithm processes the next artifact and
takes into account the list of “stop features.” If any
identified feature is included in this list, it is
discarded and not presented to the user as a result of
the processing of this second artifact. The features of
this second artifact are organized and classified,
along with those that had already been identified in
the first artifact, and are presented again to the user
for exclusion and evaluation of synonymous
features.
Instead of processing, organizing, and presenting
the features located in all the artifacts provided by
the user all at once, the information is presented
cumulatively so that use of the list of “stop features”
is possible, with the aim of reducing the number of
features presented to the user. Figure 2 depicts the
stages in the process.
The SPL can be considered complete when the
user finishes analyzing the last artifact. Three files,
with information about the SPL, are saved on the
user’s computer:
“line.xml,” which contains all the features of the
SPL with its classifications
“SF.txt,” which contains a list of identified “stop
features.”
“line.properties,” which contains two values: the
total number of SPL features and a
representation of the lowest percentage of
common and variable features found during the
analysis of all the products of the SPL.
File “line.xml” is the file that represents the created
SPL. Through it, all the features comprising the
SPL, the products in which they are found, as well
ScopingAutomationinSoftwareProductLines
85
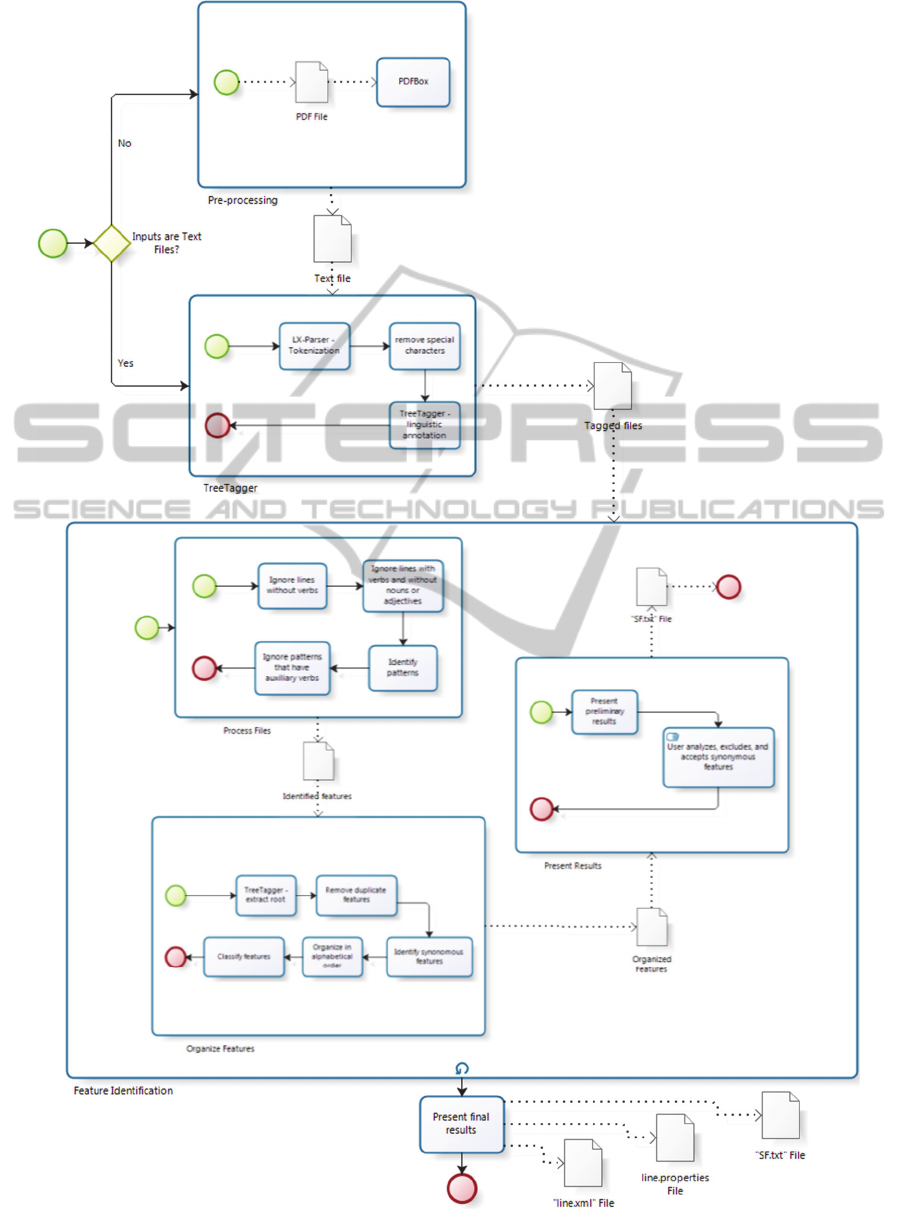
Figure 2: Stages in the semi-automatic method for identifying features.
ICEIS2015-17thInternationalConferenceonEnterpriseInformationSystems
86

Table 1: Summary of the manual stage.
Participant 1 Participant 2
Document name Identified features
Time spent
Identified features Time spent
LG Hotmail Phone C570 177 01:13:00 331 00:54:00
LG Optimus 2X P990 103 01:06:00 342 00:22:00
LG Optimus GT540 94 01:17:00 339 00:17:00
LG Optimus L3 E400 114 00:42:00 321 00:23:00
LG Optimus Pro C660 103 00:32:00 184 00:24:00
LG Optimus Black P970 106 00:41:00 279 00:21:00
Total 1796 05:31:00 697 02:41:00
Table 2: Summary of the automatic stage – Participant 1.
Cycle
Ignored features – stop
features
Presented features
Time spent by the
algorithm
Features excluded by
the user
1 - 1349 00:00:60 79
2 2 2284 00:00:18 122
3 23 2813 00:00:16 40
4 24 3322 00:00:18 8
5 26 3876 00:00:18 1
6 32 4085 00:00:18 3
Table 3: Summary of the automatic stage – Participant 2.
Cycle
Ignored features –
stop features
Presented features
Time spent by the
algorithm
Features excluded by
the user
1 - 1349 00:00:36 668
2 20 1629 00:00:08 623
3 139 1645 00:00:07 48
4 103 2177 00:00:06 845
5 202 1789 00:00:08 3
6 247 2031 00:00:05 628
as their classifications, can be seen. This file also
facilitates evaluation of new products in relation to
the existing SPL.
4.1.1 Evaluation Experiment
To evaluate the semi-automatic approach to
identifying features for SPL, an experiment was
performed with two participants and manuals for six
LG smartphones. The files were pre-processed by
hand in order to obtain only the chapters that
describe functions of the devices (chapters such as
index, warranties, addresses, and accessories were
excluded) and were also “processed” to contain one
sentence per line (without the need to include
punctuation). Further, the files did not have words
that were incorrectly separated by blank spaces or
hyphenation.
Table 1 shows the time spent by each participant
participant analyzing each document, as well as the
number of features identified in each document, in
the experiment Participant 1 identified
approximately 60% more features than Participant 2
and took approximately 50% longer.
To interpret these numbers, the features
identified manually by the two participants were
analyzed and compared. Participant 1 was found to
perform a more detailed job than Participant 2 when
describing the features, finding a greater number,
and spending more time. For example, instead of
simply stating “Configure volume,” this participant
described all the ways to accomplish this
configuration, such as “Increase music volume,”
“Decrease music volume,” and “Increase radio
volume.” However, in some instances, vague
features were described by the same participant as
“Back,” “Save,” and “Share.” These features, as
described in a list that does not identify, for
example, the chapter in which they were found,
cannot be considered relevant, since they are not
clear: “Back” to where? “Save” and “Share” what?
Following the manual identification of the
features, the proposed semi-automatic approach for
the creation of the SPL was used. The participants
were instructed in the use of the process, with an
explanation of its operation, and were directed to
first analyze the identified features in order to
exclude those that were not really features, and then
to only identify synonymous features.
The time spent in the second stage of the
experiment was also recorded by the participants.
This annotation is related to the time that each
ScopingAutomationinSoftwareProductLines
87

individual needed to analyze the results and to
exclude and create synonymous features. The time
the algorithm took to extract the information from
the documents was recorded by the algorithm itself
in its execution log. The features that were excluded
by the user and those that the algorithm ignored and
did not present to the user because they were on the
list of “stop features,” since they had previously
been excluded by the user, were also recorded in the
algorithm execution log. Table 2 presents the results
obtained by Participant 1, while Table 3 presents
those obtained by Participant 2. Both tables present a
summary of this second stage.The “Cycle” column
presents the processing cycle of the algorithm. In
cycle 1, the first file is pro-cessed, thus the list of
“stop features” is empty, and no features are
automatically ignored. The features are presented to
the user (column 3), and the user analyzes and
indicates those s/he wants to exclude (col-umn 5).
When the user completes the analysis of the data
presented in the first cycle, the algorithm starts the
second cycle, i.e., it processes the second file,
gathers the results with the results of the first file,
au-tomatically ignores the features that are on the
list of “stop features,” and displays the result to the
user again. These cycles are repeated until the
information in all the files is processed, presented,
and analyzed by the user.
The first line of the column that represents the
processing time spent by the algorithm (column 4)
also includes the time necessary for the algorithm to
perform the linguistic annotation in all the
documents that are to be analyzed; consequently, the
first cycle is slower than the others.
Participant 1 excluded 253 features, all of which
were included in the list of “stop features,” resulting
in 107 features being automatically ignored (not
presented to the user). Participant 1 generated an
SPL with 4,065 features after six cycles, without
considering the features marked as synonyms during
the analysis conducted by the participant.
Participant 2 excluded 2,815 features, resulting
in 711 features being automatically ignored (not
presented to the user), because they had been
included in the list of “stop features.”
Approximately 20% of the total number of excluded
features was automatically excluded without the
need for user evaluation.
Participant 2 generated an SPL with 1,051
features after six cycles, also disregarding the
features marked as synonyms during the analysis
conducted by the participant.
With respect to time, Participant 1 completed the
entire analysis in one day, taking only 6 hours.
Participant 2 took 11 hours to complete the analysis,
but this time was distributed over six days. The
distribution of the time for the analysis over more
days arguably benefited the analysis of the second
participant, since this activity is time consuming and
requires concentration and focus in order to achieve
good results.
Analyzing the features that are part of the SPL of
the participants, created in this stage of the
experiment, several vague or inconsistent features
were again identified in the results of Participant 1;
for example, “allow according to light,” “use
according to their,” “reproduce adic list,” “Picasa
sns,” “depending on your software,” “srt file the
same,” and “knowing certain information.” Since
Participant 1 used approximately 80% less time than
Participant 2, this may have affected the quality of
the result produced, since this task is manual and
requires focus and concentration.
Participant 2 excluded approximately 1,000%
more features than Participant 1, and took
approximately 80% more time. Since more time was
taken to analyze the results, it is believed that the
analysis was conducted with more depth, and that
therefore more features were excluded and more
features were identified as synonyms, reducing the
final result of the number of features of the SPL by
approximately 74%.
Comparing the results of the semi-automatic
evaluation with the results of the manual evaluation,
the conclusion is reached that, in both cases,
Participant 1 identified a greater number of features.
However, this does not mean that the identified
features were correct, because several
inconsistencies were later found in the results by the
researcher. With respect to time spent, Participant 1
spent roughly the same amount of time in both
stages. Table 4 presents a summary of this
comparison.
Table 4: Comparison of the results of the manual and semi-automatic stages.
Participant
Time spent
(manual state)
Identified features
(manual stage)
Time spent
(semi-automatic
stage)
Identified features
(semi-automatic stage)
1 05:31:00 1796 06:00:00 4065
2 02:41:00 697 11:00:00 1051
ICEIS2015-17thInternationalConferenceonEnterpriseInformationSystems
88

Table 5: Summary of the evaluation of the new product.
Document
Features of those ignored –
stop features
Features of those
presented
Resulting features after
analysis
Common or variable features
with respect to the SPL
Motorola MB502 47 1128 314 30
TV LCD 9 328 110 2
LG-A180 20 234 81 6
LG-E405 387 673 344 145
4.2 Approach Used to Evaluate the
Variabilities and Commonalities
between the Created SPL and a
New Product
In this stage, the algorithm that evaluates whether a
new product is part of an already established SPL
was implemented. For this purpose, the three files
recorded at the time when creation of the SPL was
completed, using the approach proposed in Section
4.1, were used.
To begin the evaluation, the user indicates the
directory where the three files are located. The
algorithm then locates the XML file, reads it, and
presents the SPL to the user. On this screen, at the
end of the current list of features, the user has to
indicate the folder where the document for the new
product to be evaluated can be found.
The same processing that occurs to create a new
SPL occurs at this point for evaluation of the new
product: the file is converted to TXT format (if it is
not already in that format), receives linguistic
annotations, then features are extracted according to
the patterns searched for and organized and
presented to the user for analysis. During this
process, the list of “stop features” for the existing
SPL is also evaluated, with automatic exclusion of
the product features that are on this list.
However, after the user completes the analysis of
the results of the identified features in the new
product, excluding and making synonyms, the
evaluation process itself is conducted. A search is
conducted in the features of the existing SPL to
determine which features of the new product already
exist in the SPL. This is done to identify the features
that would be considered common or variables if the
product were incorporated into the SPL.
4.2.1 Evaluation Experiment
Analyzing the results of the experiment presented in
Section 4.1, the SPL created by Participant 2 was
selected for use in this phase as the preexisting
family, since it appeared to be the more stable of the
two created in the experiment. The following
experiments were performed:
Evaluation of a cell phone from the family of
smartphones, but from another brand;
Evaluation of a conventional cell phone of the
same brand as that used in the creation of the
SPL;
Evaluation of an LCD TV; and
Evaluation of a cell phone from the same family
of smartphones as those used to create the SPL.
For these experiments, the files were pre-processed
by hand to obtain only the chapters that describe
functions of the devices (chapters such as index,
warranties, addresses, installation, and accessories
were excluded) and were also “processed” to contain
one sentence per line (without the need to include
punctuation). Further, the files did not have words
that were incorrectly separated by blank spaces or
hyphenation. Table 5 presents a summary of the
experiments conducted. The first line of the table is
from a cell phone from the smartphone family and
the third is from a cell phone from the family of
conventional cell phones. For the smartphone, 30
identified features were also found in the existing
SPL. This represents 9.55% of the total functionality
of this product; hence, it was not considered part of
the SPL. Likewise, the other two products were also
not considered part of the SPL, since they were
found to have few features in common.
In the case of the LG-405, 145 manually
identified features were also found in the existing
SPL. This represents 42.15% of all the features of
this product; hence, it was considered part of the
SPL.
In Table 5, it can be seen that for this product,
which was considered part of the existing SPL, 387
features were automatically ignored (not presented
to the user), because they were on the list of “stop
features.” This shows that approximately 54% of the
total number of excluded features was automatically
excluded without the need for user evaluation. This
reduces the amount of time a user spends analyzing
the results, making exclusions, and marking the
synonyms. In this case, 29 minutes were spent. If the
list of “stop features” had not been implemented, it
is estimated that the time for manual analysis would
have been more than 50% longer, i.e., approximately
43 minutes.
ScopingAutomationinSoftwareProductLines
89

The next section presents discussions of the
results obtained in experiments that evaluated the
semi-automatic approaches for identifying features
and evaluating the variabilities and commonalities
be-tween an existing SPL and a new product.
5 DISCUSSION OF THE RESULTS
The results showed that the semi-automatic
approach proposed in this paper assisted in the
identification and classification of features. The
results of the comparisons conducted between the
use of the approach and the manual identification
show that the number of features identified by using
the approach was higher. Moreover, the approach
does not only identify the product features, but also
classifies them. In all the comparisons, only the
identification of the features was conducted
manually, not their classification.
The results of the experiment evaluating the
semi-automatic approach showed that the number of
features identified by the approach was greater than
that achieved manually. The time spent manually
and automatically was virtually the same for one
participant in the experiment, while for the other,
300% more time was spent on automatic processing.
In manual processing, only the features were
identified. The analysis of synonymous features and
the identification of the variabilities, in order to
create an SPL, were not performed during manual
processing. Using the proposed approach, the
participants in this experiment generated an SPL
with its features classified as common, variable, or
optional. By using the “stop features” list, the
reduction in the number of features was more than
20% for one of the participants in this experiment,
further reducing the time spent on analysis of the
features.
In the experiment that evaluated the algorithm in
order to assess whether or not a new product is part
of a pre-existing SPL, four assessments were
conducted, with the results showing that the
assessment conducted by the algorithm was correct,
and reached a specific goal. In the first three
experiments, the algorithm correctly indicated that
the products were not part of the created SPL. The
final indication was also correct: the product was
indicated as part of the SPL.
In this experiment, the effectiveness of the use of
“stop features” was confirmed once again: in one of
the products analyzed, approximately 58% of the
total number of excluded features was automatically
excluded without the need for evaluation by the user.
6 CONCLUSIONS
The approaches that address the scoping of SPLs are
unanimous in counting on the intervention of people
involved in the process, whether customers,
stakeholders, or experts in the application domain.
However, human intervention can result in errors in
scoping, along with potential problems related to
efficiency and time to conduct the processes.
Only the approach presented by John (2010)
involved an attempt to reduce the effort of this role
in the process. This work sought to automate the
process as much as possible and reduce the
intervention of people. The proposed approach
showed that it is possible to achieve these goals and
reduce effort with domain experts, given that
features are derived from existing documents, such
as user manuals, but can be substituted for meeting
minutes, specification documents, and other relevant
documents that can significantly assist in scoping an
SPL.
The main contributions of the proposed approach
can be summarized as follows:
Assisting organizations seeking to migrate to the
SPL approach to begin mapping their products,
and viewing them as families in the same domain
that share components seen as features in
common. From this point of view, it is possible
to start planning the architecture of the line and
identifying the reuse it provides;
Providing a unique way to present a product
family such that it is visible to people and
machines, enabling the implementation of
automatic processes;
Assisting in decision-making regarding the
inclusion of a new product in an existing family,
and mapping its features in relation to the
features available for reuse in the family. On the
basis of the visualization of existing
commonalities and variabilities between the
future new member and the existing family, it is
possible to decide to change features of the
family in order to address the new member,
include it, or decide to implement it exclusively
to the new product.
The main limitation of this research is related to the
fact that the experiments were conducted with users
of the selected product and not with domain experts.
Ideally, such experiments should be per-formed by
domain experts and compared with an SPL created
by them in a manual and extractive form. Another
limitation of the research is that the results depended
on evaluation by people. Errors may have occurred
ICEIS2015-17thInternationalConferenceonEnterpriseInformationSystems
90

during the analyses conducted in the experiments
and that may have altered the results, since all the
experiments were laborious.
This approach was developed over product
manuals to serve as a basis for the construction of
the SPL as well as for the identification of a new
product belonging to the SPL. This may be a
limitation in cases of software products without user
manuals. One possible approach in this case would
be to use Use Case documents, which are common
artifacts in software development.
REFERENCES
Alves, V.; Niu, N.; Alves, C.; Valença, G. 2010.
Requirements Engineering for Software Product
Lines: A Systematic Literature Review. Information
and Software Technology, v. 52.
Archer, M.; Cleve, A.; Perrouin, G.; Heymans, P.;
Vanbeneden, C.; Collet, P.; Lahire, P. 2012. On
extracting feature models from product descriptions.
In Proceedings of the Sixth International Workshop on
Variability Modeling of Software-Intensive Systems
(VaMoS '12). ACM, New York, NY, USA, pp. 45-54.
Carbon, R.; Knodel, J.; Muthig, D.; Meier, G. 2008.
Providing Feedback from Application to Family
Engineering - The Product Line Planning Game at the
Testo AG. In: 12th International Software Product
Line Conference. Limerick, Ireland, IEEE, p. 180-189.
Clements, P; Northrop, L. 2002. Software Product Lines:
Practices and Patterns. Boston: Addison-Wesley, 563
p.
Cruz, J.; Neto, P.S.; Britto, R.; Rabelo, R.; Ayala, W;
Soares, T. Mota, M. 2013. Toward a Hybrid Approach
to Gen-erate Software Product Line Portfolios. In:
2013 IEEE Congress on Evolution Computation.
Cancun, México, IEEE, pp. 2229-2236.
Duszynski, S. 2011. A scalable goal-oriented approach to
software variability recovery. In: Software Product
Lines - 15th International Conference, SPLC 2011,
Munich, Germany, August 22-26.
Ganesan, D.; Muthig, D.; Knodel, J.; Rose, D. 2006.
Discovering Organizational Aspects from the Source
Code His-tory Log during the Product Line Planning
Phase – A Case Study. IEEE International Working
Conference on Reverse Engineering (WCRE 2006),
Villa dei Papi, p. 211 -220.
John, I. 2010. Using Documentation for Product Line
Scoping. IEEE Software, vol. 27, p. 42 - 47.
John, I.; Eisenbarth, M. 2009. A Decade of Scoping: A
Survey. In: Proceedings of the 13th International
Software Product Line Conference, 1, 2009, Airport
Marriott, San Francisco, CA, USA. Pittsburgh, p. 31-
40.
John, I.; Knodel, J.; Lehner, T.; Muthig, D. 2006. A
Practical Guide to Product Line Scoping. In: Software
Product Lines: Proceedings of the 10th International
Software Product Line Conference (SPLC 2006).
Anais… Balti-more, Maryland, August 21-24.
Kampenes, Vigdis By; Dybå, Tore; Hannay, Jo E.;
Sjøberg, Dag I. K. 2009. A systematic review of quasi-
experiments in software engineering. Information and
Software Technology. Vol. 51. No. 1. pp. 71-82. DOI:
10.1016/j.infsof.2008.04.006.
Lee, J.; Kang, S.; Lee, D. H. 2010. A Comparison of
Software Product Line Scoping Approaches. In:
International Journal of Software Engineering and
Knowledge Engineering, Vol. 20, Issue 5, World
Scientific, October. pp. 637-663.
Linden, F.; Schimid, K.; Rommes, E. 2007. Software
Product Lines in Action. Springer.
Liu, Y.; Nguyen, K.; Witten, M.; Reed, K. 2010. Cross
Product Line Reuse in Component-based Software
Engineer-ing. In: 2010 International Conference on
Computer Application and System Modeling (ICCASM
2010). Tai-yuan, China, p. 427-434.
Medeiros, T.F.L.; Almeida, E.S. 2012. CodeScoping: A
Source Code Based Tool to Software Product Lines
Scoping. In: 2012 38th Euromicro Conference on
Software Engineering and Advanced Applications. p.
101-104.
Muller, J. 2011. Value-Based Portfolio Optimization for
Software Product Lines. In: Software Product Line
Confer-ence (SPLC), 2011 15th International, pp.15-
24, 22-26.
Noor, M.; Rabiser, R.; Grünbacher, P. 2008. Agile product
line planning: A collaborative approach and a case
study. The Journal of Systems and Software, vol. 81,
p. 868-882.
Noor, M.A.; Grünbacher, P.; Briggs, R.O. 2007. A
collaborative approach for Product Line Scoping : a
case study in collaboration engineering. In:
Proceedings of the 25th IASTED International Multi-
Conference. Innsbruck, Austria, p. 216 - 223.
The APACHE Software Foundation. Apache PDFBox –
Java PDF Library. Available at:
<http://pdfbox.apache.org/>. Acesso em 01. Mar.
2012.
Ullah, M.I.; Ruhe, G.; Garousi, V. 2010. Decision support
for moving from a single product to a product
portfolio in evolving software systems. The Journal of
Systems and Software, vol. 83, Dec., pp. 2496-2512.
Yoshimura, K.; Narisawa, F.; Hashimoto, K.; Kikuno, T.
2008. A Method to Analyze Variability Based on
Product Release History: Case Study of Automotive
System. In: Proc. SPLC (2), pp. 249-256.
Ziadi, T.; Frias, L.; Silva, M. M. A.; Ziane, M. 2012.
Feature Identification from the Source Code of
Product Variants. In: Software Maintenance and
Reengineering (CSMR), 2012 16th European
Conference on, pp. 417-422.
ScopingAutomationinSoftwareProductLines
91
