
JETracer
A Framework for Java GUI Event Tracing
Arthur-Jozsef Molnar
Faculty of Mathematics and Computer Science, Babes¸-Bolyai University, Cluj-Napoca, Romania
Keywords:
GUI, Event, Tracing, Analysis, Instrumentation, Java.
Abstract:
The present paper introduces the open-source Java Event Tracer (JETracer) framework for real-time tracing
of GUI events within applications based on the AWT, Swing or SWT graphical toolkits. Our framework pro-
vides a common event model for supported toolkits, the possibility of receiving GUI events in real-time, good
performance in the case of complex target applications and the possibility of deployment over a network. The
present paper provides the rationale for JETracer, presents related research and details its technical implemen-
tation. An empirical evaluation where JETracer is used to trace GUI events within five popular, open-source
applications is also presented.
1 INTRODUCTION
The graphical user interface (GUI) is currently the
most pervasive paradigm for human-computer inter-
action. With the continued proliferation of mobile
devices, GUI-driven applications remain the norm in
today’s landscape of pervasive computing. Given
their virtual omnipresence and increasing complex-
ity across different platforms, it stands to reason that
tools supporting their lifecycle must keep pace. This
is especially evident for many applications where
GUI-related code takes up as much as 50% of all ap-
plication code (Memon, 2001).
Therefore we believe that software tooling that
supports the GUI application development lifecycle
will take on an increasing importance in practition-
ers’ toolboxes. Such software can assist with many
activities, starting with analysis and design, as well
as coding, program comprehension, software visual-
ization and testing. This is confirmed when studying
the evolution of a widely used IDE such as Eclipse
(Hou and Wang, 2009), where each new version ships
with more advanced features which are aimed at help-
ing professionals create higher quality software faster.
Furthermore, the creation of innovative tools is nowa-
days aided by the prevalence of managed, flexible
platforms such as Java and .NET, which enable novel
tool approaches via techniques such as reflection,
code instrumentation and the use of annotations.
The supportive role of tooling is already well es-
tablished in the literature. In (Maalej et al., 2014),
the authors conduct an industry survey covering over
1400 professional developers regarding the strate-
gies, tools and problems encountered by professionals
when comprehending software. Among the most sig-
nificant findings are that developers usually interact
with the target application’s GUI for finding the start-
ing point of further interaction as well as the use of
IDE’s in parallel with more specialized tools. Of par-
ticular note was the finding that ”industry developers
do not use dedicated program comprehension tools
developed by the research community” (Maalej et al.,
2014). Another important issue regards open access
to state of the art tooling. As we show in the follow-
ing section, there exist commercial tools that incorpo-
rate some of the functionalities of JETracer. However,
as they are closed-source and available against signif-
icant licensing fees, they have limited impact within
the academia.
Our motivation for developing JETracer is the
lack of open-source software tools providing multi-
platform GUI event tracing. We believe GUI event
tracing supports the development of further innova-
tive tools. These may target program comprehension
or visualization by creating runtime traces or software
testing by providing real-time information about exe-
cuted code.
The present paper is structured as follows: the
next section presents related work, while the third sec-
tion details JETracer’s technical implementation. The
fourth section is dedicated to an evaluation using 5
popular open-source applications. The final section
207
Molnar A..
JETracer - A Framework for Java GUI Event Tracing.
DOI: 10.5220/0005372902070214
In Proceedings of the 10th International Conference on Evaluation of Novel Approaches to Software Engineering (ENASE-2015), pages 207-214
ISBN: 978-989-758-100-7
Copyright
c
2015 SCITEPRESS (Science and Technology Publications, Lda.)

presents our conclusions together with plans for fu-
ture work.
2 RELATED WORK
The first important work is the Valgrind
1
multi-
platform dynamic binary instrumentation framework.
Valgrind loads the target into memory and instru-
ments it (Nethercote and Seward, 2007) in a man-
ner that is similar with our approach. Among Val-
grind’s users we mention the DAIKON invariant de-
tection system (Perkins and Ernst, 2004) as well as the
TaintCheck system (Newsome, 2005). An approach
related to Valgrind is the DTrace
2
tool. Described as
an ”observability technology” by its authors (Cooper,
2012), DTrace allows observing what system compo-
nents are doing during program execution
While the first efforts targeted natively-compiled
languages from the C family, the prevalence of
instrumentation-friendly and object oriented plat-
forms such as Java and .NET spearheaded the cre-
ation of supportive tooling from platform developers
and third parties alike. In this regard we mention Or-
acle’s Java Mission Control and Flight Recorder tools
(Oracle, 2013) that provide monitoring for Java sys-
tems. Another important contribution is Javaassist,
a tool which facilitates instrumentation of Java class
files, including core classes during JVM class load-
ing (Chiba, 2004). Its capabilities and ease of use led
to its widespread use in dynamic analysis and tracing
(van der Merwe et al., 2014). As discussed in more
detail within the following sections, JETracer uses
Javaassist for instrumenting key classes responsible
for firing events within targeted GUI frameworks.
The previously detailed frameworks and tools
have facilitated the implementation of novel soft-
ware used both in research and industry targeting pro-
gram comprehension, software visualization and test-
ing. A first effort in this direction was the JOVE tool
for software visualization (Reiss and Renieris, 2005).
JOVE uses code instrumentation to capture snapshots
of each working thread and create a program trace
which can then be displayed using several visualiza-
tions (Reiss and Renieris, 2005). A different approach
is taken within Whyline, which proposes a number
of ”Why/Why not” type of questions about the target
program’s textual or graphical output (Ko and Myers,
2010). Whyline uses bytecode instrumentation to cre-
ate program traces and record the program’s graphical
output, with the execution history used for providing
answers to the selected questions.
1
http://valgrind.org/
2
http://dtrace.org/blogs
An important area of research where JETracer
is expected to contribute targets the visualization of
GUI-driven applications. This is of particular interest
as an area where research results recently underwent
large-scale industrial evaluation with encouraging re-
sults (Aho et al., 2014). A representative approach is
the GUISurfer tool, which builds a language indepen-
dent model of the targeted GUI using static analysis
(Silva et al., 2010).
Another active area of research relevant to JE-
Tracer is GUI application testing, an area with notable
results both from commercial as well as academic or-
ganizations. The first wave of tools enabling auto-
mated testing for GUI applications are represented by
capture-replay implementations such as Pounder or
Marathon, which enable recording a user’s interaction
with the application (Nedyalkova and Bernardino,
2013). The recorded actions are then replayed auto-
matically and any change in the response of the tar-
get application, such as an uncaught exception or an
unexpected window being displayed are interpreted
as errors. The main limitation of such tools lays
in limitations when identifying graphical widgets, as
changes to the target application can easily break test
case replayability. More advanced tools integrate
scripting engines facilitating quick test suite creation
such as Abbot and TestNG (Ruiz and Price, 2007).
However, existing open-source tools are limited to
a single GUI toolkit (Nedyalkova and Bernardino,
2013). Even more so, some of these tools such as
Abbot and Pounder are no longer in active develop-
ment, and using them with the latest version of Java
yields runtime errors.
These projects paved the way for commercial im-
plementations such as MarathonITE
3
, a fully-featured
and commercial implementation of Marathon or the
Squish
4
toolkit. When compared with their open-
source alternatives, these applications provide greater
flexibility by supporting many GUI toolkits such as
AWT/Swing, SWT, Qt, Web as well as mobile plat-
forms. In addition, they provide more precise wid-
get recognition algorithms which helps with test case
playback. GUI interactions can be recorded as scripts
using non-proprietary languages such as Python or
JavaScript, making it easier to modify or update test
cases. As part of our research we employed the
Squish tool for recording consistently replayable user
interaction scenarios which are described in detail
within the evaluation section. From the related work
surveyed, we found the Squish implementation to be
the closest one to JETracer. The Squish tool con-
sists of a server component that is contained within
3
http://marathontesting.com/
4
http://www.froglogic.com/squish
ENASE2015-10thInternationalConferenceonEvaluationofNovelSoftwareApproachestoSoftwareEngineering
208
the IDE and a hook component deployed within the
AUT (Froglogic, 2015). The Java implementation of
Squish uses a Java agent and employs a similar ar-
chitecture to our own framework, which is detailed
within the following section.
In contrast to commercial implementations en-
cumbered by restrictive and pricey licensing agree-
ments, we designed JETracer as an open framework
to which many tools can be connected without sig-
nificant programming effort. Furthermore, JETracer
facilitates code reuse and a modular approach so that
interested parties can add modules to support other
GUI toolkits.
The last, but most important body of research ad-
dressing the issue of GUI testing has resulted in the
GUITAR framework (Nguyen et al., 2013), which in-
cludes the GUIRipper (Memon et al., 2013) and Mo-
biGUITAR (Amalfitano et al., 2014) components able
to reverse engineer desktop and mobile device GUIs,
respectively. Once the GUI model is available, valid
event sequences can be modelled using an event-flow
graph or event-dependency graph (Yuan and Memon,
2010; Arlt et al., 2012). Information about valid event
sequences allows for automated test case generation
and execution, which are also provided in GUITAR
(Nguyen et al., 2013; Amalfitano et al., 2014).
The importance of the GUITAR framework for
our research is underlined by its positive evaluation
in an industrial context (Aho et al., 2013; Aho et al.,
2014). While GUITAR and JETracer are not inte-
grated, JETracer’s creation was partially inspired by
limitations within GUITAR caused by its implemen-
tation as a black-box toolset. One of our future av-
enues of research consists in integrating the JETracer
framework into GUITAR and using the event infor-
mation available to further guide test generation and
execution in a white-box process.
3 THE JETracer FRAMEWORK
JETRacer is provided under the Eclipse Public Li-
cense and is freely available for download from our
website (JETracer, 2015). The implementation was
tested under Windows and Ubuntu Linux, using ver-
sions 6, 7 and 8 of both Oracle and OpenJDK Java.
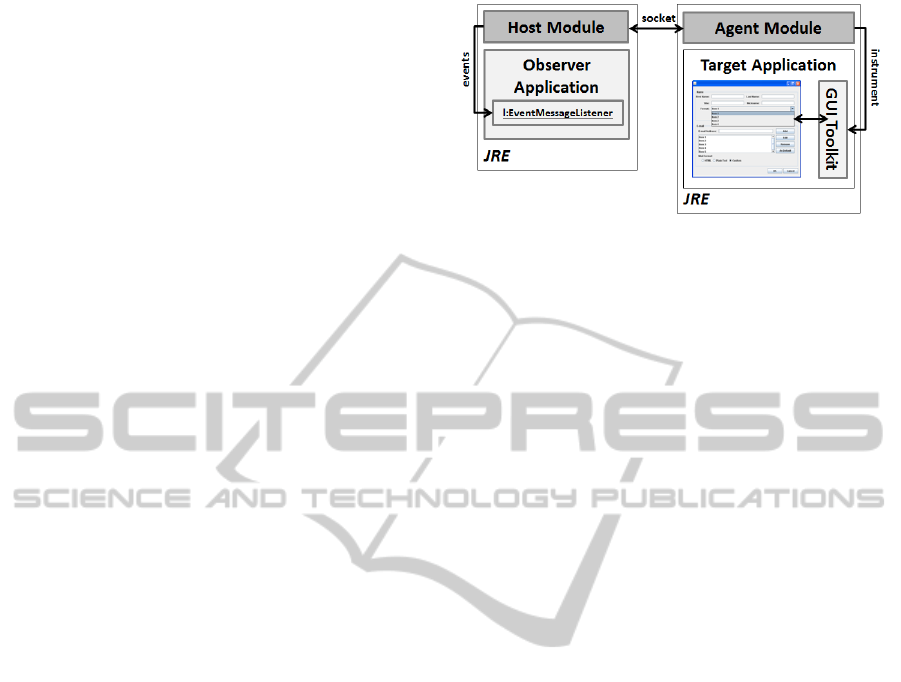
JETracer consists of two main modules: the Host
Module and the Agent Module. The agent module
must be deployed within the target application’s class-
path. The agent’s role is to record the fired events as
they occur and transmit them to the host via network
socket, while the host manages the network connec-
tion and transmits received events to subscribed han-
dlers. JETracer’s deployment architecture within a
Figure 1: JETracer deployment architecture.
target application is shown in Figure 1.
To deploy the framework, the Agent Module must
be added to the target application’s classpath, while
the Host Module must exist on the classpath of the
application interested in receiving event information,
which is illustrated in Figure 1 as the Observer Ap-
plication. Since communication between the modules
happens via network socket, the target application and
the host module need not be on the same physical ma-
chine.
The framework can be extended to provide event
tracing for other GUI toolkits. Interested parties must
develop a new library to intercept events within the
targeted GUI toolkit and transform them into the JE-
Tracer common model. Within this model, each event
is represented by an instance of the EventMessage
class. As it is this common model instance that is
transmitted via network to the host, the Host Module
implementation does not depend on the agent, which
allows reusing the host for all agents.
3.1 The Host Module
The role of the host module is to transparently man-
age the connection with the deployed agent, to config-
ure the agent and to receive and forward fired events.
The code snippet below illustrates how to initialize
the host module within an application in order to es-
tablish a connection with an agent:
InstrService is = new InstrService();
InstrConnector connector = is.configure(config);
connector.connect();
connector.addEventMessageListener(this);
The kind, type and granularity of recorded events
can be filtered using an instance of the Instrument-
Config class as detailed within the section dedicated
to the agent module. The object is passed as the sin-
gle parameter of the configure(config) method in the
code snippet above. In order to receive fired events, at
least one EventMessageListener must be created and
registered with the host, as shown above. The notifi-
cation mechanism is implemented according to Java
JETracer-AFrameworkforJavaGUIEventTracing
209

best practices, with the EventMessageListener inter-
face having just one method:
messageReceived(EventMessageReceivedEvent e);
The received EventMessageReceivedEvent in-
stance wraps one EventMessage object which de-
scribes a single GUI event using the following infor-
mation:
• Id: Unique for each event.
• Class: Class of the originating GUI component
(e.g. javax.swing.JButton)
• Index: Index in the parent container of the origi-
nating GUI component.
• X,Y, Width, Height: Location and size of the GUI
component which fired the event.
• Screenshot: An image of the target application’s
active window at the time the event was fired.
• Type: The type of the fired event (e.g.
java.awt.event.ActionEvent).
• Timers: The values for a number of high-precision
timers for measurement purposes.
• Listeners: The list of event handlers registered
within the GUI component that fired the event.
We believe that the data gathered by JETracer
opens the possibility for undertaking a wide variety of
analyses. Recording screenshots together with com-
ponent location and size allows actioned widgets to
be identified visually. Likewise, recording each com-
ponent’s index within their parent enables them to be
identified programmatically, which can help in cre-
ating replayable test cases (McMaster and Memon,
2009). Knowledge about each component’s event lis-
teners gathered at runtime has important implications
for program comprehension as well as white-box test-
ing by showing how GUI components and the under-
lying code are linked (Molnar, 2012).
3.2 The Agent Module
The role of the agent module is to record fired events
as they happen, gather event information and trans-
mit it to the host. The existing agents do most of the
work during class loading, when they instrument sev-
eral classes from the Java platform using Javaassist.
The actual methods that are instrumented are toolkit-
specific, but a common approach is employed. In the
first phase, we studied the publicly available source
code of the Java platform and identified the methods
responsible for firing events. Code which calls our
event-recording and transmission code was inserted
at the beginning and end of each such method. The
code that is instrumented belongs to the Java platform
itself, which enables deploying JETracer for all appli-
cations that use or extend standard GUI controls.
As GUI toolkits generate a high number of events,
excluding uninteresting events from tracing becomes
important in order to avoid impacting target applica-
tion performance. This is achieved in JETracer by ap-
plying the following filters:
Event granularity: Provides the possibility of
recording either all GUI events or only those that have
application-defined handlers triggered by the event.
This filter allows tracing only those events that cause
application code to run.
Event filter: Used to ignore certain event
types. For example, the AWT/Swing agent
records both low and high level events. There-
fore, a key press is recorded as three consec-
utive events: a KeyEvent.KEY PRESSED, fol-
lowed by a KeyEvent.KEY RELEASED and a
KeyEvent.KEY TYPED. If undesirable, this can be
avoided by filtering the unwanted events. In our
empirical evaluation, we observed that ignoring
certain classes of events such as mouse movement
and repaint events clear the recorded trace of many
superfluous entries and increase target application
performance.
Due to differences between GUI toolkits, the
AWT/Swing and SWT agents have distinct im-
plementations. As such, our website (JETracer,
2015) holds two agent versions: one that works
for AWT/Swing applications and one that works for
SWT. A common part exists for maintaining the com-
munication with the host and providing support for
code instrumentation, which we hopefully will enable
interested contributors to extend JETracer for other
GUI toolkits. The sections below detail the particular-
ities of each agent implementation. The complete list
of events traceable for each of the toolkits is available
on the JETracer project website (JETracer, 2015).
3.2.1 The AWT/Swing Agent
Due to the interplay between AWT and Swing we
were able to develop one agent module that is capable
of tracing events fired within both toolkits. AWT and
Swing are written in pure Java and are included with
the default platform distribution, so in order to record
events we instrumented a number of classes within the
java.awt.* and javax.swing.* packages. This proved
to be a laborious undertaking due to the way event
dispatch works in these toolkits, as many components
have their own code for firing events as well as main-
taining lists of registered event handlers. This also re-
quired laborious testing to ensure that all event types
are recorded correctly.
ENASE2015-10thInternationalConferenceonEvaluationofNovelSoftwareApproachestoSoftwareEngineering
210
3.2.2 The SWT Agent
In contrast to AWT and Swing, the SWT toolkit is
available within a separate library that provides a
bridge between Java and the underlying system’s na-
tive windowing toolkit. As such, there exist different
SWT libraries for each platform as well as architec-
ture. At the time of writing, JETracer was tested with
versions 4.0 - 4.4 of SWT under both Windows and
Ubuntu Linux operating systems.
In order to trace events, we have instrumented the
org.eclipse.swt.widgets.EventTable class, which han-
dles firing events within the toolkit (Northover and
Wilson, 2004).
4 EMPIRICAL EVALUATION
The present section details our evaluation of the JE-
Tracer framework. Our goal is to evaluate the feasi-
bility of deploying JETracer within complex applica-
tions and to examine the performance impact its var-
ious settings have on the target application. GUI ap-
plications are event-driven systems that employ call-
backs into user code to implement most functional-
ities. While GUI toolkits provide a set of graphical
widgets together with associated events, applications
typically use only a subset of them. Furthermore, ap-
plications are free to (un)register event handlers and
to update them during program execution. This vari-
ability is one of the main issues making GUI appli-
cation comprehension, visualization and testing dif-
ficult. As JETracer captures events fired within the
application under test, its performance is heavily in-
fluenced by factors outside our control. These in-
clude the number and types of events that are fired
within the application, the number of registered event
handlers as well as the network performance between
agent and host components. In order to limit external
threats to the validity of our evaluation, both modules
were hosted on the same physical machine, a mod-
ern quad-core desktop computer running Oracle Java
7 and the Windows operating system. We found our
results repeatable using different versions of Java on
both Windows and Ubuntu Linux.
4.1 Target Applications
Our selection of target applications was guided by a
number of criteria. First, we wanted applications that
will enable covering most, if not all GUI controls and
events present within AWT/Swing and SWT. Second
of all, we searched for complex, popular open-source
applications that are in active development. Last but
not least, we limited our search to applications that
were easy to set up and which enabled the creation of
consistently replayable interactions.
The selected applications are the aTunes media
player, the Azureus torrent client, the FreeMind mind
mapping software, the jEdit text editor and the Tux-
Guitar tablature editor. We used recent versions for
each application except Azureus, where due to the in-
clusion of proprietary code in recent versions an older
version was selected. aTunes, FreeMind and jEdit
employ AWT and Swing, while Azureus and Tux-
Guitar use the SWT toolkit. These applications have
complex user interfaces that include several windows
and many control types, some of which custom cre-
ated. Several of them have already been used as target
applications in evaluating research results. Previous
versions of both FreeMind and jEdit were employed
in research targeting GUI testing (Yuan and Memon,
2010; Arlt et al., 2012), while TuxGuitar was used in
researching new approaches in teaching software test-
ing at graduate level (Krutz et al., 2014).
4.2 The Evaluation Process
The evaluation process consisted of first recording
and then replaying a user interaction scenario for each
of the applications using different settings for JE-
Tracer. These scenarios were created to replicate the
actions of a live user during an imagined session of
using each application and they cover most control
types within each target application. Table 1 illus-
trates the total number of events, as well as the num-
ber of handled events that were generated when run-
ning the scenarios. Differences between the number
of generated events are explained by the fact that the
interaction scenarios were created to be of approxi-
mately equal length from a user’s perspective; the ac-
tual number of fired events is specific to each applica-
tion.
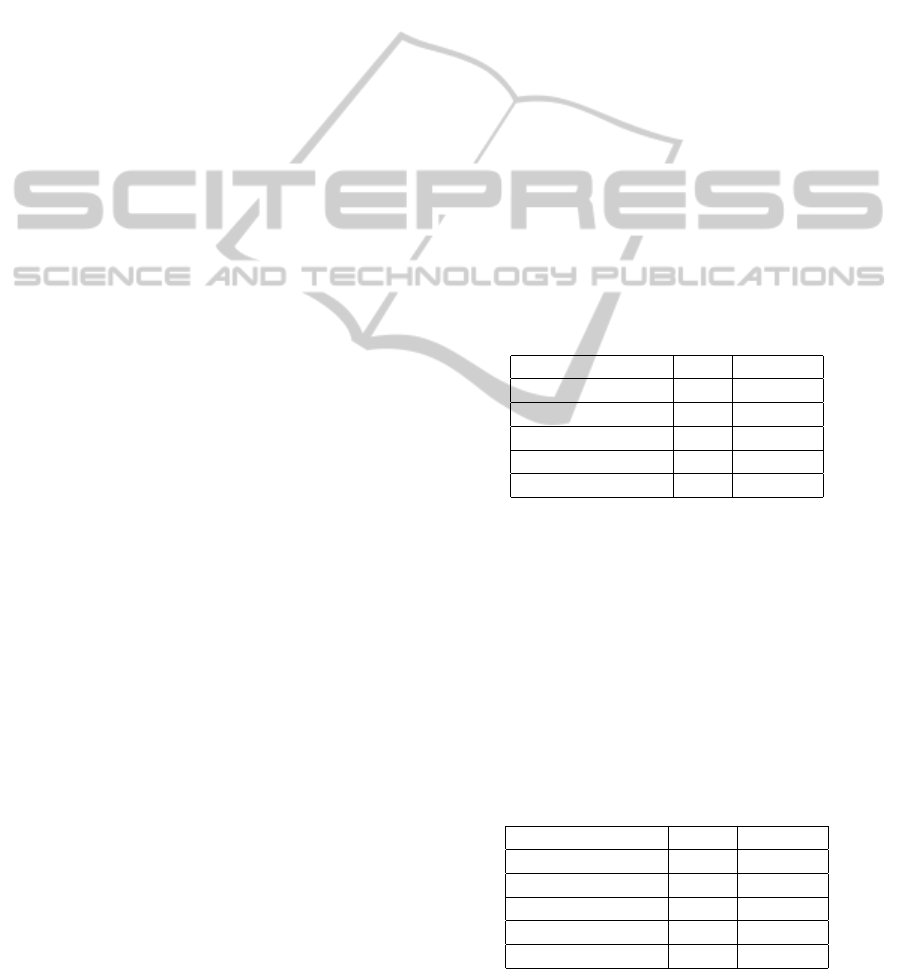
Table 1: Number of events recorded during the scenario
runs.
Application All Events Handled Events
aTunes 3.1.2 155,502 1,724
Azureus 2.0.4.0 11,149 230
FreeMind 1.0.1 356,762 5,308
jEdit 4.5.2 38,708 1,940
TuxGuitar 1.0.2 13,696 1,802
TOTAL 575,817 11,004
An important issue that affects reliable replay of
user interaction sequences is flakiness, or unexpected
variations in the generated event sequence due to
small changes in application or system state (Memon
JETracer-AFrameworkforJavaGUIEventTracing
211
and Cohen, 2013). For instance, the location of
the mouse cursor when starting the target application
is important for applications that fire mouse-related
events. In order to control flakiness, user scenar-
ios were created to leave the application in the same
state in which it was when started. Furthermore, we
employed the commercially-available Squish capture
and replay solution for recording and replaying sce-
narios. Each application run resulted in information
regarding the event trace captured by JETracer as well
as per event overhead data. We compared this event
trace with the scripted interaction scenarios in order
to ensure that our framework captures all generated
events in the correct order. All the artefacts required
for replicating our experiments as well as our results
in raw form are available on our website (JETracer,
2015).
4.3 Performance Benchmark
The purpose of this section is to present our initial
data concerning the overhead incurred when using JE-
Tracer with various settings. The most important fac-
tors affecting performance are the number of traced
events and the overhead that is incurred for each
event. Our implementation targets achieving constant
overhead in order to ensure predictable target applica-
tion performance.
Each usage scenario was repeated a number of
four times in order to assess the impact of those
two settings that we observed to impact perfor-
mance: event granularity and screenshot recording.
As GUI toolkits generate events on each mouse move,
keystroke and component repaint, tracing all events
provides a worst-case baseline for event throughput.
During our preliminary testing we found capturing
screenshots to be orders of magnitude slower than
recording other event parameters, so we also explored
its impact on the performance of our selected applica-
tions during event tracing.
As such, the four scenarios consist of tracing all
GUI events versus those having handlers installed by
the application, each time with and without record-
ing screenshots. Overhead was recorded via high-
precision timers and only includes the time required
for recording event parameters and sending the mes-
sage to the host via network socket. In order to ac-
count for variability within the environment, we elim-
inated outlier values from our data analysis.
Table 2 provides information regarding average
per event overhead obtained with screenshot record-
ing turned off. Our data shows that per-event over-
head remains consistent at around 0.1ms within all
applications, with a slightly higher value when trac-
ing handled events. These higher values are explained
by the additional information that is gathered for
these events, as several reflection calls are required to
record event handler information. Furthermore, stan-
dard deviation was in most cases below 0.2ms, show-
ing good performance consistency.
From a subjective perspective, applications instru-
mented to trace all events did not present any observ-
able slowdown. Due to the fact that FreeMind con-
sistently generated the highest number of events, we
will use it for more detailed analysis. Our interac-
tion scenario is around 6 minutes long when replayed
by a user. The incurred overhead without screenshot
recording and tracing all events was 16.5 seconds.
However, as FreeMind fires many GUI events while
initializing the application, most of the overhead re-
sulted in slower application startup, followed by con-
sistent application performance. The behaviour of the
other applications was consistent with this observa-
tion. When only handled events are traced, even ap-
plication startup speed is undistinguishable from an
uninstrumented start.
Table 2: Average overhead per event without screenshot
recording (in milliseconds).
Event granularity All Handled
aTunes 3.1.2 0.09 0.21
Azureus 2.0.4.0 0.13 0.31
FreeMind 1.0.1 0.09 0.18
jEdit 4.5.2 0.11 0.18
TuxGuitar 1.0.2 0.13 0.22
The more interesting situation is once screenshot
recording is turned on. This has a noticeable impact
on JETracer’s performance due to JNI interfacing re-
quired by the virtual machine to access OS resources.
As screenshot recording overhead is dependant on the
size of the application window, the main windows of
all applications were resized to similar dimensions
taking care not to affect the quality of user interac-
tion. Table 3 details the results obtained with screen-
shot recording enabled.
Table 3: Average overhead per event with screenshot
recording (in milliseconds).
Event granularity All Handled
aTunes 3.1.2 1.78 23.21
Azureus 2.0.4.0 31.77 34.07
FreeMind 1.0.1 2.07 27.95
jEdit 4.5.2 10.10 31.09
TuxGuitar 1.0.2 28.02 31.96
Our first observation regards the variability in the
observed overhead when tracing all events. This is
ENASE2015-10thInternationalConferenceonEvaluationofNovelSoftwareApproachestoSoftwareEngineering
212
due to the different initialization sequences of the ap-
plications. We found that both aTunes and FreeMind
do a lot of work on startup, and since at this point
their GUI is not yet visible and so screenshots are
not recorded, this lowers the reported average value.
These events must still be traced however, as they are
no different to events fired once the GUI is displayed.
The situation is much more balanced once only han-
dled events are traced, in which case we observe that
all applications present similar overhead, between 20
and 30ms per event.
Subjectively, turning screenshot recording on re-
sulted in moderate performance degradation when
tracing handled events, as the applications became
less responsive to user input. In the case of Free-
Mind, the overhead added another 55 seconds to our
6 minute interaction scenario, but the application re-
mained usable. As expected, the worst degradation
of performance was observed when screenshots were
recorded for all events fired. This made all 5 ap-
plications unresponsive to user input over periods of
several seconds due to the large number of recorded
screenshots. To keep our scripts replayable without
error, they had to be adjusted by inserting additional
wait commands between steps. In this worst case,
added overhead was 6.5 minutes for FreeMind and
over 3 minutes for both jEdit and TuxGuitar. This
performance hit can be alleviated by further filtering
the events to be traced. However, a complete evalu-
ation of this is target application-specific and out of
our scope.
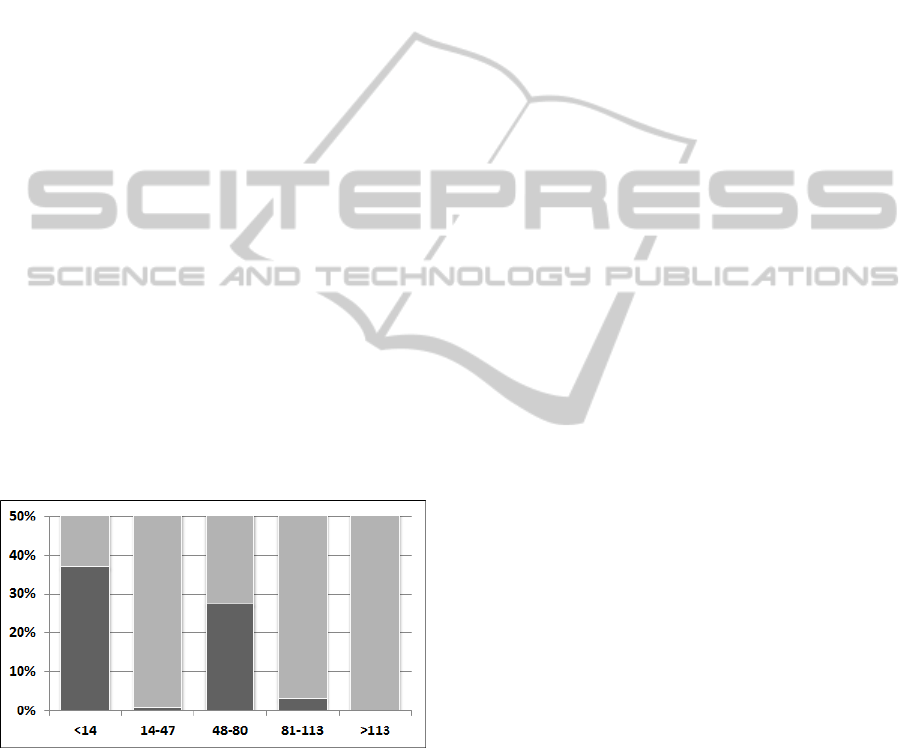
Figure 2: Distribution of incurred overhead (milliseconds)
when tracing handled FreeMind events.
An important aspect regarding target application
responsiveness is the consistency of the incurred over-
head. As most GUI toolkits are single-thread, incon-
sistent overhead leads to perceived application slow-
down while the GUI is unresponsive. We examined
this issue within our selected application, and will re-
port the results for FreeMind, as we found it to be
representative for the rest of the applications. First of
all, with screenshot recording disabled all events were
traced under 1ms, which did not affect application
performance. As such, we investigated the issue of
consistency once screenshot recording was enabled.
Figure 2 illustrates overhead distribution when trac-
ing handled events. Each column represents one stan-
dard deviation from the recorded average of 27.95ms.
Overhead clumps into two columns: the leftmost col-
umn illustrates events for which screenshots could not
be captured as the GUI was not yet visible, while most
other events were very close to the mean.
One of our goals when evaluating JETracer was
to compare its performance against other, similar
toolkits. However, during our tool survey we were
not able to identify similar open-source applications
that would enable an objective comparison. Exist-
ing applications that incorporate similar functionali-
ties, such as Squish are closed-source so a compara-
tive evaluation was not possible.
5 CONCLUSIONS AND FUTURE
WORK
We envision JETracer as a useful tool for both
academia and the industry. We aim for our future
work to reflect this by extending JETracer to cover
other toolkits such as JavaFX as well as Java-based
mobile platforms such as Android. Second of all, we
plan to incorporate knowledge gained within our ini-
tial evaluation in order to further reduce the frame-
work’s performance impact on target applications.
We plan to reduce the screenshot capture overhead as
well as to examine possible benefits of implementing
asynchronous event transmission between agent and
host.
Our plans are to build on the foundation estab-
lished by JETracer. We aim to develop innovative ap-
plications for program comprehension as well as soft-
ware testing by using JETracer to provide more infor-
mation about the application under test. We believe
that by integrating our framework with already estab-
lished academic tooling such as the GUITAR frame-
work will enable the creation of new testing method-
ologies. Furthermore, we aim to contribute to the
field of program comprehension by developing soft-
ware tooling capable of using event traces obtained
via JETracer. Integration with existing tools such as
EclEmma will allow for the creation of new tools to
shift the paradigm from code coverage to event and
event-interaction coverage (Yuan et al., 2011) in the
area of GUI-driven applications.
JETracer-AFrameworkforJavaGUIEventTracing
213

REFERENCES
Aho, P., Suarez, M., Kanstren, T., and Memon, A. (2013).
Industrial adoption of automatically extracted GUI
models for testing. In Proceedings of the 3rd Interna-
tional Workshop on Experiences and Empirical Stud-
ies in Software Modelling. Springer Inc.
Aho, P., Suarez, M., Kanstren, T., and Memon, A. (2014).
Murphy tools: Utilizing extracted gui models for in-
dustrial software testing. In The Proceedings of the
Testing: Academic & Industrial Conference (TAIC-
PART). IEEE Computer Society.
Amalfitano, D., Fasolino, A. R., Tramontana, P., Ta, B. D.,
and Memon, A. M. (2014). Mobiguitar – a tool for
automated model-based testing of mobile apps. IEEE
Software.
Arlt, S., Banerjee, I., Bertolini, C., Memon, A. M., and
Schaf, M. (2012). Grey-box gui testing: Efficient
generation of event sequences. Computing Research
Repository, abs/1205.4928.
Chiba, S. (2004). Javassist: Java bytecode engineering
made simple. Java Developer Journal.
Cooper, G. (2012). Dtrace: Dynamic tracing in Oracle So-
laris, Mac OS X, and Free BSD. SIGSOFT Softw. Eng.
Notes, 37(1):34–34.
Froglogic, G. (2015). http://doc.froglogic.com/squish/.
Hou, D. and Wang, Y. (2009). An empirical analysis of the
evolution of user-visible features in an integrated de-
velopment environment. In Proceedings of the 2009
Conference of the Center for Advanced Studies on
Collaborative Research, CASCON ’09, pages 122–
135, New York, NY, USA. ACM.
JETracer (2015). https://bitbucket.org/arthur486/jetracer.
Ko, A. J. and Myers, B. A. (2010). Extracting and answer-
ing why and why not questions about java program
output. ACM Trans. Softw. Eng. Methodol., 20(2):4:1–
4:36.
Krutz, D. E., Malachowsky, S. A., and Reichlmayr, T.
(2014). Using a real world project in a software test-
ing course. In Proceedings of the 45th ACM Technical
Symposium on Computer Science Education, SIGCSE
’14, pages 49–54, New York, NY, USA. ACM.
Maalej, W., Tiarks, R., Roehm, T., and Koschke, R. (2014).
On the comprehension of program comprehension.
ACM Trans. Softw. Eng. Methodol., 23(4):31:1–31:37.
McMaster, S. and Memon, A. M. (2009). An extensible
heuristic-based framework for gui test case mainte-
nance. In Proceedings of the IEEE International Con-
ference on Software Testing, Verification, and Vali-
dation Workshops, pages 251–254, Washington, DC,
USA. IEEE Computer Society.
Memon, A., Banerjee, I., Nguyen, B., and Robbins, B.
(2013). The first decade of gui ripping: Extensions,
applications, and broader impacts. In Proceedings of
the 20th Working Conference on Reverse Engineering
(WCRE). IEEE Press.
Memon, A. M. (2001). A comprehensive framework for
testing graphical user interfaces. PhD thesis.
Memon, A. M. and Cohen, M. B. (2013). Automated test-
ing of gui applications: models, tools, and controlling
flakiness. In Proceedings of the 2013 International
Conference on Software Engineering, ICSE ’13, pages
1479–1480, Piscataway, NJ, USA. IEEE Press.
Molnar, A. (2012). jSET - Java Software Evolution Tracker.
In KEPT-2011 Selected Papers. Presa Universitara
Clujeana, ISSN 2067-1180.
Nedyalkova, S. and Bernardino, J. (2013). Open source cap-
ture and replay tools comparison. In Proceedings of
the International C* Conference on Computer Science
and Software Engineering, C3S2E ’13, pages 117–
119, New York, NY, USA. ACM.
Nethercote, N. and Seward, J. (2007). Valgrind: A frame-
work for heavyweight dynamic binary instrumenta-
tion. In Proceedings of the 2007 ACM SIGPLAN Con-
ference on Programming Language Design and Im-
plementation, PLDI ’07, pages 89–100, New York,
NY, USA. ACM.
Newsome, J. (2005). Dynamic taint analysis for automatic
detection, analysis, and signature generation of ex-
ploits on commodity software. In Internet Society.
Nguyen, B. N., Robbins, B., Banerjee, I., and Memon, A.
(2013). Guitar: an innovative tool for automated test-
ing of gui-driven software. Automated Software Engi-
neering, pages 1–41.
Northover, S. and Wilson, M. (2004). SWT: The Standard
Widget Toolkit, Volume 1. Addison-Wesley Profes-
sional, first edition.
Oracle, C. (2013). Advanced Java Diagnostics and Monitor-
ing Without Performance Overhead. Technical report.
Perkins, J. H. and Ernst, M. D. (2004). Efficient incremental
algorithms for dynamic detection of likely invariants.
SIGSOFT Softw. Eng. Notes, 29(6):23–32.
Reiss, S. P. and Renieris, M. (2005). Jove: Java as it hap-
pens. In Proceedings of the 2005 ACM Symposium on
Software Visualization, SoftVis ’05, pages 115–124,
New York, NY, USA. ACM.
Ruiz, A. and Price, Y. W. (2007). Test-driven gui develop-
ment with testng and abbot. IEEE Softw., 24(3):51–57.
Silva, J. a. C., Silva, C., Gonc¸alo, R. D., Saraiva, J. a., and
Campos, J. C. (2010). The GUISurfer Tool: Towards
a Language Independent Approach to Reverse Engi-
neering GUI Code. In Proceedings of EICS 2010,
pages 181–186, New York, NY, USA. ACM.
van der Merwe, H., van der Merwe, B., and Visser, W.
(2014). Execution and property specifications for jpf-
android. SIGSOFT Softw. Eng. Notes, 39(1):1–5.
Yuan, X., Cohen, M. B., and Memon, A. M. (2011). Gui in-
teraction testing: Incorporating event context. IEEE
Transactions on Software Engineering, 37(4):559–
574.
Yuan, X. and Memon, A. M. (2010). Generating event
sequence-based test cases using gui run-time state
feedback. IEEE Transactions on Software Engineer-
ing, 36(1).
ENASE2015-10thInternationalConferenceonEvaluationofNovelSoftwareApproachestoSoftwareEngineering
214
